HAL Id: hal-02799595
https://hal.inrae.fr/hal-02799595
Submitted on 5 Jun 2020
HAL is a multi-disciplinary open access archive for the deposit and dissemination of sci-entific research documents, whether they are pub-lished or not. The documents may come from teaching and research institutions in France or abroad, or from public or private research centers.
L’archive ouverte pluridisciplinaire HAL, est destinée au dépôt et à la diffusion de documents scientifiques de niveau recherche, publiés ou non, émanant des établissements d’enseignement et de recherche français ou étrangers, des laboratoires publics ou privés.
Chains performances cross-countries comparison :
France and Spain local and global tomato supply chains
Yuna Chiffoleau, Gonzalo Gamboa, Camille Maffezzoli, Marina Di Masso,
Sara Mingorria
To cite this version:
Yuna Chiffoleau, Gonzalo Gamboa, Camille Maffezzoli, Marina Di Masso, Sara Mingorria. Chains performances cross-countries comparison : France and Spain local and global tomato supply chains. [Technical Report] 2015. �hal-02799595�
2015
Case Study XY(Task 3.5) Authors – Partner
The research leading to these results has received funding from the European Union’s Seventh Framework Programme for research, technological development and demonstration under grant agreement n° 311778
UAB Gamboa G., Di Masso M., Mingorria S.
INRA – Chiffoleau, Y., Maffezzoli, C.
(2015) Glamur project : Chains performances cross-countries comparison : France and Spain local and
Global tomato supply chains
To be quoted as:
Chiffoleau Y., Gamboa G., Maffezzoli C., Di Masso, M., Mingorría, S. (2015) Chains performances cross-countries
comparison
:
France
and
Spain
local
and
global
tomato
supply
chains
Summary
Summary ... 3
1 Introduction ... 4
2 Data and methodology ... 5
2.1 Product and supply chains... 5
2.1.1 Spanish tomato chains ... 5
2.1.2 French tomato chains ... 5
2.2 Indicators ... 7
Method and data collection ... 10
2.2.1 Methodology for the Spanish case study of tomato supply chains ... 10
2.2.2 Methodology for the French case study of tomato supply chains ... 11
2.2.3 Focus on LCA approach for environmental impacts assessment ... 12
3 Results ... 13
3.1 Local versus global ... 16
3.1.1 Spain ... 16
3.1.2 France ... 17
3.2 Trade-offs ... 23
3.2.1 Trade-offs in the Spanish case ... 23
3.2.2 Trade-offs in the French case ... 24
3.3 Cross-cutting issues ... 26
3.3.1 Structure of the chains ... 26
3.3.2 Contribution to economic development ... 26
3.3.3 Creation and distribution of added value ... 26
3.3.4 Environmental performance ... 26
3.3.5 Research gaps and questions ... 27
4 Conclusion ... 29
1 Introduction
The main purposes of this document are; to present a pair wise comparison of the performance of local and global tomato supply chains in the French and Spanish contexts. Moreover, the objective is to make progress on methodological issues and trade-offs resulting when measuring and comparing the impact of food chains. The overall aim is to tackle the GLAMUR objective 3 through two main research questions: How can existing measurement methods be improved? And, are local food chains better than global food chains?
In both countries we evaluated the multidimensional performance of one local supply chain and one global chain. In a previous report we presented how data for those chains was gathered and how the performance was evaluated in each country (see Gamboa et al., 2014 and Bellec-Gauche et al., 2014). Findings from this evaluation are now compared between the two countries.
The research was conducted in the framework of the GLAMUR project. In this project we investigate and compare „local‟ and „global‟ food chains and we evaluate the performance of food chains related to different dimensions (the economic, social, environmental, health and ethical dimension). Other European teams have been working on dairy products, meat, bread, wine and other fruits and vegetables. Insights from this research project will be used to inform European policy makers and other decision-makers about the possible benefits and the trade-offs of relocalizing the food system.
In the following section we describe the supply chains selected for both Spanish and French case studies. We will further present the frame work and the methodology used in both national supply chain performance reports (WP3). Regarding WP4 case study comparison objectives, some change and adaptation methodology are explained, as well as the choice of common indicators and the way to assess them.
The second session will present comparative results for all chains, by country. This compare both local and global supply chain performances, so has to identify specific trade-offs and thus, cross cutting issues between the two countries. By crossing economic, social and environmental results and trade-offs on local and global chain comparison, we have sought to highlight (i) the relative performance of local chains versus global chains between Spain and France; (ii) the relevant dimensions to be considered for analysing the tomato supply chains performances in the Spanish and French contexts and the relations (correlation, trade-offs, dilemmas) between them? (iii) The cross-cutting issues and emerging thematic questions and priorities for further in-depth investigation.
Finally the report includes a discussion on the research gaps and methodological flaws of the present study and a conclusion.
2 Data and methodology
2.1 Product and supply chains
2.1.1 Spanish tomato chains
In the Spanish case, we have analysed three fresh organic tomato food supply chains: local, mixed, and global: (1) The Local supply chain consists of a network of small size (less than 1 to 4 hectares) agro-ecological farmers, with 2 to 5 workers (including the farmer), producing a diversity (up to 20 products) of seasonal vegetables that are sold directly (i.e. vegetable basket scheme)to individuals or consumers‟ groups. Most of the seeds are reproduced within the farm or obtained from an organic seed bank. Production tasks are performed mostly manually or with small machinery. Locally obtained manure is used as fertilizer. After production and harvesting, tomatoes are processed on-farm. Processing consists mainly of cleaning the product and preparing individual boxes and/or bulk products. Transport to the distribution points is carried out by one or two members of the project.
(2) The Mixed supply chain is characterized by a medium size farmer, producing tomatoes in semi-diversified farms (6-7 products) of 2-3 hectares, in Catalonia. Production is carried out outdoors, according to organic principles, and some paid labour is hired during the summer. Tomatoes are sold through an organic wholesale cooperative in Barcelona, of which the farmer is a partner. The wholesale cooperative sales tomatoes (among other fruits and vegetables) to organic shops specialized in fruits and vegetables.
(3) In the Global supply chain, tomatoes are grown in 3 hectares average greenhouses in Almeria (south of Spain), over substrate and using an automated dripping system to delivers nutrients to the plants. Organic monoculture production principles are followed according to certification schemes, using inputs purchased in the market. Seeds are mostly commercial hybrids. Processing takes place on-farm and consists on cleaning and packaging the tomatoes, which are then transported 800 km to the aforementioned organic wholesale cooperative in Barcelona. About 20% of the production is sold to the organic wholesaler in Barcelona. The rest is sold to other intermediaries and to private auctions, usually at lower prices than to the wholesaler in Barcelona (0.5 €/Kg in average, against 1.59 €/Kg). It has to be noticed that the transport from Almeria to Barcelona is afforded by the producer. As final retail stage we have considered small grocery stores specialized in organic products.
2.1.2 French tomato chains
The French team studied also three tomato chains, corresponding to three representative cases of vegetable chains in France : the scope of the chains are presented in ANNEX 1 and 2. The diagrams describe each step of the supply chain from the supply in inputs to the distribution of tomatoes in France.
(1&2) Local organic and conventional tomato chains in Languedoc-Roussillon, South of France: production is located 150 km around Montpellier and is sold on-farm or on local markets (the two main outlets in France regarding short chains). Farms producing tomatoes and selling them through local chains are equally distributed between small (<1ha), medium (1<<3ha) and large farms (>3ha). We focused on small and medium farms. Most of them produce both hybrid and ancient varieties during the summer season only, under non-warmed shelters. 10% of them are in certified organic farming.
(3)The global conventional tomato chain is represented in our study by tomatoes produced in Almeria, Spain (one of the most important providers of tomato for France), collected and sold through a cooperative system. We chose to study this system because wholesale markets are declining; cooperatives and producer organizations, both in Spain and France, now negotiate directly with supermarkets. Spanish tomatoes are hybrid varieties of different types (round, cluster, cocktail…), produced in non-warmed greenhouses with a reconstituted soil. They are exported to France from December to June (i.e. in counter-season). The produce is collected and packaged in Almeria by the
1rst degree cooperative, then sent from Almeria to the logistic platform of the Spanish 2nd degree cooperative (logistic platform) based in the Saint-Charles wholesale market in Languedoc-Roussillon, France (about 1,200 km, in refrigerated trucks 7-8°C).This platform sends produce every day to buyers, among which supermarkets buying centres represent 65% of the market share. We choose this final stage: a supermarket in Montpellier.
The main characteristics of the chains studied by the Spanish and the French teams, according to the 4 criteria of distinction between local and global, and to additional key information is presented in ANNEX 3. It allows understanding differences between references chosen by team to illustrate local and global chains. Description of systems and territory we consider in this study is necessary to contextualize results for an analysis of levers and constraints influencing chains performances.
2.2 Indicators
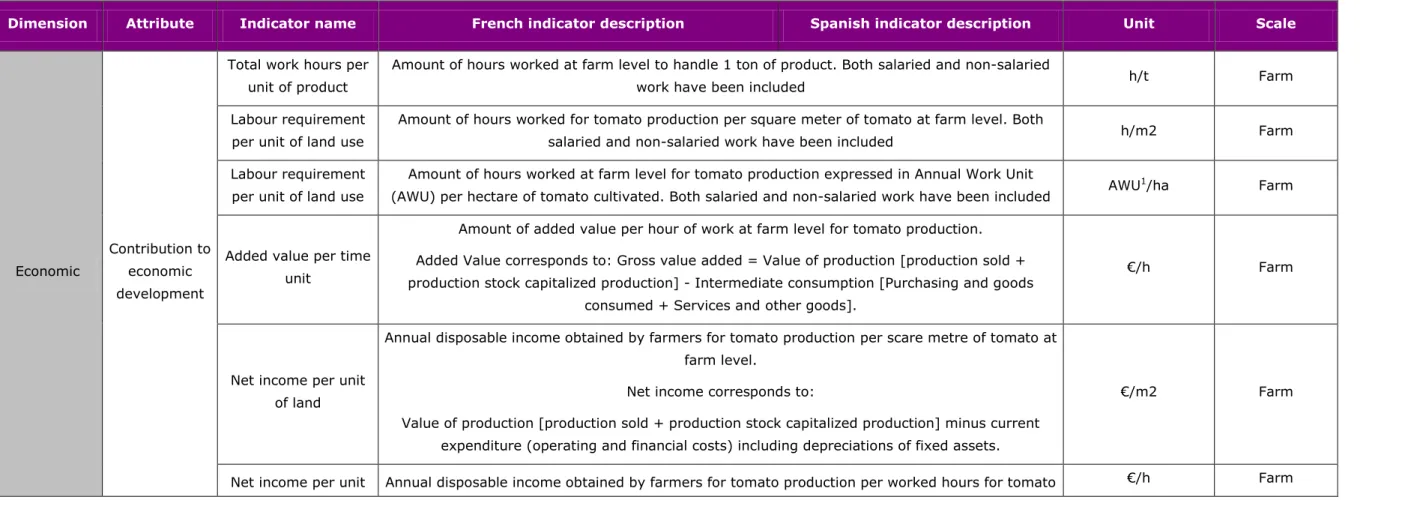
The following table presents the common set of indicators used for this comparative report. Table 1 : Common set of performance indicators
Dimension Attribute Indicator name French indicator description Spanish indicator description Unit Scale
Economic
Contribution to economic development
Total work hours per unit of product
Amount of hours worked at farm level to handle 1 ton of product. Both salaried and non-salaried
work have been included h/t Farm
Labour requirement per unit of land use
Amount of hours worked for tomato production per square meter of tomato at farm level. Both
salaried and non-salaried work have been included h/m2 Farm
Labour requirement per unit of land use
Amount of hours worked at farm level for tomato production expressed in Annual Work Unit
(AWU) per hectare of tomato cultivated. Both salaried and non-salaried work have been included AWU
1/ha Farm
Added value per time unit
Amount of added value per hour of work at farm level for tomato production. Added Value corresponds to: Gross value added = Value of production [production sold + production stock capitalized production] - Intermediate consumption [Purchasing and goods
consumed + Services and other goods].
€/h Farm
Net income per unit of land
Annual disposable income obtained by farmers for tomato production per scare metre of tomato at farm level.
Net income corresponds to:
Value of production [production sold + production stock capitalized production] minus current expenditure (operating and financial costs) including depreciations of fixed assets.
€/m2 Farm
Net income per unit Annual disposable income obtained by farmers for tomato production per worked hours for tomato €/h Farm
1
The labour is expressed in annual work unit (AWU), distinguishing salaried workforce and unsalaried workforce (family labour, trainees, and volunteers). In France, one AWU is 229 working days per year, 1,607 hours for full time contract. In Spain 1 AWU = 1,800 hours, 225 working days.
of labour at farm level.
It is calculated by subtracting the direct and indirect costs of production and the taxes to the gross income. The result is divided by the human activity allocated to tomato crop system2 production
Economic
Creation and distribution of
added value
Added value per ton
Added Value for tomato production per ton of tomato produced at farm level Gross value added = Value of production [production sold + production stock capitalized production] - Intermediate consumption [Purchasing and goods consumed + Services and other
goods ]
€/Ton Farm
Added value per land
use Added Value for tomato production per square metre of tomato at farm level €/m2 Farm Share of margin at
farm level
Margin is obtained dividing the price paid to producer for 1 kg of tomatoes by the price paid by
consumers % Farm
Share of margin at wholesale level
Margin is obtained dividing the price paid to wholesaler for 1 kg of tomatoes by the price paid by
consumers % Wholesaler
Share of margin at
retail level Margin is obtain dividing the price paid to retailer for 1 kg of tomatoes by price paid by consumers % Retail Land productivity at
farm level Amount of product obtained per unit of labour Kg/h Farm
Yield Amount of product obtained per unit of land use Ton/ha Farm
Socio-
Economic Affordability Food availability
Number of months where tomatoes are available for consumers
Availability of food at distribution stage. Months Chain
2
Retail Price Sale prices to consumers €/Kg Chain
Environmental
Resource Use
Direct fuel use (SP) Fossil energies use
per unit of product(FR)
Use of Non-renewable, fossil energies3 : Cumulative energy
demand includes the direct and indirect energy use.
Use of direct fossil energy (transport and machinery) per ton
of tomato
MJ/kg Chain (farm)
Fuel use intensity (SP) Fossil energies use per unit of land (FR)
Fossil energies at farm level Use of direct fossil energy per unit
of land use. GJ/ha Farm
Pollution
GHG emissions per volume
CO2 emissions from LCA approach in Agri-balyse database (ANNEX 4)
CO2 emissions from combustion of
fossil fuels, per unit of product g CO2 eq./kg Chain (FR Farm) GHG emissions per
land unit
CO2 emissions from LCA approach in Agri-balyse database (ANNEX 4)
CO2 emissions from combustion of
fossil fuels, per unit of land use ton CO2 eq./ha Farm
Biodiversity Agro-biodiversity Number of crops present in the farm Nr crops/ha Farm
3
Method and data collection
2.2.1 Methodology for the Spanish case study of tomato supply chains
2.2.1.1 Methods
In the Spanish case, the definition of performance indicators has been guided by the MuSIASEM approach (Giampietro et al. 2009), which is an operationalization of the fund-flow model developed by Georgescu-Roegen (1971). According to this, any metabolic system can be represented by using fund and flow categories. On the time scale of the representation, fund categories transform inflows into outflows, and flows are either consumed or generated in order to reproduce the funds. Therefore, fund categories remain “the same” over the duration of the representation (e.g. capital, people, Ricardian land). Flow categories refer to elements appearing and/or disappearing over the duration of the representation (e.g. added value, water, energy, matter). What we call production is in reality a transformation process of resources into useful products and waste products: a transformation of some materials into others (the flow elements) by some agents (the fund elements). An analysis based on the MuSIASEM approach differentiates those categories that have to be reproduced, from those that are used for the reproduction of the system and its compartments; that is, the fund and flow categories.
One can combine fund and flow categories in order to characterize the system in quantitative terms. As a result, we can define extensive and intensive indicators:
Extensive indicators are those that can be added. They characterize the size of the system and its compartments in terms of either fund categories representing what the system is, or flow categories representing what the system
does.
Intensive indicators are those that represent a ratio. They describe how the system does what it does. When these ratios are constructed with funds or flows categories referring to different levels, these fundk-1/fundk and flowk-1/flowk shares represent the relative sizes of lower-level fund elements compared to upper-levels fund elements. They provide information on the structural relation between the functional parts. When the ratios are constructed with fund and flow categories referring to the same level, a flowk/fundk ratio represents the speed and intensity of the system‟s metabolic processes.
2.2.1.2 Data collection
The Spanish case study has involved primary and secondary data collection.
In the first case, primary data collection encompasses two main methods to record time and resource allocation: (i) activity log, and (ii) in-depth interviews.
The activity log has been applied to one small farm involved in the Local supply chain. Data collection took place from April to November 2013. Farmers were asked to record all activities related to tomato production, including time and resources (e.g. land, machinery, equipment) allocated to the activity. The information collected by means of the activity log encompasses the following issues : Time allocated to tomato production, differentiating between preparation and agricultural tasks, and labour costs; amount of seedling and their cost; amount of organic agrochemicals applied and their costs; use of machinery and equipment (time and cost); land allocated for tomatoes cultivation and its productivity; time allocated to prepare boxes of vegetables, and amount of vegetables and tomatoes per type of box; and distance and time used to distribute vegetable boxes. After collecting the
information, some production parameters were calculated (e.g. land productivity, direct and indirect costs) and compared with figures in the literature in order to check the reliability of the gathered data.
In-depth interviews were carried out with two farmers (Local and Mixed), two wholesalers and one retailer involved in the different tomato supply chains. A common objective of the interviews was to describe the operation of the different stages in which actors participate. The main aspects considered in the interview encompass the following issues: description of productive, distribution and retail activities (depending on the actor interviewed); description of operational aspects of the enterprise (advantages and obstacles of the supply chain in which they participate); relations with other actors of the chain; and perception of other supply chains and actors. Interviews also served to complement data collected by means of the time and resource allocation questionnaire. Interviewees were asked about salaries, purchase and sale prices, and amount of product produced/distributed/sold, among other issues. In the case of wholesalers, they were asked to provide the following information (per year): labour costs and labour requirements; costs of equipment, machinery and transport; cost of renting the premises; costs of energy carriers consumption (electricity, natural gas and diesel); total turnover in monetary (i.e. €) and mass terms (i.e. Kg); turnover of fruits and vegetables, in monetary (i.e. €) and mass terms (i.e. Kg); turnover of salad tomatoes, in monetary (i.e. €) and mass terms (i.e. Kg); share of total sales, in monetary (i.e. €) and mass terms (i.e. Kg), to different customers (e.g. retail shops, school canteens, small distributors); share of vegetable sales, in monetary (i.e. €) and mass terms (i.e. Kg), to different customers (e.g. retail shops, school canteens, small distributors); share of salad tomato sales, in monetary (i.e. €) and mass terms (i.e. Kg), to different customers (e.g. retail shops, school canteens, small distributors); origin of products, in monetary (i.e. €) and mass terms (i.e. Kg); origin of vegetables, in monetary (i.e. €) and mass terms (i.e. Kg); origin of salad tomatoes, in monetary (i.e. €) and mass terms (i.e. Kg)
In the case of the medium size farmer involved in the Mixed supply chain, data correspond to 2014. The information given by the organic wholesaler corresponds to the period between July 2013 and June 2014.
As for secondary data collection, sources have been used to both check the quality of data obtained by primary data collection techniques and to complement that information. (The main sources of secondary data can be found in the Spanish WP3 tomato case study report.)
2.2.2 Methodology for the French case study of tomato supply chains
In France, the case study has been driven by two theoretical and methodological frames:
Economic sociology: economic practices (here, from production to consumption) are embedded in social structures (networks, values, institutions) which impacts their forms and results (Granovetter, Swedberg, 2011). This frame is a way to contextualise economic performance, and to understand its factors and mechanisms;
Social and solidary economy: different dimensions of performances may be assessed through “new indicators of wealth” (Gadrey, Jany-Catrice, 2006); those indicators may be quantitative data or specific practices, which have to be assessed according to the context and to the objectives of actors.
These two frames have been used to make the GLAMUR framework operational, from the set of research questions on tomato chains performance which we built on press review and interviews of experts in collaboration with the Spanish team. From the GLAMUR common list of 24 attributes, we selected the most relevant ones regarding our questions and, with the help of literature and experts, detailed each one in several sub-indicators, either quantitative or qualitative. Qualitative indicators correspond to diverse modalities of practices, good or bad
regarding sustainability, or to the diverse factors (key practices, devices…) which can influence positively or negatively the performance; they thus can be scored. They do not correspond to perceptions.
Concerning a part of the environmental performance, we based our study on LCA methodology.
Our final list contained 13 attributes and 31 indicators, covering all sustainability dimensions. In concordance with our socio-economic profile, the GLAMUR project was an opportunity for us to test the relevance and the feasibility of new kinds of indicators in order to assess food chain performance, especially in the social dimension.
Among this list, 9 indicators, the most quantitative ones, are common with the Spanish team. This report presents the results of each chain, regarding these indicators; each team presents and discusses the results of the three chains which it studied. Nevertheless, both countries choose to compare its results directly, without calculating a performance score. The limiting element in performance assessment for this specific case was the selection of representative common benchmarks. In the WP3, benchmarks were selected following the recommendation of tomato chain specialists, based on reference values for quantitative indicators and, on “a set of targeted measures and practices” for qualitative indicators. Both Spanish and French team decided to implement WP4 approach without selecting benchmarks adapted to both agro-food systems, in order not to distort observed results by comparing the current situation analysed in local and global chains, with an ideal value not justified or non-realistic.
2.2.3 Focus on LCA approach for environmental impacts assessment
The GLAMUR project also appeared as an opportunity to apply the LCA approach on several cases. Tomato chains would have been good cases. However, LCA is complex to apply, may be developed with different methods and boundaries, and needs a lot of data. We thus reduced our approach to the review of the secondary most relevant data according to our study cases: for the local chains, we used the AGRI-Balyse 2015 database (data about conventional and organic produce in France, including tomato produced under non-warmed shelters) linked with the SIMAPRO software; this software uses the IPCC 2006 model for calculation. For the global chain, we relied on Torrellas and al. (2012) study which used the CML 2001 method of calculation. We thus compared the two models of calculation with the same basic data and both models led to the same results. Then, the secondary data on “GHG emissions” of local and global tomato chains at the farm level can be compared.
Primary and secondary data sources
Data sources Local chains in France Global chain from Spain to France
Primary data (quantitative and qualitative)
Local farmers (sample of 60, among which 10 with exhaustive economic data).
In-depth-interviews and follow-up of practices for several years, in the frame of other research projects
1 Director of the 2nd degree cooperative platform based in the wholesale market of St Charles, near Perpignan 1 Fruits and Vegetables coordinator for supermarket buying centre near Montpellier
Secondary data Databases and national statistics Regional department of Agriculture Articles
Professional reports Interviews of experts
Book keeping of the cooperatives considered in the study case
Reports of Dauvergne (2007) about greenhouses in Almeria and of Martinez et al. (2014) (based on the interview of 212 farmers, 18 agro-industrial companies in Almeria). Articles
Data quality check and feedback of experts through a collective workshop
We organized a collective workshop during the study case in order to get feedback on our indicators, discuss about first results: the workshop gathered 5 experts, from different fields. Individual interviews have also been used to complete the panel of experts.
The following part of the report presents the results obtained by each team regarding the common indicators.
3 Results
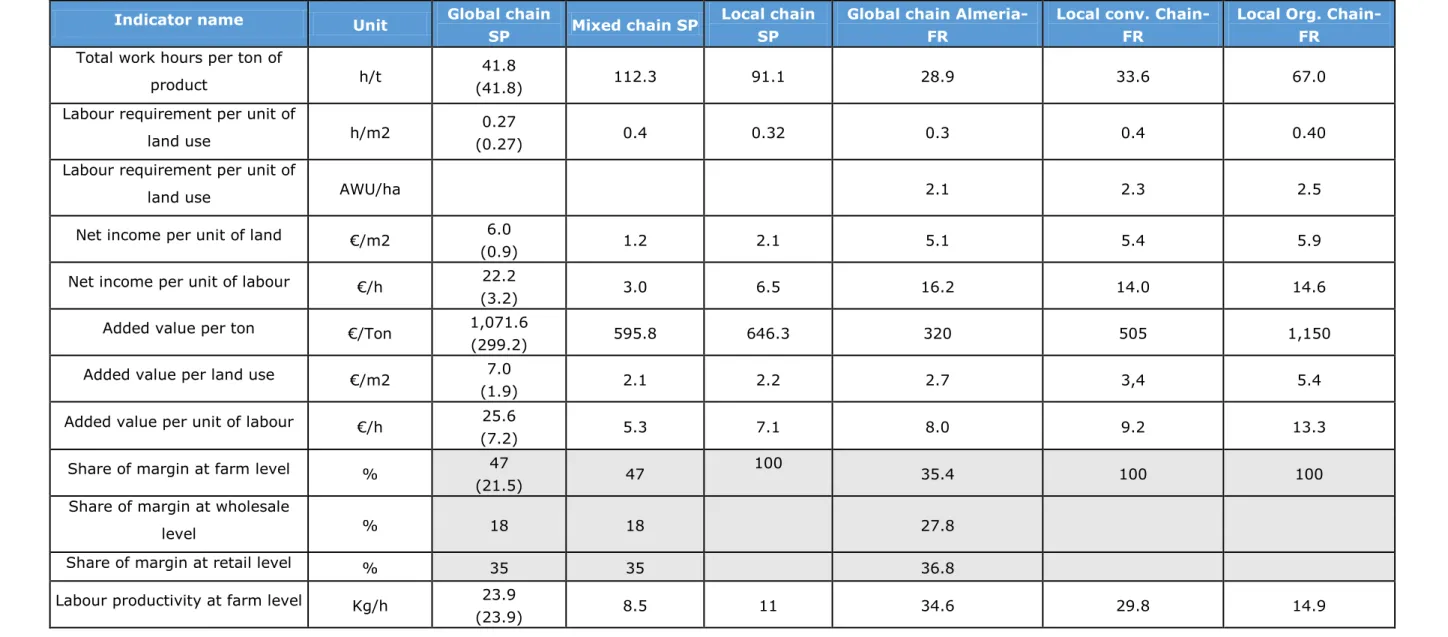
The following table presents the results of the evaluation of the local and global tomato supply chains in the Spanish and French cases.
Table 2 : Common indicator and results table for both French and Spanish tomato case study
Indicator name Unit Global chain
SP Mixed chain SP
Local chain SP
Global chain Almeria-FR
Local conv. Chain-FR
Local Org. Chain-FR
Total work hours per ton of
product h/t
41.8
(41.8) 112.3 91.1 28.9 33.6 67.0
Labour requirement per unit of
land use h/m2
0.27
(0.27) 0.4 0.32 0.3 0.4 0.40
Labour requirement per unit of
land use AWU/ha 2.1 2.3 2.5
Net income per unit of land €/m2 6.0
(0.9) 1.2 2.1 5.1 5.4 5.9
Net income per unit of labour €/h 22.2
(3.2) 3.0 6.5 16.2 14.0 14.6
Added value per ton €/Ton 1,071.6
(299.2) 595.8 646.3 320 505 1,150
Added value per land use €/m2 7.0
(1.9) 2.1 2.2 2.7 3,4 5.4
Added value per unit of labour €/h 25.6
(7.2) 5.3 7.1 8.0 9.2 13.3
Share of margin at farm level % 47
(21.5) 47
100
35.4 100 100
Share of margin at wholesale
level % 18 18 27.8
Share of margin at retail level % 35 35 36.8
Labour productivity at farm level Kg/h 23.9
Land productivity Tons/ha 65
(65) 34 35 100 110 60
Food availability Months 10 6 5 10 5 4
Retail Price €/Kg 3.4 3.4 2.5 2.5 2 3
Direct fuel use (SP) - Fossil energies use (FR) per unit of
product
MJ/kg 0.03
(0.03) 0.29 0.27 4.0 2.9 3.5
Fuel use intensity (SP) - Fossil energies use (FR) per unit
of land
MJ/ha 1,039
(1,039) 9,790 9,296 660,000 460,000 363,000
GHG emissions per unit of
product g CO2 eq./kg
2.2
(2.2) 19.8 19.4 213 170 200
GHG emissions per land unit tons CO2 eq./ha
0.14
(0.14) 0.71 0.67 35.0 27.0 21.7
Indirect CO2 emissions per land use (from electricity)
tons CO2
eq./ha 2.8 1.6 0.4
3.1 Local versus global
This section describes the main results obtained in the evaluation of Global and Local tomato supply chains in the Spanish and French case studies.
3.1.1 Spain
In the case of the Local and Mixed tomato supply chains, the whole production at farm level enters to the corresponding chain. In the global tomato supply chain, instead, part of the production enters to the studied supply chain and the rest is commercialized through other channels4. The farmer obtains lower prices for this part of the production sold to other intermediaries (0.5 €/Kg instead of 1.6 €/Kg), which reduces the economic performance of the whole farm. Therefore, in the case of the global chain two values of the indicators are presented: the first value considers only the fraction of production commercialized in the studied supply chain. The second value (in brackets) indicates the performance of the farm considering the whole production of tomatoes, which in average is sold at a lower price. As the reader can see, values are either the same, or lower for the value in brackets. In these last cases, the lower performance of the chain is due to the fact that more intermediaries are involved. (When commenting the performance of the chain, we will refer to the first value (i.e. tomatoes commercialized within the studied chain). In terms of land productivity5the Global chain is able to handle larger amounts of
tomatoes per square meter (almost double amount compared to both Local and Mixed chains) and by hour of human activity dedicated to produce and distribute tomatoes(almost three and two times more than in the Mixed and Local chains, respectively).
In the case on economic indicators, the monetary flows of the Global chain are larger than in the other two chains. Net income per unit of land is almost 5 times larger in the Global chain compared to the Mixed chain, and 2.5 times compared to the Local chain. Net income per unit of labour is 7 and 3 times larger than in the Mixed and Local cases, respectively. As well, the contribution to economic development in terms of creation of added value is also better in the Global case. Significantly when comparing economic labour productivity (which is 25.6 €/h, opposed to 2.1 and 2.2 for the Mixed and Local chains, respectively). The Global
4
The part of tomatoes that is not sold to the organic wholesaler in Barcelona is usually sold to other intermediaries or in a private auction.
5
It is worth noticing that land productivities of the whole chains consider the tomatoes sold by the chain with respect to the total land uses in the chain. Also, the amount of tomatoes sold by the chain is lower than the tomatoes produced due to the losses within the chain. Therefore, land productivities of the chain tend to decrease with respect to land productivities of the farm due to two main reasons: a) land use increases, and b) the amount of tomatoes decreases. The increase of land use is not very relevant since the land use of the wholesaler and the retailer are small in comparison with the agricultural land use. Losses have been considered after the production stage. This information has been provided by the wholesaler and the retailer.
chain creates more added value per unit of land use than the other two at the farm level. However, when considering the tomatoes sold at lower price to intermediaries by the global farmer, the added value and the net income indicators (in brackets) of the global chain significantly worsens its performance.
Regarding the distribution of added value, the Local supply chain performs better from the point of view of the farmer, who retains 100% of the created added value. The Global and Mixed farmer retains almost 50% of the added value.6The creation
of jobs per unit of land use is much higher in the Mixed and Local chains. This is
basically due to the contribution of activities performed in reduced spaces (i.e. wholesaling and retailing) compared to agricultural land used for production.7
In biophysical terms, the consumption of energy carriers per unit of product is lower in the Global case than in the other two (0.03 MJ/kg opposed to almost 3). This is because in the Global case productivity is much higher (and the Local and Mixed cases have similar values because they have similar productivities).
Environmental indicators show a better performance in the Global case, given the fact that GHGs emissions are mainly allocated in transport, which is more efficient in the Global chain.8 As for agro-biodiversity, the Local case performs significantly better than the Global and Mixed cases. This is due to the fact that Local farms are highly diversified (while the Global farm is a mono-culture regime, and the Mixed chain a semi-diversified one).
Finally, food availability scores better in the Global case, but this just due to the fact that the Global farm produces all year around, while the Mixed and Local farm only in season.
3.1.2 France
6
In the case of the Mixed chain, most of the added value is retained also by the farmer. Recall that this farmer is member of the wholesale cooperative, and that the former objective of the cooperative was to facilitate the commercialization of products to the farmers and make their business more profitable. In the case of the Global chain, the wholesaler increases the share of added value and the farmer decreases its share. However, it is the retailer who retains most of the added value created along the chain.
7
However, all the jobs created by the Local supply chain are located in rural areas, since production and distribution is performed by the same people who are living and working in rural areas (except by the distribution tasks). In contrast, the Mixed and Global chains create jobs in rural areas only in the production stage of the chain. Therefore, when talking about the contribution to keep rural population and dealing with ageing issues, the Local supply chains seems to perform better than the Mixed and Global chains.
8
However, environmental performance of the Global chain is not that good if we consider that it consumes more electricity (as tomatoes are produced in greenhouses) and generates a large amount of residues from the substrate where tomatoes are grown.
On the one hand, we observe that the income of tomato producers in local chains is 20% less than the average income in fruits and vegetables production in France. On the other hand, Spanish producers in global tomato chains receive a higher income than the average agricultural income in Spain.
The income per unit of land we measure for each production system shows a better performance for local organic production, but more largely for farmers on local chains. Available incomes for farmers are respectively for organic, conventional local chains and global conventional; 5.9€/m2, 5.4€/m2 and 5.1€/m2. Considering the standard variation of each data, local chains grants more income per unit of land than global chains. On the contrary, we observe that tomato production on global chain performs better in terms of income per unit of labour. Indeed, global chains require less work for production than local chains. Organic production demands an average of 67 hours of work per ton of product, conventional requires an average of 33.6 hours/Ton, while tomato production in Almeria calls for 28.9 hours/Ton. Low technical means and direct sale on farm in local chains mobilize more human resources at farm level. In Spain, farmers are only responsible on producing tomatoes; calibration and packaging are done at the collection centre, managed by the cooperative.
Incomes for farmers are strongly linked with the employment strategy which is implemented considering the high cost of salaries and social taxes. In the French cases, labour cost represents around 50% of the production cost value, that represents from 0.7 to 1.09€/kg on local organic and conventional production systems, while in Spain labour cost is lower than 34% of the production cost, valued at an average of 0.58€/kg. In France, family workers are a way to break down labour costs, whereas in Spanish case, employment of irregular workers ensure low production costs to cope with Morocco on global market.
Regarding the added value, the local chains perform better than the global one, especially the organic local chain, due to a higher retail price/kg which benefits directly and totally to producers.
In terms of creation of added value at farm level, results shows that French production systems perform better than Spanish intensive production if we consider added value per ton and per square metre. Results per production unit point out that organic model are creating more added value.
The comparison between creation of added value per hour and net income per hour indicates that local production systems in France creates more added value per hour than global Spanish ones, while global tomato system offers more income than local conventional and organic systems regarding labour productivity.
In matter of workload, local chains represent more work hours / kg or ha at farm level than global chains, due to less or no mechanization. The organic chain,
especially, consumes more working time, in relation with specific techniques and necessary time for crops observation. Nevertheless, as we will discuss in the next session, producers in local chains tend to work more than an Annual Work Unit and use family workers or students rather than recruiting as far as labour costs are too high. Even if the data is not available for the cross-comparison between the two teams, paid jobs are likely to be more numerous in global chains than in local ones, both per ha and at the regional level due to more numerous farmers.
Regarding the environmental dimension, our study has also been focused at the production level: local chains, especially organic ones, perform better than global ones. The good results of organic chains are mainly due to its agricultural model but results also show how chains influence the choice of production systems: in both local and global chains, producers are listening to their customers; in global chains, requirements are first of all oriented towards traceability and food security, while local consumers claim for environment-friendly techniques and taste. Nevertheless, an unexpected result concerns the strong constraint due to small surfaces in local chains, preventing farmers to make crop rotations and thus generating soil diseases.
Concerning attribute of biodiversity we made the hypothesis that a mixed farming system perform better than a specialized system, through it ability in maintaining cultivated biodiversity, therefore allowing more indirect effects on non-cultivated biodiversity, such as pollinating insects, soil microorganism, etc. The second hypothesis is that organic agriculture perform better than conventional one, in preserving biodiversity, mainly due to the absence of chemical products use. Consequently, results show that both local organic and conventional production system have high level of diversification at crops at farm level, compared to horticultural model in Almeria.
Local supply chains uses a wide range of crops‟ species due to farmers‟ practices and theirs response to consumers‟ demand. In local chains the range of annual cultivated crops at farm level vary from 15 to 50 species, with a maximum in organic chains, corresponding to 10 to 23.1 species/ha of land. Moreover, tomato varieties are selected regarding others criteria than in global ones. The Spanish horticultural model developed in Almeria is characterised by a farm specialization in few crops mainly from the Solanaceae family. Agricultural practices do not include crop rotation; hence it observed a strong pressure of diseases, a fast decline of soil fertility, due to the succession of the same type of crops. At territorial level, Almeria agricultural cluster impacts negatively on natural resources renewal, and provokes alteration of natural landscape due to greenhouse installation. The market strongly drive the offer in both chain dimension.
Regarding pollution dimension, French team assessed GHG emissions using results from two projects; (1) AGRI-Balyse and (2) EUPHOROS, respectively assessing LCA
for tomato crops in France and Spain. For further details, approaches and methods are presented in Chapter 2.2.3 Focus on LCA approach for environmental impacts
assessment. Two environmental impact indicators were used in GLAMUR French
case study.
At farm level, Greenhouses gases emissions remain higher in tomato systems in Almeria than in France for conventional and organic models. However Torrellas and
al. considered in their study a tomato system using perlite as substrate, we deduce
its contribution from final result to make it correspond to our case study. Despite that, GHG emissions in Spanish case remain higher than French ones, with 213 g CO2 eq per kilo of tomatoes, compared to 170 g CO2 eq per kilo for conventional French tomato case and 200 g CO2 eq per kilo for organic French tomato case. Regarding results, the organic model contribute more for GHG emissions than the conventional one. Different factors influence the final result. First, we analyse the influence of each stage of the systems inventor. Therefore we also have to take into account the hypothesis of tomato yields considered by authors in the two projects. Organic system is supposed producing 10.37 kg.m-2, compared to 15.91 kg. m-2 and 16.5 kg.m-2 respectively, for conventional French and Spanish systems. The lower productivity of organic system compared to conventional ones could explain why the value of GHG emissions per kilo of tomato is higher for organic tomatoes.
Emissions related to agricultural inputs, mainly fertilizers and greenhouse structure are important contributors to global warming for Spanish case. (Torrellas and al., 2012). The structure9 accounted for 41%. The large amount of steel in the frame had a high contribution in the global warming impact category. In French organic and conventional tomato systems, the structure contribution in global warming account for 28% and 22%. Greenhouses used for tomato production in French case differ from Spanish ones. Could shelters involves less steel, plastics and others construction material, thus reducing contribution to global warming. Fertilizers10 is the second major contributor to global warming for 39% in Spanish case, compared to 13% and 8% in conventional and organic French cases. Mineral fertilizer environmental impacts were due to emissions during manufacture and to their application to the crop in conventional agriculture. Organic fertilizers were also considered in French assessment and contribute for 50% of fertilizer contribution in organic case. In the Spanish situation, auxiliary equipment (without perlite substrate) is responsible for 18% in global warming impact category. It is due to irrigation systems, consumption of electricity by watering system, and water collecting installations.
9
The study considers the 18-span greenhouse, steel, plastics, concrete and transport processes.
10
Corresponding to total quantities of N, P and K applied to the crop. Generic values were used to assess contribution to impact categories.
For organic and conventional French tomato production systems, the stage “Transport and others inputs” is the major contributor in Global Warming for 51% and 52% respectively. It include transport of materials and fertilizers from the shop to the farm and others inputs. In the Spanish approach fertilizers and pesticides were not incorporated in the system since, it was considered that these products came from a local supplier and were not an issue considered for improvement in the study. Transport processes were evaluated in the assessment of the structure. (Torrellas and al., 2012).
Figure 1 : Stage contributions to Global Warming impact for tomato production systems corresponding to local and global chains (Kg CO2 eq per kilo of tomato)
Source : Author elaboration, data from Torrellas and al., 2012 and Agri-Balyse, 2015.
Cumulative energy demand was assessed through the amount of direct and indirect energy used in production process. It includes fossil energy use. As for GHG emissions final results is corresponding to Agri-Balyse and EUPHOROS projects. Local French chains perform better than Spanish one regarding the amount of energy use per unit of product and per unit of land. But local organic system is more sustainable than conventional one per unit of land than on productivity. Qualitatively, local chains are supposed to perform better because of less level of mechanization, local inputs and less quantity of fertilizers and pesticides use. In
French systems, transport of inputs and materials is the main stage contributor in energy demand and account around 57% in each case. In Spanish tomato system, transport was not assessed, thus it is difficult to compare both studies. The major contributor in Spanish tomato system is representing by climate system for 78% of the final impact. Pesticides and fertilizers also contribute in fossil fuel use in conventional systems, through indirect energy demand for the manufacture, transport and application.
Finally, while products from global chains are longer available in France, they are less affordable in counter-season. Product scarcity in winter season explains a higher price.
The ethical dimension is difficult to assess through the common list of indicators with the Spanish team, beyond the share of the retail price tending to present local chains as „fair trade‟ chains. We are going to develop further this dimension in the next session, as far as it is implied in trade-offs made by producers themselves.
3.2 Trade-offs
In this section, the most relevant dimensions and the relations between them are analyzed for each case-study pair.
3.2.1 Trade-offs in the Spanish case
The Global chain has a much higher land productivity than the Local and Mixed chains. However, because of this (i.e. hours allocated in agricultural activities), Local and Mixed chains perform better in terms of jobs created per unit of land use, because of the contribution of wholesaling and retailing activities. For the rest of economic indicators, the Global chain performs better that the other two. This is true for net income indicators, and for economic labour productivity. Despite the Global chain creates more added value, the Local chain performs significantly better in terms how this added value is distributed (i.e. the farmer keeping 100%).
As for environmental indicators, the Global chain makes a less intensive fuel use. Also, it performs better in terms of GHGs‟ emissions, but this is due to the fact that electricity consumption is not considered. In terms of agro-biodiversity, the Local chain performs much better, as Local farms are much diversified.
3.2.2 Trade-offs in the French case
In this section, we value the results which we also get on the social, health and ethical dimensions to highlight correlations, trade-off or dilemmas of tomato local and global chains.
Indicators comparison Availability vs. nutritional quality
Trade-off Consumers‟ satisfaction vs.
pedagogy
The global chain which we considered procures tomatoes to consumers all the Winter long, when tomatoes produced in France, even in warmed greenhouses (in Brittany, North-West of France), are scarce. Global chains thus perform better in matter of food availability. Nevertheless, global chains, when procuring tomatoes in winter, are not more affordable than local ones in summer. Moreover, the nutritional quality of tomatoes is likely to be higher in local chains: in the WP3 we assessed the impact of key factors in matter of tomato nutritional quality and global chains get a low score of nutritional performance, due to harvests before maturity, storage and transport in refrigerated trucks, which decrease the vitamin rate. Such a data would need to be deepened in order to be confronted with availability or affordability. Nevertheless, most consumers are satisfied to consume tomatoes all the year-long while local chains, favouring pedagogy, contribute to consumers‟ learning about seasonality and its issues.
Employment, both in quantity and quality, is one of the huge issues of tomato production. As we mentioned before, while local chains require more work than global ones (34 to 67 h/t vs. 29 h/t), producers in local chains tend to work personally more than the legal threshold and to use family workers or students, as labour costs in France limit their capacity to employ a salaried worker. Labour costs in Spain are lower and tomato global chains and favour employment, even if global chains are less time consuming at farm level: producers are not in charge of selling and farming systems are more mechanized. The high workload appears in local chains as a major factor of fail or giving-up of short chains; it is also a source of stress. These impacts counter-balance a higher added value in local chains. At the same time, assuming sales may be a source of social acknowledgement of farmer‟s Indicators comparison Added value vs. workload
Trade-off Workload vs. social acknowledgement and
inter-generational solidarity
wife. More largely, family work is, in France as in Spain, a source of inter-generational solidarity in agriculture. On the other hand, employment in global chains is likely to be higher but working conditions remain an important issue, all the more than some reports stress some irregular work concerning immigrant workers.
Agro-biodiversity is promoted by specific agricultural models (esp. organic) rather by chains in themselves. Nevertheless, we noticed above that chains impact technical practices. We highlighted the role of customers but our study also showed how local chains, by strengthening cooperation between farmers, favour environment-friendly practices by farmers less advanced than organic ones, and entering short food chain. Those networks balance the lack of technical advice in local chains, while famers in global chains are more supported. On the other hand, hybrid tomato breeding associated with commercial marketing make the image of global chains evolve as far as those chains now propose many varieties looking like ancient varieties but which are not. Pedagogy with consumers as well as transparency is thus at stake. Agro-biodiversity has also to be assessed at the regional level: Almeria agro-industrial cluster is associated with intensive culture of few species and made the natural landscape disappeared. By welcoming consumer‟s on-farm, farmers in local chains have to take care of their natural environment, as a marketing tool beyond the environmental issue.
Indicators comparison Agro-biodiversty
Trade-off Agro-biodiversity + customers‟ requirements +
cooperation between farmers
Consumers‟ satisfaction vs. pedagogy and transparency about varieties
„True‟ vs. commercial varietal diversity Landscape as a marketing tool
3.3 Cross-cutting issues
In this section the cross-cutting issues are addressed. Specifically, it presents the issues that are similar in the two countries.
3.3.1 Structure of the chains
Farmers participating in local chains in both countries practice multi-cropping. They allocate part of the land to tomato production within a strategy crop diversification. On theother side, global farmers tend to be industrial monoculture farming, with high energy inputs and tomato cultivation in greenhouses. Due to production techniques, global farmers are able to supply tomatoes most part of the year, while local farmers supply tomatoes in summer season.
3.3.2 Contribution to economic development
In general terms, farms involved in local chains are more labour intensive. That is, they require more labour to produce one ton of tomatoes and more labour per hectare. In other words, the local chain tends to create more jobs at the farm level. The main reason is the lower mechanization of local farms, which entails also lower yields in spanish systems than in french ones and lower yields in organic systems than in conventionals. Thus, net income per unit of land is also higher in the local chains. But there are not clear differences between global and local farms across countries when considering the net income per unit of labour.
3.3.3 Creation and distribution of added value
Local farms tend to create higher added value per tonne of production, per unit of land use and per unit of labour. This is basically due to the higher prices obtained by the local farmers compared to global ones. Intermediaries play an important role in this regard, since local farmers keep 100% of the price while global farmers tend to keep less than 50%. This entails that global farmers obtain lower sale prices than local farmers.
3.3.4 Environmental performance
As expected, agro-biodiversity in the local farms is higher than in the global ones. This is, in fact, part of the strategy of local farmers, who diversify production to offer customers a variety of products directly in the on-farm selling or in the vegetable baskets.
When considering direct and indirect CO2 emissions local chains also perform better. In the Spanish case, local chains tend to have higher use of fossil fuels, which entails higher CO2 emissions per unitof land on farm (i.e. direct emissions). However, the global chain consumesa larger amount of electricity in greenhouses, which entails larger indirect CO2 emisisons. In the French case, GHG emissions
consider also the emissions due to the fabrication of the greenhouses and equipment by means of a life cycle analysis. This entails also larger emissions in the global chain.
In general terms, the local farms perform better than the global ones in the selected attributes. However, the evaluation of the complete chain in the French case is missing for the global chain and we haven‟t been able to perform a cross-country comparison at the chain level. An evaluation at the level of the chain can produce different results and lead to different conlcusions. For instance, in the Spanish case, the global chain creates more jobs per unit of land use or per unit of product than the local one. This is due to the jobs created in the retail sector. As well, the local chain tends to generate larger CO2 emissions per unit of product than the global chain due to the low efficiency of the transport in the distribution stage.
3.3.5 Research gaps and questions
The study of tomato supply chains lead to the research teams to the following considerations:
Information about important issues (e.g. working conditions, waste in supermarkets) have been difficult to collect; more time and networking would be needed to obtain reliable information
These studies have has shed some light on how the economic performance is linked with practices in the other dimensions. For instance, in France, a national survey on short chains showed that the farmer income is positively correlated with the implication of the farmer in collective structures (e.g. equipment sharing or collective sales with other farmers). In-depth investigation would be needed to analyse more systematically how social, environmental or ethical practices increase the economic performance. Also, it has to be considered that the involvement in collective structures or networks requires more time from the farmers. In the Spanish case, a mixed chain has been considered and, in this chain, the farmer is partner of a distribution cooperative, which takes care of the commercialization of the product and releases the farmer of these tasks. In this case, the farmer is able to retain higher share of revenues along the chain because the cooperative buys all his production at good prices. It does not happen the same to the global farmer, who is able to sell at good prices only a fraction of his production and the rest is sold to intermediaries at very low prices.
Further discussions between researchers from different disciplines would be needed about “new indicators of wealth”, which we included in the French team case study;
we showed how specific social or ethical modalities of practices may be scored as indicators of performance (ex. cooperation between farmers, education of consumers…), and not as actors‟ perceptions;
The analysis we carried out remains a static analysis of performances, a-contextualised, even if experts from different spheres have been mobilized during the process. Indeed, compared with the indicators highlighted in the WP2, our analysis appears rather poor, focused on „classical‟ economic indicators. Constraints on time and focus, and collaborative work between teams from different disciplines, justify this focus. A further step would be not only to enlarge the list of indicators but also to develop the analysis in a dynamic perspective and, possibly, within a prospective exercise: which chain would be more performant in the case of a huge sanitary crisis, for instance, It would go beyond including „resilience‟ as an indicator of performance by anticipating different situations in which conditions or expectations in matter of performance may change.
4 Conclusion
An important previous remark before providing the conclusions is that they refer to an on-farm level cross-country comparison, as results at this wider level are not available for the French case. Moreover, the cross-comparison is focused on the economic dimension and, in a less extent, on the environmental one as far as the Spanish case did not develop the other dimensions. In this context, the local farms perform better than the global ones in the selected attributes.
As for economic indicators, net income per unit of land is higher in local chains. However, if we consider net income per unit of labour, no differences arise between global and local farms.Local farms create higher added value per tonne of production, per unit of land use and per unit of labour in both countries.The main reason is that local farmers obtain higher prices for their product (they keep 100% of the price) compared to global farmers (who keep less than 50%, due to intermediaries).
As for social indicators, the local chains tend to create more jobs at the farm level, because of the lower level of mechanization (i.e they are more labour intesive than the global farms).
Finally, in environmental terms local farms perform better in terms of agro-biodiversity, as farmers participating in local chains in both countries practice multi-cropping. Production diversification is indeed a marketing strategy of local farmers. As regards direct and indirect CO2 emissions local chains also perform better than the global, in both countries. Despite local chains in Spain have higher direct emissions rate (i.e. higher use of fossil fuels), indirect emissions are higher in the global case (i.e. greenhouses consume a larger amount of electricity). In France, the global chain entails higher emissions than the local chain, due to the consideration of greenhouses and equipment fabrication realted emissions.
As previously stated, it is important to consider that if we were to perform a cross-country comparison of the complete chain and regarding all dimensions, performance results and conclusions would be different.
ANNEXES
Annex 1 : Scope of the local conventional and organic tomato chains in France ... 31
Annex 2 : Scope of the global conventional tomato chain ... 31
Annex 3 : Main characteristics of the tomato chains considered in the comparison France-Spain
... 32
Annex 4 : Local and global chain boundaries for LCA Approach in French Case study ... 34
Annex 1 : Scope of the local conventional and organic tomato chains in France
Annex 2 : Scope of the global conventional tomato chain Flows of information and communication
Flows of product Financial flows
Annex 3 : Main characteristics of the tomato chains considered in the comparison France-Spain
Type of chain Local organic chain
Local conventional
chain
Local organic chain Mixed organic chain Global organic chain Global conventional chain
Criteria / country France France Spain Spain Spain France
Distance between production and Ripening; (average km)
same district or within a radius of 150 km in Languedoc-Roussillon Tomatoes are produced and distributed in the Barcelona province (30 km from production to consumption)
Tomatoes are produced in Catalonia and distributed by a wholesale cooperative to organic shops specialized in fruits and vegetables (150 km from production to consumption)
Tomatoes are produced in Andalucía and distributed by a wholesale cooperative in Barcelona to organic shops specialized in fruits and vegetables (1,000 km from production to consumption)
Production in Almeria, Spain and consumers in Languedoc-Roussillon, France. Distance about 1,200 km.
Average Number of steps in the supply chain (from production to place of sale)
Between 0 and 1 step
Direct selling in local open-air markets or on-farm (=the 2 most important / market shares of short chains)
One step, from producers to household units and/or consumer groups
Three steps: Producers to wholesale, wholesale to vegetable shops to final consumers.
Three steps: Producers to wholesale, wholesale to vegetable shops to final consumers.
Minimum 2 steps between farm and consumption. Tomato sold in supermarkets in South of France
Governance (degree of control of “local actors”)
Small and medium producers. Multi-crop system, with average surface of tomatoes from 100 to 2,500 m2 Atomized production. Diversified outlets. Small farmers performing multi-crop systems in about 1 hectares
Medium size producer (2-3 hectares), rotation of 7 crops and green fertilizer. The farmer is member of the wholesale cooperative, through which sales are assured.
Medium-Large producer: 3 hectares of monoculture under greenhouses
Small producers (average vegetables surface 2.4 ha). Agro-industrial district in Almeria. Negotiation between cooperatives-producer organizations and supermarkets buying centres.
and technologies employed
resources.
Low intensive in technologies. Traditional and technical knowledge
Limited in resource use.
agriculture.
Production based on agro ecological principles
agriculture. Production based on ecological principles (official labelling)
Soilless production under greenhouses.
Research, Innovation and Development. Diffusion of
Knowledge and
technologies trough agro-industry support. Intensive in natural resource use. Product identity Mediterranean product, key in
the Mediterranean diet
Traditional and hybrid varieties
Traditional and hybrid varieties Mostly hybrid/commercial varieties
Mediterranean product, key in the Mediterranean diet
Degree of
mechanisation of production
Low Low Low High High
Type and range of varieties
Hybrid and ancient varieties. Focus on cluster tomato
Unit of product 1 kg of marketed tomatoes 1 kg of marketed tomatoes
Period of availability for consumers
Summer short cycle June - September
June-October June-October June-May Winter long cycle
Annex 4 : Local and global chain boundaries for LCA Approach in French Case study SYSTEM BOUNDARIES FORTHE FRENCH LOCAL CHAINS
Transport of material and product
SYSTEM BOUNDARIES FOR GLOBAL CONVENTIONAL TOMATO CHAIN STUDIED IN THE FRENCH CASE STUDY
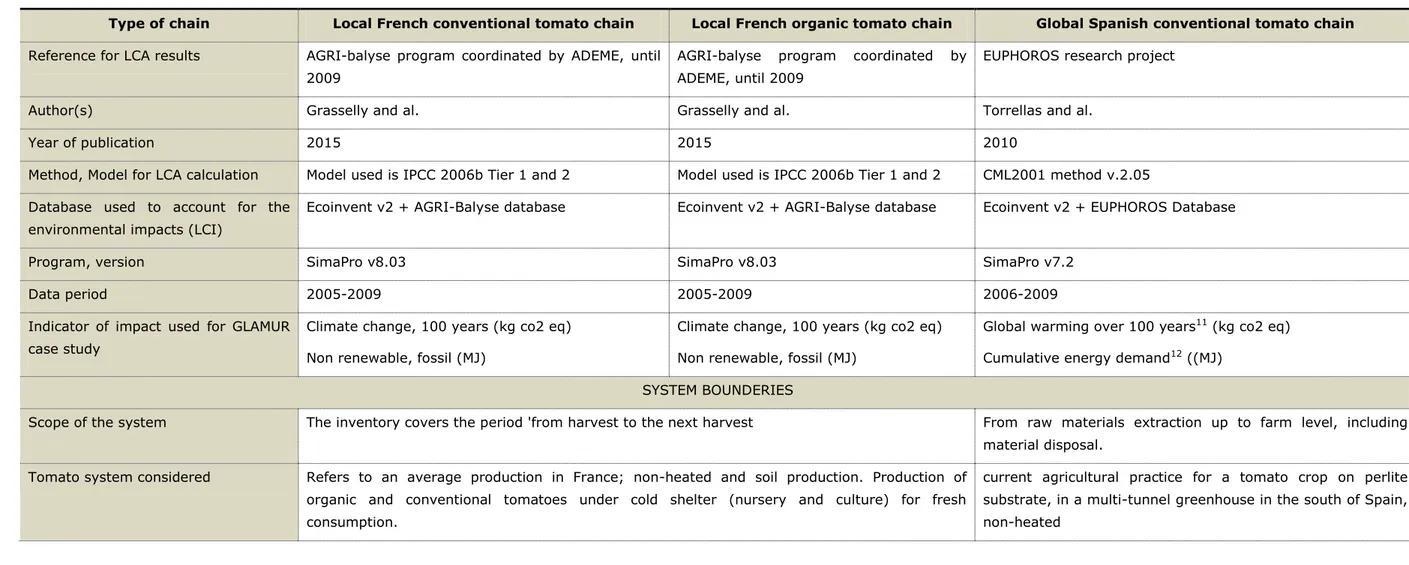
Table 3 : Description of hypothesis used in the LCA approach of Environmental impact of tomato crop systems
Type of chain Local French conventional tomato chain Local French organic tomato chain Global Spanish conventional tomato chain
Reference for LCA results AGRI-balyse program coordinated by ADEME, until 2009
AGRI-balyse program coordinated by ADEME, until 2009
EUPHOROS research project
Author(s) Grasselly and al. Grasselly and al. Torrellas and al.
Year of publication 2015 2015 2010
Method, Model for LCA calculation Model used is IPCC 2006b Tier 1 and 2 Model used is IPCC 2006b Tier 1 and 2 CML2001 method v.2.05 Database used to account for the
environmental impacts (LCI)
Ecoinvent v2 + AGRI-Balyse database Ecoinvent v2 + AGRI-Balyse database Ecoinvent v2 + EUPHOROS Database
Program, version SimaPro v8.03 SimaPro v8.03 SimaPro v7.2
Data period 2005-2009 2005-2009 2006-2009
Indicator of impact used for GLAMUR case study
Climate change, 100 years (kg co2 eq) Non renewable, fossil (MJ)
Climate change, 100 years (kg co2 eq) Non renewable, fossil (MJ)
Global warming over 100 years11 (kg co2 eq)
Cumulative energy demand12 ((MJ)
SYSTEM BOUNDERIES
Scope of the system The inventory covers the period 'from harvest to the next harvest From raw materials extraction up to farm level, including material disposal.
Tomato system considered Refers to an average production in France; non-heated and soil production. Production of organic and conventional tomatoes under cold shelter (nursery and culture) for fresh consumption.
current agricultural practice for a tomato crop on perlite substrate, in a multi-tunnel greenhouse in the south of Spain, non-heated
11
Emissions related to agricultural inputs, mainly fertilizers and greenhouse structure, are important contributors to global warming, which is related to greenhouse gas emissions to air.
12