HAL Id: hal-02480455
https://hal.archives-ouvertes.fr/hal-02480455
Submitted on 26 May 2020
HAL is a multi-disciplinary open access
archive for the deposit and dissemination of
sci-entific research documents, whether they are
pub-lished or not. The documents may come from
teaching and research institutions in France or
abroad, or from public or private research centers.
L’archive ouverte pluridisciplinaire HAL, est
destinée au dépôt et à la diffusion de documents
scientifiques de niveau recherche, publiés ou non,
émanant des établissements d’enseignement et de
recherche français ou étrangers, des laboratoires
publics ou privés.
Distributed under a Creative Commons Attribution - NonCommercial - NoDerivatives| 4.0
International License
Biodiversity effects on ecosystem functioning in a
15-year grassland experiment: Patterns, mechanisms,
and open questions
Wolfgang Weisser, Christiane Roscher, Sebastian Meyer, Anne Ebeling,
Guangjuan Luo, Eric Allan, Holger Beßler, Romain Barnard, Nina Buchmann,
Francois Buscot, et al.
To cite this version:
Wolfgang Weisser, Christiane Roscher, Sebastian Meyer, Anne Ebeling, Guangjuan Luo, et al..
Biodi-versity effects on ecosystem functioning in a 15-year grassland experiment: Patterns, mechanisms, and
open questions. Basic and Applied Ecology, Elsevier, 2017, 23, pp.1-73. �10.1016/j.baae.2017.06.002�.
�hal-02480455�
Christine
Fischer
j,k,
Markus
Fischer
e,
Arthur
Gessler
l,
Gerd
Gleixner
m,
Stefan
Halle
d,
Anke
Hildebrandt
j,m,
Helmut
Hillebrand
n,
Hans
de
Kroon
o,
Markus
Lange
m,
Sophia
Leimer
p,
Xavier
Le
Roux
q,
Alexandru
Milcu
r,s,
Liesje
Mommer
t,
Pascal
A.
Niklaus
h,B,
Yvonne
Oelmann
u,
Raphael
Proulx
v,
Jacques
Roy
r,
Christoph
Scherber
w,
Michael
Scherer-Lorenzen
x,
Stefan
Scheu
y,
Teja
Tscharntke
z,
Michael
Wachendorf
A,
Cameron
Wagg
B,
Alexandra
Weigelt
c,C,
Wolfgang
Wilcke
p,
Christian
Wirth
c,C,
Ernst-Detlef
Schulze
m,
Bernhard
Schmid
B,
Nico
Eisenhauer
c,DaTerrestrialEcologyResearchGroup,DepartmentofEcologyandEcosystemManagement,SchoolofLifeSciences Weihenstephan,TechnicalUniversityofMunich,Hans-Carl-von-Carlowitz-Platz2,D-85354Freising,Germany bUFZ,HelmholtzCentreforEnvironmentalResearch,PhysiologicalDiversity,Permoserstrasse15,04318Leipzig, Germany
cGermanCentreforIntegrativeBiodiversityResearch(iDiv)Halle-Jena-Leipzig,DeutscherPlatz5e,04103Leipzig, Germany
dInstituteofEcology,FriedrichSchillerUniversityJena,DornburgerStr.159,07743Jena,Germany eInstituteofPlantSciences,UniversityofBern,Altenbergrain21,3013Bern,Switzerland
fAlbrechtDanielThaer-InstituteofAgriculturalandHorticulturalSciences,PlantNutritonandFertilisation, Albrecht-Thaer-Weg4,HumboldtUniversitätzuBerlin,14195Berlin,Germany
gAgroécologie,INRA,AgroSupDijon,Univ.BourgogneFranche-Comté,F-21000Dijon,France hInstituteofAgriculturalSciences,ETHZurich,LFWC56,Universitätsstr.2,8092Zurich,Switzerland iUFZ,HelmholtzCentreforEnvironmentalResearch,DepartmentofSoilEcology,Permoserstrasse15,04318 Leipzig,Germany
jInstituteofGeoscience,FriedrichSchillerUniversityJena,Burgweg11,07749Jena,Germany
kUFZ,HelmholtzCentreforEnvironmentalResearch,DepartmentofConservationBiology,Permoserstrasse15, 04318Leipzig,Germany
lSwissFederalInstituteforForest,SnowandLandscapeResearchWSL,Zürcherstrasse111,CH-8903Birmensdorf, Switzerland
mMaxPlanckInstituteforBiogeochemistry,POB100164,07701Jena,Germany
nPlanktonEcology,InstituteforChemistryandBiologyoftheMarineEnvironment(ICBM),CarlvonOssietzky UniversityOldenburg,26382Wilhelmshaven,Germany
oInstituteforWaterandWetlandResearch,RadboudUniversityNijmegen,Heyendaalseweg135,P.O.Box9010, 6500GLNijmegen,TheNetherlands
∗Correspondingauthor.Fax:+498161714427.
E-mailaddress:[email protected](W.W.Weisser).
http://dx.doi.org/10.1016/j.baae.2017.06.002
1439-1791/©2017TheAuthors.PublishedbyElsevierGmbHonbehalfofGesellschaftf¨ur ¨Okologie.ThisisanopenaccessarticleundertheCCBY-NC-ND license(http://creativecommons.org/licenses/by-nc-nd/4.0/).
pInstituteofGeographyandGeoecology,KarlsruheInstituteofTechnology(KIT),Reinhard-Baumeister-Platz1, 76131Karlsruhe,Germany
qMicrobialEcologyCentre,INRA,CNRS,UniversitédeLyon,UniversitéLyon1,UMRCNRS5557,UMRINRA 1418,bât.G.Mendel,43boulevarddu11novembre1918,69622Villeurbanne,France
rCNRS,Ecotron(UPS-3248),CampusBaillarguet,F-34980,Montferrier-sur-Lez,France
sCentred’EcologieFonctionnelleetEvolutive,CEFE-CNRS,UMR5175,UniversitédeMontpellier–Université PaulValéry–EPHE,1919routedeMende,F-34293,MontpellierCedex5,France
tPlantEcologyandNatureConservationGroup,WageningenUniversity,P.O.Box47,6700AA,Wageningen,The Netherlands
uGeoecology,UniversityofTübingen,Rümelinstraße19-23,72070Tübingen,Germany
vCanadaResearchChairinEcologicalIntegrity,Centrederecherchesurlesinteractionsbassins versants-écosystèmesaquatiques,UniversitéduQuébecàTrois-Rivières,3351Boul.desForges,CP500, Trois-Rivières,QC,G9A5H7,Canada
wInstituteofLandscapeEcology,AnimalEcologyandMultitrophicInteractions,UniversityofMünster, Heisenbergstr.2,48149Münster,Germany
xGeobotany,FacultyofBiology,UniversityofFreiburg,Schänzlestr.1,D-79104Freiburg,Germany
yJ.F.BlumenbachInstituteofZoologyandAnthropology,GeorgAugustUniversityGöttingen,BerlinerStrasse28, 37073Göttingen,Germany
zDepartmentofCropScience,Agroecology,UniversityofGöttingen,Grisebachstrasse6,37077Göttingen,Germany ADepartmentofGrasslandScienceandRenewablePlantResources,UniversityofKassel,Steinstrasse19,37213 Witzenhausen,Germany
BDepartmentofEvolutionaryBiologyandEnvironmentalStudies,UniversityofZurich,Winterthurerstr.190, CH-8057Zurich,Switzerland
CInstituteofBiology,LeipzigUniversity,Johannisallee21,04103Leipzig,Germany DInstituteofBiology,LeipzigUniversity,DeutscherPlatz5e,04103Leipzig,Germany
Received17July2016;receivedinrevisedform18June2017;accepted18June2017 Availableonline26June2017
Abstract
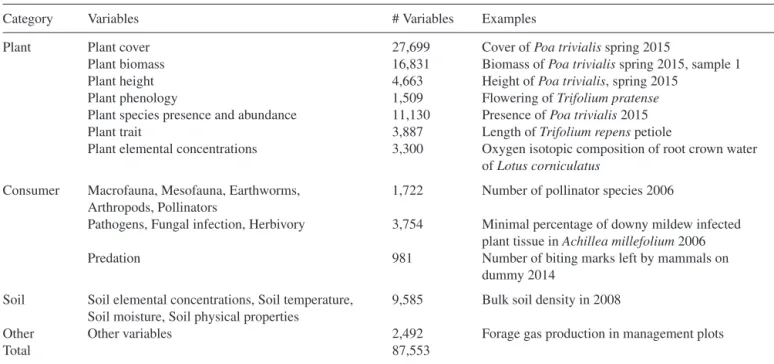
Inthepasttwodecades,alargenumberof studieshaveinvestigatedtherelationshipbetweenbiodiversityandecosystem functioning,most of whichfocussedon alimited setof ecosystem variables. TheJenaExperiment wassetup in2002to investigatetheeffectsofplantdiversityonelementcyclingandtrophicinteractions,usingamulti-disciplinaryapproach.Here, wereviewtheresultsof15yearsofresearchintheJenaExperiment,focussingontheeffectsofmanipulatingplantspecies richnessandplantfunctionalrichness.Withmorethan85,000measurestakenfromtheplantdiversityplots,theJenaExperiment hasallowedansweringfundamentalquestionsimportantforfunctionalbiodiversityresearch.
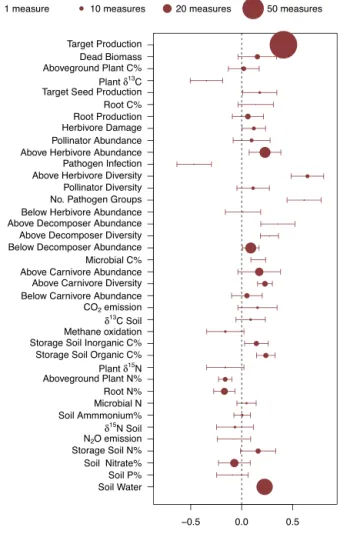
First,thequestionwashowgeneraltheeffectofplantspeciesrichnessis,regardingthemanydifferentprocessesthattakeplace inanecosystem.About45%ofdifferenttypesofecosystemprocessesmeasuredinthe‘mainexperiment’,whereplantspecies richnessrangedfrom1to60species,weresignificantlyaffectedbyplantspeciesrichness,providingstrongsupportfortheview thatbiodiversityisasignificantdriverofecosystemfunctioning.Manymeasureswerenotsaturatingatthe60-specieslevel, butincreasedlinearlywiththelogarithmofspeciesrichness.Therewas,however,greatvariabilityinthestrengthofresponse amongdifferentprocesses.Onestrikingpattern wasthat manyprocesses,inparticularbelowgroundprocesses,tookseveral yearstorespondtothemanipulationofplantspeciesrichness,showing thatbiodiversityexperimentshavetobelong-term, todistinguishtrendsfromtransitorypatterns.Inaddition,theresultsfromtheJenaExperimentprovidefurtherevidencethat diversitybegetsstability,forexamplestabilityagainstinvasionofplantspecies,butunexpectedlysomeresultsalsosuggested theopposite,e.g.whenplantcommunitiesexperiencesevereperturbationsorelevatedresourceavailability.Thishighlightsthe needtorevisitdiversity–stabilitytheory.
Second,we exploredwhetherindividualplantspeciesorindividualplantfunctionalgroups, orbiodiversityitselfismore importantforecosystemfunctioning,inparticularbiomassproduction.Wefoundstrongeffectsofindividualspeciesandplant functionalgroupsonbiomassproduction,yettheseeffectsmostlyoccurredinadditionto,butnotinsteadof,effectsofplant speciesrichness.
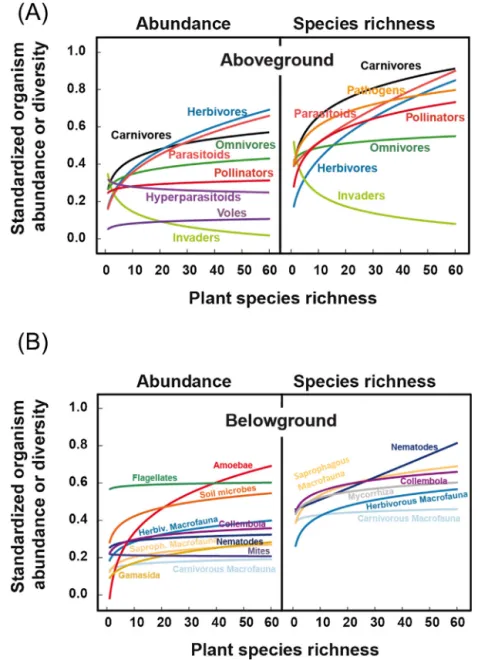
Third,theJenaExperimentassessedtheeffectofdiversityonmultitrophicinteractions.The diversityof mostorganisms respondedpositivelytoincreasesinplantspeciesrichness,andtheeffectwasstrongerforabove-thanforbelowgroundorganisms, andstrongerforherbivoresthanforcarnivoresordetritivores.Thus,diversitybegetsdiversity.Inaddition,theeffectonorganismic diversitywasstrongerthantheeffectonspeciesabundances.
Fourth, theJenaExperimentaimedtoassesstheeffectof diversityonN,P andCcyclingandthe waterbalanceof the plots,separatingbetweenelementinputintotheecosystem,elementturnover,elementstocks,andoutputfromtheecosystem.
wereexcludedfromplotsinsplit-plotexperiments,supportedtheimportantroleofthebioticcomponentforelementandwater fluxes.
Seventh,theJenaExperimentaimedtoputtheresultsintothecontextofagriculturalpracticesinmanagedgrasslands.The effectofincreasingplantspeciesrichnessfrom1to16speciesonplantbiomasswas,inabsoluteterms,asstrongastheeffectof amoreintensivegrasslandmanagement,usingfertiliserandincreasingmowingfrequency.Potentialbioenergyproductionfrom high-diversityplotswassimilartothatofconventionallyusedenergycrops.Theseresultssuggestthatdiverse‘HighNature ValueGrasslands’aremultifunctionalandcandeliverarangeofecosystemservicesincludingproduction-relatedservices.
Afinaltaskwastoassesstheimportanceofpotentialartefactsinbiodiversity–ecosystemfunctioningrelationships,caused bytheweedingoftheplantcommunitytomaintainplantspeciescomposition.Whiletheeffort(inhours)neededtoweeda plotwasoftennegativelyrelatedtoplantspeciesrichness,speciesrichnessstillaffectedthemajorityofecosystemvariables. Weedingalsodidnotnegativelyaffectmonocultureperformance;rather,monoculturesdeterioratedovertimeforanumberof biologicalreasons,asshowninplant-soilfeedbackexperiments.
Tosummarize,theJenaExperimenthasallowedfor acomprehensiveanalysisofthefunctionalroleof biodiversityinan ecosystem.Amainchallengeforfuturebiodiversityresearchistoincreaseourmechanisticunderstandingofwhythemagnitude ofbiodiversityeffectsdiffersamongprocessesandcontexts.Itislikelythattherewillbenosimpleanswer.Forexample,among themultitudeofmechanismssuggestedtounderliethepositiveplantspeciesrichnesseffectonbiomass,somehavereceived limitedsupportintheJenaExperiment,suchasverticalrootnichepartitioning.However,otherscouldnotberejectedintargeted analyses.Thus,fromthecurrentresultsintheJenaExperiment,itseemslikelythatthepositivebiodiversityeffectresultsfrom severalmechanismsactingsimultaneouslyinmorediversecommunities,suchasreducedpathogenattack,thepresenceofmore plantgrowthpromotingorganisms,lessseedlimitation,andincreasedtraitdifferencesleadingtocomplementarityinresource uptake.Distinguishingbetweendifferentmechanismsrequirescarefultestingofcompetinghypotheses.Biodiversityresearch hasmaturedsuchthatpredictiveapproachestestingparticularmechanismsarenowpossible.
©2017TheAuthors.PublishedbyElsevierGmbHonbehalfofGesellschaftf¨ur ¨Okologie.Thisisanopenaccessarticleunder theCCBY-NC-NDlicense(http://creativecommons.org/licenses/by-nc-nd/4.0/).
Keywords: Complementarity;Selectioneffect;Biomass;Nutrientcycling;Carbonstorage;Multi-trophicinteractions
Introduction
Inthepast20years,therehasbeenanincreasinginterest inthequestionofhowimportantadiversebioticcommunity is for the functioning of an ecosystem (e.g. Schulze & Mooney1993;Loreau, Naeemetal.2001;Kinzig, Pacala, &Tilman2002;Hooperetal.2005;Cardinaleetal.2012;
Naeem, Duffy, & Zavaleta 2012). This question, and the research underpinning it, represent a paradigm shift in ecology (Naeem 2002; Hillebrand & Matthiessen 2009). Traditionally,biodiversityresearchhassoughttounderstand theregulationandmaintenanceofdiversity,i.e.thedrivers of biodiversity, andbiodiversity was considered to be the
consequence of the abiotic and biotic factors regulating a community (Chesson 2000). This emphasis has shifted towards understanding the consequences of biodiversity changesforecosystemfunctionsandservices(Hooperetal. 2005;Naeem,Bunker,&Hector2009;Cardinaleetal.2012), thusconsideringbiodiversityitselfasadriverandnotonly as adependentvariable inecosystems,as first pointedout explicitlyintheseminalbookeditedbySchulzeandMooney (1993).Thisparadigmshiftisimportantasmanyprocessesin anecosystemarevitalformankind:ifbiodiversityisneeded fortheprovisioningofservicesbynature,thenthisprovides a further reason for conserving biodiversity (MEA 2005; Mace 2015).Furthermore, understandinghow biodiversity influencesecosystemfunctioningandthedeliveryofservices
could pave the way to a sustainable management of biodiversity, for reinforcing ecosystem performance and resilience, and for developing locally attuned systems. Ecosystem services in this context are, e.g. production, maintenanceofsoilfertility,waterpurification,pollination andmanyothers(MEA2005;Balvaneraetal.2006).
An increasing number of studies have been performed in the past two decades to analyse the relationship betweenbiodiversityandecosystemfunctioning(Balvanera et al. 2006; Schmid et al. 2009; Cardinale et al. 2012; Hooper et al. 2012). One approach that has been increasingly used is to manipulate biodiversity directly as an independent variable. Suchbiodiversity experiments
allowforadecouplingofmanipulatedaspects(mostlyplant diversity)andenvironmentalfactors(e.g.sitefertility),often correlatedinnaturalecosystems,andthereforeallowatest ofcausalrelationshipsbetweenbiodiversityandecosystem variables(Schmid&Hector2004).Earlyandveryinfluential biodiversity experiments were setup in the US by David TilmaninCedarCreek(Tilmanetal.2001),byaconsortium ofscientistsinEuropein1996(BIODEPTH:Hectoretal. 1999),andintheUKEcotron,whichmanipulatednotjust plant species richness but an entire food web (Naeem, Thompson,Lawler, Lawton,&Woodfin 1994).Theseand subsequent biodiversity experiments(e.g.CLUE, the Jena Experiment,vanderPuttenetal.,2000;Roscheretal.2004) weresuccessfulinrevealingthatmanyecosystemvariables have a lowered mean, and an increased variance, in low diversity communities, while high diversity communities oftenprovidedhigherandmorestablelevels ofecosystem functioning(Loreau,Naeemetal.2001;Loreau,Naeem,& Inchausti 2002; Hooper et al. 2005; Roscher et al.2005; Allan,Weisser etal.2013).Thisis supportednot onlyby individual experiments but also by meta-analyses of the results(Balvaneraetal.2006;Cardinaleetal.2006;Worm etal.2006;Cardinaleetal.2007;Isbelletal.2011;Hooper etal.2012;Allan,Weisseretal.2013;Isbell,Cravenetal. 2015).Today,itisthegeneralconsensusthatbiodiversityhas manifoldeffectsonprocessesattheecosystemlevel,andthat thisconclusionholdsnotonlyforbiodiversityexperiments, butalsoforreal-worldecosystems(butseeEisenhaueretal. 2016;Wardle2016).Thehistoryofbiodiversityexperiments, and a summary of the main debates have recently been reviewedbyTilman,Isbell,andCowles(2014).
The Jena Experiment, a large grassland biodiversity experimentincentralGermanythatwassetupin2002,has contributed substantially to debates on the importance of biodiversityforecosystemfunctioning.LiketheCedarCreek experiments, it is along-running biodiversity experiment. The Jena Experiment was set up witha broad ecosystem perspective, toinvestigate plantdiversity effects onwater, carbon (C), nitrogen (N), and phosphorus (P) cycling, as previous biodiversity experiments hadmostly investigated only snapshots of element cycling. The Jena Experiment hasalsoallowedcomparingtheresponsesofabroadrange oftaxa,from bacteriatomammals,tothemanipulationof
plantdiversity. Thisallowedthe explorationofhow multi-trophic species interactionschanged along the gradient of plantdiversityandhowthesechangesinspeciesinteractions underlietheobservedchangesinecosystemfunctioning.
In this paper, we summarize and integrate the results obtainedfromstudiesconductedwithintheJenaExperiment. Previous synthesis articles have largely focussed on summarizing the evidence for an effectof biodiversityon ecosystem functioning,rather thanon describing in detail the response of an ecosystem to a manipulation of plant diversity(Hooperetal.2005;Balvaneraetal.2006;Cardinale et al. 2012; Naeem et al. 2012; Tilman et al. 2014). We believeitis importanttodetail thevariabilityinresponses among different ecosystem variables, to be able to ask more detailed questions about the mechanismsunderlying biodiversity–ecosystem functioning relationship. Such an approachispossibleintheJenaExperiment,becauseawide range of ecosystem variables was measured in the same plots, so that their responses to the manipulation of plant diversity can be directly compared. In contrast, previous syntheses have brought together results from a variety of experimentsthatdifferedinexperimentaldetail.Thismakes it difficult to directly compare the responses of different ecosystem variables, e.g. differentgroups of organisms or differentelementcycles,toamanipulationofbiodiversity.In addition,thereisalargeoverlapinvariablesinvestigatedin differentexperiments(e.g.plantbiomass),sothatthenumber ofdifferentecosystem-levelvariablesthatcouldbecompared betweenexperimentswaslimited.
Inourreview,wefocusonthefollowingtopics:
(1) thegeneralityof thebiodiversityeffectonecosystem variables and variability between different types of variables;
(2) the occurrence of delayed biodiversity effects and transientdynamics,thatunderscoretheimportanceof thelong-termnatureoftheJenaExperiment;
(3) responses of the plant community itself to the manipulationofplantspeciesrichness;
(4) changes in the community composition of other organisms, from bacteria to mammals, along the gradientofplantspeciesrichness;
(5) adetailedsummaryofhowthedifferentcomponentsof theN,P,Candwatercyclesrespond toplantspecies richness;
(6) examples of approaches that link changes in multi-trophic species interactions along the gradient of diversitytochanges inecosystemvariablesmediated bytheseinteractions;
(7) theimportanceoftheresultsfromtheJenaExperiment forappliedquestionsrelatedtograsslands,i.e.grassland managementandbioenergyproduction;
(8) challenges to the interpretation of the biodiversity experiments and how these can be addressed, in particular the necessityof weedingthe plots andthe lowperformanceoflow-diversityplots;
the timethe JenaExperiment wasfounded, as thesewere important for the design of the experiment (Section“The JenaExperiment, itsoriginanddesign”).Thissectionalso includesadetaileddescriptionoftheexperimentaldesignof theJenaExperiment,includingthestatisticalconsiderations that have guided both the experimental design and the analysisofdatafromtheJenaExperimentinthepastyears. We then describe the establishment and development of theplantcommunitiesinthediversityplots(Section“Plant communitydynamicsduringthelong-termexperiment”),as thedynamicnatureoftheplantcommunitiesinbiodiversity experimentsisrarelyreported,yettheplantcommunityforms thebasisfortheobservedbiodiversityeffects.
The review of the ecosystem-level responses to the manipulationof plantspeciesrichnessstartswithasection that summarizes the results of the Jena Experiment with respecttofourmajortopicsinbiodiversityresearch(Section “The footprint of diversity”), i.e. (a) the generality of the biodiversityeffectonecosystemfunctioningaswellasthe differences in this effect between different categories of ecosystemvariables,(b)theeffectofplantspeciesrichnesson ecosystemstability,(c)theoccurrenceofdelayedbiodiversity effects, and (d) the questionwhether dominant individual plantspeciesdriveor counteracttheeffectofplantspecies richnessonecosystemvariables.
Thefollowingsections(Sections“Responsesofindividual plantspeciestoplant speciesrichness”, “Invasioninto the targetcommunities”and“Responsesofothertrophiclevelsto plantbiodiversity”)thendescribetheresponsesofplantsand otherorganismstothemanipulationofplantspeciesrichness, startingwiththeresponsesofindividualplantspeciestothe changesinthecompetitiveenvironmentwhenplantsaresown indifferentmixtures.
Afterdiscussingeffects ofplantdiversityonthevarious organismsinthegrasslandecosystem,wereviewtheeffect ofplantspeciesrichnessonprimaryproductivityandwater andelementcycling(Sections“Theeffectsofplantspecies richness on plant community biomass”, “The effects of diversityon biogeochemicalcycling”).The effectof plant speciesrichness on plantcommunity biomass,above- and belowground,is singled outas aseparate section (Section “Theeffects ofplantspecies richnessonplantcommunity biomass”),becausethisvariablehasbeenthefocusofmost biodiversity experiments. Studies on ecosystem variables that represent animal-mediated processes, e.g. herbivory, aresummarizedinthefollowingsection(Section
“Animal-“Weedingissuesandmonocultureperformance”).
Finally, we illustrate the mechanistic approachtaken in the Jena Experiment, by outlining how functional traits have been used to understandthe mechanisms underlying biodiversity–ecosystem functioning relationships (Section “Mechanisms underlying the biodiversity–ecosystem functioningrelationships”).Usingtheexampleoftheplant speciesrichness–plantcommunitybiomassrelationship,the sectionalsoillustrateshowdetailedstudieshavebeencarried out toconfirm or refute the various hypotheses that have beenproposedtounderliethisrelationship.Thefinalsection (Section“Discussionandconclusions”)concludesthepaper by deriving a number of future avenues for functional biodiversity research, based on the insightsgained in the JenaExperiment.
Inthispaper,wewillusetheterm‘ecosystemfunctioning’ togenerallyrefer tothe ‘joint effectsof all processesthat sustainanecosystem’(Reiss,Bridle,Montoya,&Woodward 2009).Inthebiodiversityliterature,‘ecosystemprocess’and ‘ecosystemfunction’areoftenconsideredtobesynonymous (Reiss et al. 2009), and are often used to denote any variablethatcanbemeasuredinanecosystem.Morenarrow definitionsofecosystemfunctionshavethedisadvantagethat theydisagreeonwhichprocessestheydonotconsidertobe ecosystemfunctions.Amorenarrowdefinitionofecosystem function also does not solve the problem of whether two ecosystem variables describe the same function or not, a problemfrequently encountered inmeta-analysesof many ecosystemvariables(e.g.Allan,Weisseretal.2013;Meyer et al.2016).We will therefore usethe more generalterm ‘ecosystem variable’ throughout this paper, as a property that can be compared among different ecosystems. These ecosystem variables quantify ecosystem functions either directly(‘the changes inenergy and matterover timeand spacethroughbiologicalactivity’,sensuReissetal.2009),or indirectly(‘keyecosystempropertiesaffectedbyecosystem functions’,sensuJax2010).
The
Jena
Experiment,
its
origin
and
design
Biodiversity-ecosystem
functioning
research
around
2000
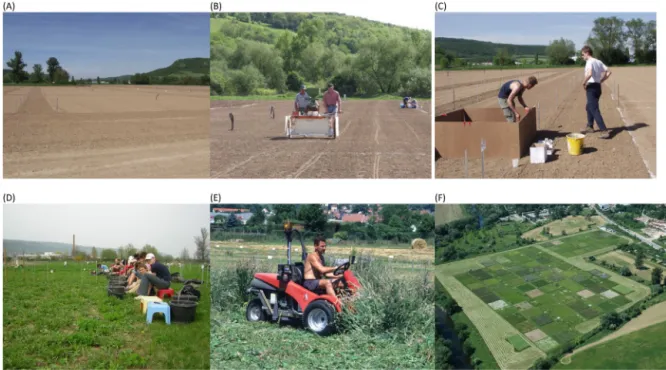
The biodiversity experiment in Jena was established in 2002 (Fig. 1) by the research unit 456 ‘The role of
Fig.1. ImpressionsfromtheJenaExperiment.(A)Viewoffieldsitebeforesowing,(B)Sowingoflargeplots,(C)Sowingofsmallplots, (D)Weeding,(E)Mowing,(F)Aerialviewofthefieldsitein2006.Thetrait-basedexperiment(TBE)wasestablishedin2010inthearea nexttotheriver(mownareaintheleft,cf.Fig.3).©TheJenaExperiment.
biodiversity for element cycling and trophic interactions — an experimental approach in a grassland community’, funded by the German Research Foundation (DFG), and supported by the Max Planck Society and the Friedrich Schiller Universityof Jena, Germany.First thoughtsabout theexperimentdatebacktotheyear2000,andtheapplication totheDFGwassubmittedin2001.
At the time the Jena Experiment was conceived, there wassomecontroversyabouttheresultsobtainedfromearly biodiversity experiments (Grime 1997; Kaiser 2000). The criticisms ranged from poor study design (Huston 1997) andfailure to account for statistical artefacts (Doak et al. 1998), to the choice of inappropriate model communities (Thompson, Askew, Grime, Dunnett, & Willis 2005). A reviewonbiodiversityeffectspublishedatthetime,initiated as a consensus paper among different schools of thought (Loreau,Naeemetal.2001),didnotsucceedtobridgethe differentinterpretationsoftheresults.
One important debate was whether the results obtained in the early biodiversity experiments represent a ‘true’ biodiversityeffect,i.e.anemergingpropertyduetospecies interactionsthatpositivelyaffectprocessesattheecosystem level.With respect toplantbiomassproduction, therewas theimportant observation thatmorediversemixtures have a higher chance of containing the most productive plant species from the species pool of the experiment (Wardle 1999),suchthatthehigherbiomassinmorediversemixtures could simplybethe consequence of this‘samplingeffect’ (latermoreclearlydefinedas‘selectioneffect’,Loreau1998), i.e.notresultingfrompositiveinteractionsbetweenspecies. Relatedtothisquestionwasthequestionofhowtocorrectly
compare the observed biomass (yield) of a diverse plant speciesmixturetotheyieldofthespeciesinmonocultures, whencalculatingthebiodiversityeffectasoveryielding,i.e. the difference between the observed and expected yield. Some authors argued that the mixture yield needs to be comparedtothe yieldofthe mostproductive monoculture amongthe species thatoccur inamixture,rather thanthe average productivity of the monocultures (Huston 2000). Thetheoreticalframeworkunderstandingbiodiversityeffects was only beginning to be developed at the time, e.g. the additive partitioning method that allows separating a net biodiversityeffectintocontributionsofcomplementarityand selectioneffects(Loreau&Hector2001).Itisnowaccepted that complementarity occursif theperformanceof species in mixture is on average higher than expected from their monocultureyields,whiletheselectioneffectexplainshigher productivity of mixtures by the dominance of individual, highlyproductivespecies.
Despitethesetheoreticaladvances,therewereanumberof potentialissueswiththedesignoftheearlyexperimentsthat could notberuledout aposteriori,e.g.that monocultures were available for only a subset of species, or that some covariates had not been measured, such as initial soil conditions,sothattheirinfluenceontheresultscouldnotbe tested(Huston1997,2000;Doaketal.1998;Wardle1998; Schmidetal.2002;Schmid&Hector2004).Thecritiques of theearlyexperimentshavebeenimportantpromotersof morerefinedstudiesandmethodsofanalysis,andhaveledto higherawarenessofpotentialartefacts(Schmidetal.2004). ForthedesignoftheJenaExperiment,itwasclearthatithad
onlynitrateinsoilwater).Asaconsequence,itwasdecided that the Jena Experiment should measure both the biotic componentoftheecosystem,i.e.allorganismsfrombacteria tomammals,aswellasvariablesrelatedtoelementcycling, inmuchdetail.
Design
features
of
the
Jena
Experiment
The design of the Jena Experiment was chosen to address the various statistical issues, real or perceived, of previous biodiversity experiments. In addition, it was decided tomeasure important potential covariates such as soilconditions.Importantaspectsofthedesignwere (1) alargespeciespoolof60species,toreducethesimilarity
ofmixturesathighplantspeciesrichness;
(2) adivision of plantsinto functionalgroupsbased on a multivariatetraitanalysis;
(3) an almost orthogonal combination of plant species richnessandfunctionalgrouprichness,i.e.thereareplots with8oreven16species,allofthesameplantfunctional group;
(4) anevenrepresentationofthedifferentfunctionalgroups at each diversity level, allowing the partitioning of biodiversity effects on ecosystem functioning into the effectsofspeciesrichness,functionalgrouprichness,and thecontributionofparticularfunctionalgroups(Roscher etal.2004);
(5) the establishment of monocultures of all 60 plant species in two replicates, to allow the partitioning of netdiversityeffectsintoselectionandcomplementarity effects(Loreau&Hector2001);
(6) theestablishmentofseveralsub-experiments.Inaddition tothe‘mainexperiment’withitslargespeciesgradient (1–60) species and large plots (originally 20×20m), anexperimentwithdominantspeciesonly(‘dominance
experiment’) and small (3.5×3.5m) replicates of the mainexperimentwere established.Several split-(split-)plotexperimentsinthemainexperimentservedtotest particular questions. A trait-based experiment (TBE) was established in2010based onthe results obtained fromtheotherexperiments.
Inthefollowing,weprovidethenecessarydetailsforthe understandingof the experimentaldesign of themain and
610mm(Hoffmann,Bivour,Früh,Koßmann,&Voß2014). The site was used as an arablefield for 40 years. It was converted fromgrassland intheearly1960sandwasused togrow vegetables andcereals until the onsetof the Jena Experiment.
Before the start of the experiment, the soil of the field site was surveyed (Roscher et al. 2004). The soil of the experimental site is an Eutric Fluvisol developed from up to 2m-thick loamy fluvial sediments that are almost free of stones. Surface stone cover (0–23%), sand content (45–628gkg−1), and CaCO3 concentrations (40–391gkg−1) varied considerably in the field site (coefficient of variation, CV >65%)whereas the variation in pH (7.1–8.4) was smaller, as was the variation inCorg (5–33gCkg−1),Ntotconcentrations(1.0–2.7gNkg−1),and ␦13Coftheorganicmatter(−27to−26‰,CV<21%).The high variation in stone cover was attributable to a small area with high stone cover in the south-eastern corner of thefield.Asexpectedforalowlandriverfloodplainsetting, sand content correlatedwithdistance fromthe Saale river (r=0.95).Closetotheriver,the topsoilconsistedofsandy loam,andgraduallychangedintoasiltloamwithincreasing distance totheriver.Forthe selection ofthe experimental plots,the areaswiththe highestsand contents(andlowest carbonateconcentrations),andthesmallareawithhighstone coveragewereexcluded.Toaccountforthespatialvariation in soil properties, a block design was used (see below,
Roscheretal.2004).
The target plant community of the experiment was a semi-natural species-rich mesophilic grassland (Molinio-Arrhenatheretea meadows, Arrhenatherion community,
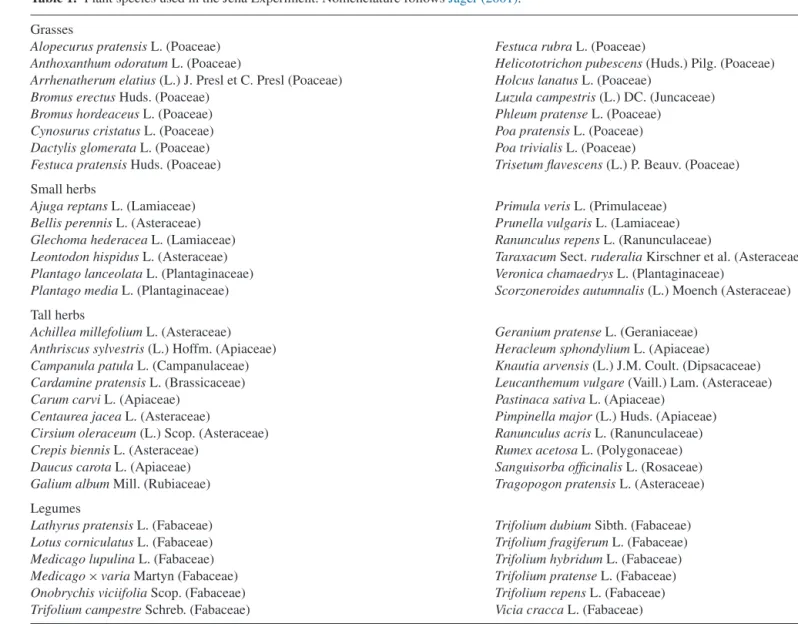
Ellenberg 1996), typical for fertile floodplain sites of the studyregion.Traditionally,thesegrasslandsaremanagedas haymeadowsmowntwoorthreetimesayear.Theselection of a speciespoolwas based ondata bases of the German flora,existingphytosociologicalstudiesintheJenaalluvial plain,andknowledgeofscientistsontheregionalgrassland vegetation.The60plantspeciesselectedfortheexperiment areallabletogrowwellundertheconditionsofthefieldsite, although theymaynotalloccur togetherinasemi-natural grassland(Table1).
Theplantspeciesweredividedintofourfunctionalgroups based on a classification of 18 functional traits, with the constraint thatmore thanfourfunctionalgroupswould be difficulttohandleinanexperimentaldesignrequiringlarge plots, and that each functional group should comprise a
Table1. PlantspeciesusedintheJenaExperiment.NomenclaturefollowsJäger(2001). Grasses
AlopecuruspratensisL.(Poaceae) FestucarubraL.(Poaceae)
AnthoxanthumodoratumL.(Poaceae) Helicototrichonpubescens(Huds.)Pilg.(Poaceae)
Arrhenatherumelatius(L.)J.PresletC.Presl(Poaceae) HolcuslanatusL.(Poaceae)
BromuserectusHuds.(Poaceae) Luzulacampestris(L.)DC.(Juncaceae)
BromushordeaceusL.(Poaceae) PhleumpratenseL.(Poaceae)
CynosuruscristatusL.(Poaceae) PoapratensisL.(Poaceae)
DactylisglomerataL.(Poaceae) PoatrivialisL.(Poaceae)
FestucapratensisHuds.(Poaceae) Trisetumflavescens(L.)P.Beauv.(Poaceae) Smallherbs
AjugareptansL.(Lamiaceae) PrimulaverisL.(Primulaceae)
BellisperennisL.(Asteraceae) PrunellavulgarisL.(Lamiaceae)
GlechomahederaceaL.(Lamiaceae) RanunculusrepensL.(Ranunculaceae)
LeontodonhispidusL.(Asteraceae) TaraxacumSect.ruderaliaKirschneretal.(Asteraceae)
PlantagolanceolataL.(Plantaginaceae) VeronicachamaedrysL.(Plantaginaceae)
PlantagomediaL.(Plantaginaceae) Scorzoneroidesautumnalis(L.)Moench(Asteraceae) Tallherbs
AchilleamillefoliumL.(Asteraceae) GeraniumpratenseL.(Geraniaceae)
Anthriscussylvestris(L.)Hoffm.(Apiaceae) HeracleumsphondyliumL.(Apiaceae)
CampanulapatulaL.(Campanulaceae) Knautiaarvensis(L.)J.M.Coult.(Dipsacaceae)
CardaminepratensisL.(Brassicaceae) Leucanthemumvulgare(Vaill.)Lam.(Asteraceae)
CarumcarviL.(Apiaceae) PastinacasativaL.(Apiaceae)
CentaureajaceaL.(Asteraceae) Pimpinellamajor(L.)Huds.(Apiaceae)
Cirsiumoleraceum(L.)Scop.(Asteraceae) RanunculusacrisL.(Ranunculaceae)
CrepisbiennisL.(Asteraceae) RumexacetosaL.(Polygonaceae)
DaucuscarotaL.(Apiaceae) SanguisorbaofficinalisL.(Rosaceae)
GaliumalbumMill.(Rubiaceae) TragopogonpratensisL.(Asteraceae) Legumes
LathyruspratensisL.(Fabaceae) TrifoliumdubiumSibth.(Fabaceae)
LotuscorniculatusL.(Fabaceae) TrifoliumfragiferumL.(Fabaceae)
MedicagolupulinaL.(Fabaceae) TrifoliumhybridumL.(Fabaceae)
Medicago×variaMartyn(Fabaceae) TrifoliumpratenseL.(Fabaceae)
OnobrychisviciifoliaScop.(Fabaceae) TrifoliumrepensL.(Fabaceae)
TrifoliumcampestreSchreb.(Fabaceae) ViciacraccaL.(Fabaceae)
similar number of species. Three groups of ecologically relevantattributesweredistinguished(Roscheretal.2004): 1. above- and belowground morphological traits that describeplantarchitectureanddefinespaceoccupancy; 2. phenologicaltraits that describeplantdevelopmentand
definetemporalpresence,e.g.theoccupancyofseasonal nichesbyspecies;
3. thecapacityforN2-fixationbylegumesasanimportant physiological trait (based on experiences of earlier biodiversityexperiments).
The application of multivariate cluster analysis and ordination techniques resulted in the following four functionalgroups(Table1,Roscheretal.2004):
Speciesgroup1(‘grasses’,16species):Thegroupcontains allspeciesofthePoaceaeandLuzulacampestris(Juncaceae). Commontraitsareaperenniallifecycle(exceptionBromus hordeaceus),ashort-livedprimaryrootsystem,theprevailing ‘caespitose’growthandoverwinteringgreenleaves.
Speciesgroup2 (‘smallherbs’,12species):The second speciesgroupsubsumesherbsofsmallstature.Besidestheir lowcanopyheight,allspeciesshowthesameseasonalityof foliage(overwinteringgreen,exceptionLeontodonhispidus)
andhaveaperenniallifecycle.
Speciesgroup3(‘tallherbs’,20species):Thethirdspecies groupconsistsofherbswithmediumortallstature(canopy height of vegetative and flowering plants). Their growth form accordingto EllenbergandMueller-Dombois(1967)
is predominantly ‘semirosulata’,but the speciesare rather variablewithregardtoothertraits.
Species group 4 (‘legumes’, 12 species): All legumes wereforcedintoonegroupbythedoubleweightingofthe legume/nonlegumetrait.Thereforetheydiffermarkedlywith respect tothe other characters. Because there is abundant evidence that legumes have disproportionate effects on ecosystem variables (Spehn et al. 2002), it is useful to considerthisgroupofspeciesseparately.
FunctionalGroup 8 8 8 8 8 8 8 8 8 8 8 8 8 16 16 16 16 16 16 16 16 16 16 16 Grasses 8 4 4 2 3 3 2 16 8 8 5 5 6 4 Smallherbs 8 4 4 3 3 2 2 8 8 5 5 6 4 Tallherbs 8 4 4 3 2 3 2 16 8 8 6 5 5 4 Legumes 8 4 4 3 2 3 2 8 8 6 5 5 4 Numberofreplicates 1 1 1 1 1 1 1 1 1 1 1 1 4 1 1 1 1 1 1 1 1 1 1 4
The
main
experiment
In the main experiment that was established 2002 and where most research has been conducted, plant species numberandthenumberoffunctionalgroupsinthespecies mixtureswerevariedasindependentlyaspossible.Species numberincreasedonalogarithmicscalewithlevels1,2,4, 8,and16species(and60-speciescontrols,seebelow).The fivelevelsofspeciesrichnesswerenear-orthogonallycrossed along agradient in plant functionalgroup richness (1–4), with the restriction that functional group number cannot exceedspecies number(Table2).Forthe speciesrichness levels 1, 2, 4, 8, 16, all possible combinations ‘Species number×Numberoffunctionalgroups’werepresentinthe designfourtimes.Exceptionswerethe16-speciesmixtures withonlyonefunctionalgroup(lownumberof species in legumesandsmallherbsTable1),andthemonoculturesand 2-speciesmixtures,wherethenumberofreplications(plots) wasincreasedtoaccount forexpectedhighervariability at lowdiversitylevels.Alldiversitylevelswerethusrepresented in 16 plots except for the 16-species mixture (14 plots,
Table2).Therestrictionto16insteadofall60monocultures wasduetothelogisticconstraintsofmaintaining thelarge plots. Random allocation of species to the experimental mixtures including monocultures was restricted by the requirement that each functional group should be equally representedateveryspeciesrichnesslevel.Speciesforeach particularmixturewerechosenrandomly(withreplacement) fromthespeciespool.Thus,therewere78plotsintotalfor thediversitylevels 1,2, 4,8, and16species(Table2).In addition,therewerefourplotswith60species(i.e.thefull speciespool)sothatthetotalnumberofspeciesmixturesin themainexperimentwas82.
Thespeciesmixtureswerecomplementedbyanumberof treatmentsthatservedascomparisons:bareground(4plots), successionwithmowing(2),andsuccessionwithoutmowing (2)(total8plots).Inaddition,therewerecontrolplotswith,
C4 plantsonly(2),arablefieldswithconventional farming androtation,managedbyanagriculturalcooperative(2)and semi-naturalgrasslandsadjacenttothefieldsite(2)(Fig.3). The totalnumber of large plots is thus 82 plus 8+6=14 additionalplots.
AmainaimwhensettinguptheJenaExperimentwasto enableseveralresearchgroupstostudyecosystemvariables on the same plots (‘all measurements on all plots’) and over atime-scale of morethan two years. Thus,the plots neededtobelargeenoughtoallowlong-termobservations. In2002plantmixtureswereestablishedonplotswithasize of 20×20m(Fig. 2A).The largeplot size allowed us to continuetheexperimentuntiltoday.Plotsizewasreducedto 6×5.5minspring2010tofreespaceandworkingtimefor newexperiments(Fig.2B).In2012,plotsizewasextended by reinstating weedingon someformer invasion subplots (Fig.2B).
Replication
of
the
main
experiment
in
smaller
plots
In an additional experiment, also set up in 2002, all diversitymixturesfromthemainexperimentwereidentically replicatedin3.5×3.5mplots(total82plots),totestforthe effectofplotsizeontheresultsobtained.Thisexperimentalso servedtoassesswithin-mixturevariabilityanditsdependence ondiversity(Roscheretal.2004).Inasplit-plotdesign,these replicateswerealsousedtotestfortheeffectsofincreased sowingdensityandevennessonthespeciesrichness-biomass relationship(Schmitzetal.2013).Thesmallreplicatesofthe mainexperimentsweregivenupin2008.
Monocultures
in
small
plots
Monocultures served as a basis for calculations of overyieldingandanyfurthercomparisonsoftheperformance ofplantspeciesandtheirinteractionswithotherorganisms
Fig.2. Layoutofa20×20mplotofthemainexperiment.(A)Plotoutlinein2002:thecentralcorearea(darkgrey)wasleftuntouched forthefirstyearsexceptforplantbiomassharvestimmediatelybeforethemowingeventandbecametheplotareaforlaterphases.Thearea indicatedbythebrokenborderswasusedforplantcoverestimates.Toavoidmutualinterferencebetweenresearchers,subprojectsoftheJena Experimentcarriedouttheirresearchinallocatedsubplots.Inaddition,therewereanumberofsplit-plotexperiments,e.g.theManagement experiment(2006–2010)withfourlevelsoffertilizationandmowing.TheDroughtexperimentwasnestedwithinthemanagementexperiment (seetext).Invasion1(Oldinvasion):variousinvasionexperimentsinsmallersubsubplotswhereweedingandseedadditionwasmanipulated. Inanumberoffaunamanipulations,thepresence(ordensityinthecaseofearthworms)ofAbovegroundinsects,Belowgroundinsects,both groups,Nematodes,EarthwormsandMolluscs(notshown)wasmanipulated.OneControlsubplotservedforcomparisons.(B)Plotoutlinein 2010afterplotreductionto6×5.5m.TheSoilwater/hydrology(withe.g.suctioncupandtensiometerinstallations)andsomemanipulated subplots(Drought,Earthworms)weremaintained,i.e.stillweeded.TheInvasion2(Newinvasion)subplotwasnotweededsince2009(see maintext).Theremainderoftheoldplotareawasmownfrequently,atthesametimeasthepathsbetweenplots.Allcornersarecolour-coded inthefieldtoallowforeasierorientation.In2012,theEarthwormplotsweregivenupandmonolithswereremovedfortheEcotronexperiment andtheholesfilledwithlocalsoil.From2011onwards,aformerSuccessionsubplot(hatchedarea)nexttothedroughtexperimentwasweeded again,extendingplotsize.Theredlinesrepresentthelocationoftheelectricity/datacablesbelowground.Theopencirclerepresentsthelocal meteorologystationwithe.g.temperatureandrelativehumiditysensorsinvariousheights.(Forinterpretationofthereferencestocolourin thisfigurelegend,thereaderisreferredtothewebversionofthisarticle.)
between different diversity levels. Because the main experiments only contained monocultures of 16 species due to logistic constraints, all 60 species included in the JenaExperimentweresowninmonoculturesin3.5×3.5m plotswithtworeplicates perspecies(total120plots).The monocultureswereusedforcalculationsofoveryielding(e.g.
Roscher et al.2005) for trait measurements, and for life-historystudies(e.g.Heisse,Roscher,Schumacher,&Schulze 2007;Roscher,Scherer-Lorenzenetal.2011).Oneplotper specieswasgivenupin2007,andthesecondwasreducedto 1×1mweededareainspring2009,toreducetheweeding effort.
In 2010, new monocultures were established for all species,for additionaltrait measurements,as inseveralof theoriginalmonocultures coverhadbecomevery low(see Section“Weedingissuesandmonocultureperformance”on monocultureperformance).
In spring 2005, a common garden was established at thefieldsite,where5–10individualsofeach experimental species,pre-growninagreenhouse,wereplantedinaseed bed.Thiscommongardenwasusedfortraitmeasurements
anddeterminationofplantbiomassproductionofindividuals growing without competition. The common garden was maintaineduntilautumn2007.
The
dominance
experiment
Thisexperimenton3.5×3.5mplotswassetupin2002, todisentangletheeffectsofspeciesrichnesspersefromthe presence/absenceofparticulardominantspeciesorparticular pairs of dominant species. Studyingthe effects of species along the diversity gradient, and of particular plant-plant interactions,wasnotpossibleinthemainexperiment,asinthe mainexperimenteachplantspeciesonlyoccurredinasmall subsetofplots,aconsequenceofthelargespeciespool(the mostfrequentspecieswasthesmallherbPlantagolanceolata
which occurred in 18 large plots). Using dominance of speciesinsemi-naturalgrasslandsinthevicinityoftheJena Experimentasaselectioncriterion,the ninespeciesof the dominanceexperimentwere:theherbsAnthriscussylvestris
and Geranium pratense, the legumes Trifolium pratense
Fig.3. Layoutofthefieldsitein2015.TheSaaleriverisEastofthefieldsitei.e.totheright.Thecoordinateswerefixedatthebeginningof theexperiment,andtostoresamplinglocationpreciselyinthedatabase.Plotsarearrangedinfourblocks.Thefigureshowsthelocationsof plots;largeplotswere20×20m.Smallplots(originally3.5×3.5m)wereplacedbetweenrowsoflargeplots.Smallplotsthatweregiven up,e.g.thesecondreplicateoftheoriginalmonocultures,arenotshown.Thetrait-basedexperiment(TBE,Ebeling,Pompeetal.,2014)is aseparateexperimentalmostparalleltotheSaaleriver.B1A23andB3A25areagriculturalcontrolplotswithacroprotation.B2A23and B3A18arehalf-plotsusedtogrowC4-plants.TheBotanicalGardenholdsindividualsofallspecieswhichareusedtotrainstudenthelpers forweeding.B0A01(notshown)andB0A02areplotsplacedinadjacentmanagedgrasslands.
Arrhenatherumelatius,Dactylisglomerata,Phleumpratense
andPoatrivialis.Emphasisondetectingeffectsofindividual species was reflected in a different experimental design. Speciesrichnesslevelsvaried from1,2, 3,4, 6,to9, and each species occurred in eightmixtures atevery diversity level.Additionally, each possibletwo-species combination appeared equally often at each diversity level, and each speciesalsooccurredinduplicatedmonocultures.Allspecies mixtures were replicated once (i.e., two plots) with the exceptionofthe9-speciesmixturethatwasreplicatedeight times(Roscheretal.2004).Intotal,therewere188plotsfor the2-to9-speciesmixturesindominanceexperiment(2×36 plots=72plotsfor2-speciesmixtures,2×24plots=48plots for 3-species combinations, 2×18 plots=36 plots for 4-speciescombinations, 2×12 plots=24plots for 6-species combinations,and8plotswiththe9-speciesmixture),plus 9×2plots=18plotsmonocultures,whichwerealsopartof themonocultureexperiment.The206plotswerereducedin sizeto2.5×2.5min2008andto1×1min2010.
Blocking
and
soil
samples
Becauseofthegradientinsoilparametersperpendicularto theSaaleriver(e.g.sand,siltandclaycontent,seebelow),the experiments(mainexperiment,dominanceexperiment,small replicatesofthemainexperiment,monocultures)weresetup infourblocks.Forthemainexperimenteachblockcontained an equalnumberof plotsperspecies richness×functional groupnumbercombinations,correspondingtoarandomized blockdesign(Fig.3).Thesoilsamplesthatweretakenfrom everyplotofthemainexperimentalsoservedascovariates inanalysesoftheinfluenceofsoilparametersonecosystem variables(Huston&McBride2002).
Split-plot
treatments
in
the
main
experiment
The plotsof the main experimentwere largeenoughto establishsplit-plotexperimentstotestparticular questions. This possibility was used since the beginning of the Jena
Experiment. Invasion experiments tested the resistance of theplantcommunitiesagainstplantinvasion(e.g.Roscher, Beßler et al. 2009; Roscher, Schmid, & Schulze 2009). A split-split plot experiment with various genotypes of
Loliumperennewassetuptotestforinteractionsof within-plantgeneticdiversitywithplantspeciesrichness(Roscher, Schumacher, Weisser, & Schulze 2008; Nestmann et al. 2011).
In manipulationsof above- andbelowground fauna,the densities of particular consumer groups were reduced on subplots.Thesemanipulationsweredesignedtoinvestigate howtheseconsumergroupsaffecttherelationshipbetween plant species richness and ecosystem variables, such as productivityanddecomposition.Thesplit-plotmanipulations included themanipulationof the presenceof aboveground insect herbivores, belowground insects, molluscs and nematodes,andcombinationsofthesemanipulations,using targetedinsecticides/molluscidesaswellasmanipulationof earthwormdensities(Eisenhauer,Milcu,Allanetal.2011).
To investigate how biodiversity may mitigate effects of climatechange,asplit-plotwas established,totestforthe resistance andresilience of the plantcommunities against drought (Droughtexperiment,Vogel, Scherer-Lorenzen, & Weigelt 2012). In an additional experiment, the effects of land-use intensificationon the biodiversity-productivity relationshipwas tested(Managementexperiment, Weigelt, Weisser, Buchmann, & Scherer-Lorenzen 2009). These experimentswerealsousedtotestfortheinteractionbetween managementanddrought(Vogeletal.2012).
Alltheseexperimentsaredescribedinmoredetailbelow.
Plantinvasionexperiments
Differentinvasionexperimentswereconductedinthearea of theoriginal 20×20mplotsofthe mainexperimentfor variouslengthsoftime.Theseexperimentswereestablished in all weeded plots of the main experiment, but studies of community assembly also included the four unweeded controlplots(successionwithmowing;successionwithout mowing;Roscheretal.2016).Theexperimentswereplaced in two larger invasion areas in each plot, the so-called ‘old’and‘new’invasionsubplots(Fig.2).Theoldinvasion
subplothadanoverallareaof6.5×4.5m,subdividedinto six subplots of 2×2.25m withdiffering weedinghistory. Twosubplotsandthusatotalareaof 2×4.5mwerenever weededsincetheestablishmentofthemainplotsin2002(‘s’ —subplotsinRoscher,Schumacher,Gerighausen,&Schmid 2014).In2004,weedingwasstoppedintwoadditionaland adjacentsubplotsofintotal2×4.5msize(‘c’—subplots) andin2008,weedingwasstoppedinathirdpairofsubplots (‘w’—subplots).In2005,viableseedsofall60speciesof theexperimentalspeciespoolwereaddedtooneofthetwo subplotsof the threeabove-mentioned pairswithdifferent weedinghistory(‘s+’,‘c+’,‘w+’),whilethesecondsubplots servedascontrolwithoutseedaddition(‘s−’,‘c−’,‘w−’). Thenumberofaddedseedswas 1000viableseedsperm2 distributedequally among the added 60species (Roscher,
Schmidetal.2009).Between2005and2007,allspeciesnot belonging tothe initiallysownspecies combinationswere regularly weeded in the ‘w−’ subplots, while all species notbelongingtothesownspeciespoolwereweededinthe ‘w+’subplots.From2008onwardsthewholeareaoftheold invasionexperimentwasnotweededanymore.
Thenewinvasionexperimentwasestablishedin2009with anareaof5×3m.From2002untilJune2009thisareawas part of the corearea of the mainplots and thusregularly weededtwiceayear.InJuly2009,weedingwasstoppedon thissubplotofthemainexperiment.
Inaddition,31monoculturesofcommoninvasivespecies were established in 2010 on small 3.5×3.5m plots for analysesofoveryieldingintheinvasionexperiment.These monocultureswereregularlyweeded.
Thus,theinvasionexperimentsincludedtreatmentswhere weedingornotweedingwaspracticedfordifferentdurations, andtreatmentswithandwithoutseedaddition.
Communityhistoryexperiment(‘Swissboxes’)
In 2011a communityhistoryexperiment was startedin 48 experimental plant communities (twelvemonocultures, twelve two-species mixtures,twelvefour-species mixtures and twelve eight-species mixtures), totest if evolutionary processesduringthefirsteightyearsoftheJenaExperiment had led to measurable evolutionary changes in the plant communities (van Moorsel, Schmid, Hahl, Zuppinger-Dingley, & Schmid 2017). Two community selection treatments were used: plants with eight years of shared community selection in the Jena Experiment (selected communities)andplantswithoutacommonselectionhistory in the Jena Experiment (unselected communities). Seeds of selectedcommunitieswereproducedinanexperimental gardeninZurich,Switzerland,fromcuttingsthathadbeen made inthe JenaExperimentandwerethenplantedinthe original species combination in fenced plots in Zurich to reduce pollinationbetween communities. Asmall number was additionally collecteddirectlyinthe plotsof theJena Experiment. All these seeds were thus offspring of plant populations that had been sown in 2002 andgrown until 2010 inplots ofthe JenaExperiment.Seedsof unselected communities were produced by the original suppliers of seeds for the Jena Experiment (Rieger Hoffmann GmbH, Germany). This supplier collected plants of the different species atfieldsitesin Germanyandpropagated them for atleastfiveyearsinmonoculture.
The seeds of selected and unselected communities germinated and were transplanted to 2×2m subplots in March2011.Therewerefour1×1mquadratswithdifferent soiltypesineachsubplot(‘Swissboxes’,Fig.2).Theoriginal plantcoverwasremovedinSeptember2010andthesoilwas excavatedtoadepthof0.35mandsieved.Halfofthesoilwas gamma-sterilizedtoremovetheoriginalsoilcommunity,and theotherhalfwasnotsterilized.Ofthesterilizedsoil,half wasinoculatedwith4%(byweight)ofliveoriginalsoilofthe correspondingplotand4%andoflivesugar-beetsoil(‘native
halves.Seedlingsofselectedcommunitiesweretransplanted intoone halfof each quadrat,andseedlingsof unselected communitiesinto the otherhalf. Plantcommunities inthe Swissboxeswereweededthreetimesayearand‘mown’by cuttingthe plantsto3cmaboveground twiceayearatthe sametimetheotherexperimentsweremown.
Plantgeneticdiversitymanipulations
Thisexperimentwassetupwith15geneticallydifferent cultivarsof L. perenneL.(Poaceae), acommon grassland speciesnotincludedintheexperimentalspeciespool,inall plotsofthemainexperiment.Thissplit-split-plotexperiment wasusedtostudyhowgeneticallydifferentlinesofaspecies vary in their response to plant species richness (Roscher, Schumacheretal.2008)andwhetherplantspeciesrichness affectsgeneticdifferentiationanddiversity(Nestmannetal. 2011).
Faunamanipulations
Invertebrates influence a wide range of ecosystem variablesandthemselvesreacttothemanipulationofplant species richness (Scherber, Eisenhauer et al. 2010). To experimentallyinvestigatehowdifferentinvertebrategroups affect(a)plantcommunitydevelopment,(b)individualplant performance,and(c)therelationshipbetweenplantspecies richness and plant biomass, the presence of invertebrate groups was manipulated using pesticides. Five groups of invertebrates were excludedfrom subplots within plots of themainexperiment(Eisenhauer,Milcu,Allanetal.2011): a) molluscs(2005–2009);
b) abovegroundinsects(2003–2009); c) belowgroundinsects(2003–2009); d) earthworms(2003–2011);
e) nematodes(2005–2008).
In some of the subplots, two taxa were excluded in combination, to test for interactive effects on ecosystem variables. For example, above- and belowground insects weremanipulatedindividually,butwerebothexcludedfrom oneadditionalsubplot.Thesamewastrueforaboveground insectsandmolluscs.Allsubplotswerelocatedoutsidethe originalcentralcoreareaofeachplotandthepositionofthe subplotswasrandomizedbetweenplots(Fig.2).
Molluscs were excluded on a 2×2m subplot by applicationofslugpellets(activesubstance:4%metaldehyde (C8H16O4); Spiess-Urania, Hamburg,Germany) ata dose
increaseincorporationintothesoil(approximately0.7ga.i. m−2with7applicationsperyear).
Aboveground insects were excluded on a 5×5m subplot by application of the insecticide ‘Perfekthion’ (activesubstance:40%dimethoate(C5H12NO3PS2);BASF, Ludwigshafen,Germany)asanaqueoussolution(0.1%)ata doseofca.30mlm−2(ca.50mlm−2in2008)andatmonthly intervals between April and September (approximately 0.061ga.i.m−2,with5applicationsperyear).
Interactions between aboveground insects and
belowgroundinsectsandbetweenmolluscsandaboveground insects were investigated in two additional subplots. The aboveground insects×molluscexclusionsubplot(2×2m) and the aboveground insects×belowground insects exclusion subplot (2×5m)were bothtreated atthe same doses and intervalsas subplotswith exclusion of asingle group(seeabove).Anuntreatedsubplot(2×5m)servedas controlforalltreatmentswherenowaterwasaddeddueto thesmallamountsofwaterusedinthepesticidetreatments.
Nematodedensitiesweremanipulatedonallexperimental plotsstartingin2005.Oneach plottworandomlyselected subplots of 1×1mwere used toestablish a‘nematicide’ and a ‘control’ treatment. The widely used nematicide fosthiazatewasappliedtonematicidesubplotsasagranulate (Nemathorin, Syngenta Agro GmbH, Maintal, Germany) threetimesayearusingasieve.Tofacilitatehomogeneous applicationthenematicidewasmixedwithsoilfromtheJena Experimentfieldsite (10%w/w fosthiazate, 3g/m2 mixed with 97g Jena soil). The control subplots received 100g Jenasoilperapplication tocontrolfor theaddition ofsoil (Eisenhauer,Ackermannetal.2010).
Earthwormdensitiesweremanipulatedonthe1-(16plots), 4- (16) and16-plantspecies plots(14) startingSeptember 2003. On each plot, two randomly selected subplots of 1×1m were used to initially establish ‘earthworm’ and ‘earthwormreduction’ treatments. Subplots were enclosed with PVC shields aboveground (20cm) and belowground (15cm)to reducecolonization byearthworms. In the first threeyearsoftheexperiment,‘earthworm’subplotsreceived 25 adult individuals of Lumbricus terrestris L. (average fresh weight withgut content 4.10±0.61g (mean±s.e.)) per year (15 individuals in spring and 10 in autumn) as earthworm density was low after establishment of the JenaExperiment.Earthwormadditionwasstoppedin2006 as colonization of the field by earthworms had reached
equilibriumlevel,asindicatedbysimilarearthwormdensities in control and earthworm addition subplots (Eisenhauer, Milcu, Sabais, & Scheu 2008). To reduce earthworm densityin‘earthwormreduction’subplots,earthwormswere extracted twice a year (spring and autumn) by electro-shocking(fordetails,seeEisenhauer,Milcu,Nitschkeetal. 2009). The success of earthworm density manipulations was proven by measuring the soil surface activity of L. terrestris, which was significantly lower (38%) in the earthworm reduction treatment than in the earthworm treatment(Eisenhaueretal.2008).
Managementexperiment
ThestandardmanagementintheJenaExperimentwastwo cutsperyearwithbiomassremovalandnofertilisation.To testiftheresults obtainedunderthistypeofmanagement, which is less intensive than in many grasslands in the area that are managed for high productivity, could be extrapolated to grasslands managed more intensively, a gradient in management intensity was established in 80 plots of the main experiment (the two monocultures of
BellisperennisandCynosuruscristatus werenotuseddue toverylowcover(<10%)).Fivesubplotswereestablished andmanagement variedinmowingregime (one(M1),two (M2)orfour(M4)cutsperyear)andthe amountof NPK-fertilizer application(nofertilizer (F0);100 (F100)or 200 (F200) kgNha−1yr−1) and similar increases in P and K additions (Weigelt et al. 2009). Mowing and fertilisation were combined as follows to yield five management treatments:M1F0,M2F0,M2F100,M4F100,M4F200.All threefertilizertreatmentswerearrangedrandomlyonanarea ofeach1.6m×4mwithinthemainplots(20×20m),while theM2F0treatment wasalwayslocatedinthecentralcore areaoftheplots,representingthestandardmanagementof theJenaExperiment.TheM1F0subplotswasalwaysplaced attheplotmarginsduetologisticalconstraints.Fertilization wasdonetwiceayear(31Marchand23June2008,31March and16 June 2009)andmowingtook placeinspring (end of April, onlyM4- subplots),in earlysummer (beginning of June, all subplots), end of July (M4-subplots) and in latesummer atthe beginning of September(all subplots). Themanagementexperimentwasstoppedafterthegrowing seasonof2009.
Droughtexperimentandmanagement×drought interaction
Prolonged periods of summer drought is one of the consequencesofglobalclimaticchangeandthequestionhow biodiversitymitigateseffectsofsuchclimaticextremesisan important question inglobal change research(e.g., Isbell, Cravenetal.2015).Theeffectofplantspeciesrichnesson droughtresistancewastestedinanexperimentwheredrought was artificially induced (Vogel et al. 2012). The drought experimentwassetupin2008usingtransparentrainshelters. Everyyearsubplots(1.6×2m)wereshieldedfromrainfor sixweeks,beforethesecondcutoftheplots.
Rain shelters were made of LDPE greenhouse film (www.dm-folien.com) in 2008 and of PVC sheets (www. paruschkekunststoffe.de,productcode: PVCSPK7018K10) since 2009 because of its higher durability. Rain shelters wereinclinedataheightof1.3–1.5mtoenableventilation andrunoffofrainwaterinonedirection1mawayfromthe corearea.Controlsubplotswerepartofthecoreareaofthe mainexperiment.Theyremainedunshelteredandtherefore receivedambientprecipitation.
Whenthedroughtexperimentwasstarted,therewasstrong interestintheinteractionbetweendroughtresistanceandland useintensification.Thus,oneshelteredandoneunsheltered subplot wasestablishedfor eachmanagement treatmentin each ofthe 80plotscoveringthewholediversitygradient. In each subplot a centralarea of 1×1m was marked for measurements.
Afterthemanagement experimentwasstopped in2009, onlythe droughttreatment intheM2F0treatment(i.e. the standardmanagementoftheJenaExperiment)waskeptand maintained.Thisareawasenlargedin2009toestablishan additionalroofcontrol inallplots,e.g.ashelteredsubplot wherecollectedrainwaterwasaddedaftereachrainevent, toseparatethepureroofeffect(heat,alteredlightconditions) from effects of reducedwater availabilityonour response variables (Vogel et al. 2012). Thus, starting in 2009, the droughtexperimentconsistedofthreeplotsof1×1msizein eachplotofthemainexperiment:(i)onemarkedplotinthe coreareaofthemainexperimentunderambientconditions (ambient),(ii)oneplotbelowtherainshelterwithoutaddition ofrainwater(drought)and(iii)oneplotbelowtherainshelter withadditionofrainwater(roofcontrol).The currentrain sheltersare2.6×3.0minsizetoavoidedgeeffectsbelow theroofs.
Trait-based
experiment
(TBE)
In 2010, a new diversity experiment, the Trait-based experiment (TBE), was initiated, where plant community selectionwasbasedonplanttraits.Thisexperimentaddressed the question whether functional diversity — measured as variationintraitvalues—isunderlyingthefunctioningof communities.IntheTBEplantcommunitieswereestablished withdifferentapriorifunctionaldiversity(Ebeling,Pompe etal.2014).Theexperimentmaximizesthecoverageoftrait space by a community that is predictedto lead to higher ecosystem functioning(Dimitrakopoulos&Schmid2004). Thispredictiveapproachwaspossiblebecausealargenumber of plant traitshad been measured in the JenaExperiment and allowed for hypothesis-driven biodiversity–ecosystem functioningresearch.Afulldescriptionofthedesignisgiven inEbeling,Pompeetal.(2014).
Insummary,480plots(90plotsforthemainexperiment, 82plotsforthesmallreplicatesofthemainexperiment,120 monocultures,188mixturesforthedominanceexperiment) wereestablishedin2002.Throughthevariousamendments,
×
Droughtexperiment 1×1m=1m2(×2) 80×2=160
Oldinvasion 2.25×2m=4.5m2(×6) 86×6=516
Newinvasion 5×3m=15m2 82
Communityhistoryexperiment (‘Swissboxes’)
1×1m=1m2(×4) 52×4=208
Managementexperiment (2006–2009)
1.6×4m=6.4m2(×4) 0(originally80×4=320)
Smallreplicatesofthemainexperiment (2002–2010)
3.5×3.5m=12.25m2 0(originally82+12controls,e.g.
succession)
Dominanceexperiment(2002-today) 1×1m=1m2(originally3.5×3.5m) 188(2-to9-speciesmixtures)
Monocultures2002(2002-today) 1×1m=1m2(originally3.5×3.5m) 60(originally2×60=120)
Monocultures2010(2010-today) 1×1m=1m2 60
Monoculturesinvaders2010 (2010-2014)
1×1m=1m2 0(originally31)
Trait-basedexperiment(2010-today) 3.5×3.5m=12.25m2 138
Totalplots 534
thenumberincreasedto534 plotsin2016,withmorethan 1100subplotsaspartofthemainexperiment(Table3).
Plot
establishment
and
maintenance
Thefieldwas ploughedafter the lastharvestin autumn 2000andkeptfallowthroughout2001.In orderto reduce the weed pressure the field was harrowed bimonthly (June, August, October) and treated with glyphosate (N-(Phosphonomethyl)-glycine, Roundup) in July 2001. In spring2002,theexperimentalareawasharrowedtwicewithin 5weeksbeforetheplotswereestablished.
Seeds were obtained from commercial suppliers. The desired seedling density was 1000 seedlings per m2. In mixtures, species were sown at equal proportions. The number of seeds taken for each species was adjusted according to the observed germination rate during a laboratory study. Because many grassland species have dormant seeds, various pre-treatments of seeds were conductedinthelaboratorytotesttheireffectsongermination rates.Scarificationincreasedgerminationratessuccessfully in seven species, and pre-treatment with gibberellic acid improved germination in eight species.The seedmaterial was therefore treated accordingly (see Roscher et al. 2004 for details). The species mixtures of the main experiment,thesmall replicatesthedominanceexperiment andthemonocultures weresownfrom11to16May2002 (Fig.1A–C).
Similar preparations of the ground were made for the establishmentofplotssetupafter2002,includingthe trait-basedexperimentexceptthattheareatobesownwascovered withblack plastic foilfor severalmonths instead ofusing glyphosate.
Allplotsexceptthefournon-weededcontrol(succession) plotsofthemainexperimentwereweededtwiceayearduring a3-weekinterval(Fig.1D,since2012:threetimesayear) and mown twice ayear (Fig. 1E). Mowing took placein earlyJuneandearlySeptember,correspondingtotheusual managementofextensivelyusedhaymeadowsintheregion. The firstweedingperiodwasinspring (April),thesecond after the first mowing in July, when the canopy was not fullyclosedandthevegetationwaslowenoughtominimize damage. In order to reduce soil disturbance, the roots of theweedswerecutwithaknifejustbelowthesoilsurface andremoved.Tocombatnoxious weedsandtoreducethe enormousworkloadofweeding,itwasdecidedtoselectively useherbicidesinadditiontoweeding.Individualapplications tocreepingthistleCirsiumarvense(L.)Scop.(withRoundup) and sorrel (broad-leaved dock) Rumex obtusifoliusL. and curled dock Rumex crispus L.(withBanvel M,Syngenta) were successful and virtually eradicated these species by 2004.TocombatTaraxacumofficinale,largeindividualswere individuallyremovedusingbulbtrowelssince2007.In the periodfrom2006to2009,herbicideagainstdicotyledonous plants (BanvelM) was applied on anumber of plots with grasses only. Inthe sameperiod, Select240EC wasused