HAL Id: halshs-00692516
https://halshs.archives-ouvertes.fr/halshs-00692516
Submitted on 30 Apr 2012
HAL is a multi-disciplinary open access
archive for the deposit and dissemination of
sci-entific research documents, whether they are
pub-lished or not. The documents may come from
L’archive ouverte pluridisciplinaire HAL, est
destinée au dépôt et à la diffusion de documents
scientifiques de niveau recherche, publiés ou non,
émanant des établissements d’enseignement et de
Carbon Tax and Equity : The Importance of Policy
Design
Emmanuel Combet, Frédéric Ghersi, Jean Charles Hourcade, Daniel Théry
To cite this version:
Emmanuel Combet, Frédéric Ghersi, Jean Charles Hourcade, Daniel Théry. Carbon Tax and Equity :
The Importance of Policy Design. Dias Soares, C., Milne, J., Ashiabor, H., Deketelaere, K., Kreiser, L.
(ed.). Critical Issues In Environmental Taxation, Oxford University Press, pp 277-295, 2010, Oxford
University Press. �halshs-00692516�
Carbon Tax and Equity
The importance
of Policy Design
Emmanuel Combet
Frédéric Ghersi
Jean-Charles Hourcade
Daniel Théry
Reprint from Critical Issues in Environmental Taxation vol. VIII,
Oxford University Press, Oxford, 2010: 277-295
Carbon Tax and Equity:
The Importance of Policy Design
Emmanuel Combet1 Frédéric Ghersi1 Jean-Charles Hourcade1 Daniel Théry1
Abstract
This research aims at clearing up misunderstandings about the distribu-tive impacts of carbon taxes, which proved to be a decisive obstacle to their further consideration in public debates. It highlights the gap between partial equilibrium analyses, which are close to the agents’ perception of the costs of taxation, and general equilibrium analyses, which better capture its ultimate consequences. It shows that the real impact on households’ income distribu-tion is not mechanically determined by the initial energy budgets and their flexibilities but also depends upon the way tax revenues are recycled, and upon the general equilibrium consequences of the reform thus defined. The comparison of three tax-recycling schemes, modelled in a general equilibrium framework applied to 2004 France, demonstrates the existence of trade-offs between aggregate impacts on GDP and employment, the consumption of the low-income classes, and a neutralisation of distributive impacts. Two more recycling schemes allow to outline a space for a compromise between the eq-uity and efficiency criteria.
Keywords
Carbon tax, income distribution, equity-efficiency dilemma.
JEL classification codes
H23, Q52.
Introduction
Consistently prescribed as an efficient tool to mitigate climate change (since at least Pearce, 1991), the idea of a carbon tax periodically shows up on public agendas in industrialised countries, to be adopted in some instances (Finland, 1990; Sweden, 1991; Italy and Germany, 1999; Switzerland, 2008),2 but to be rejected more often than not: failures of the French Mission Intermin-istérielle sur l’Effet de Serre (1990), of the carbon-energy tax of the European Union (1992), of the BTU tax of the Clinton Administration (1993), of the ‘ecotax’ of the Jospin government in France again (1998), of the projects in Australia and New Zealand (Baranzini et al., 2000: 396), etc.
These failed attempts doubtlessly have specific historical reasons of their own. Still, they all seem to have faced a similar ‘refusal front’, based on two major arguments: that of competitiveness distortion, and that of a negative impact on the poorer households (Ekins, 1999). However well-grounded these fears, it is surprising to observe that they were systematically used to reject the carbon tax, rather than treated as surmountable obstacles that merely required careful consideration in its implementation.
In the wake of the Grenelle de l’Environnement, a nationwide consulta-tion held over the last quarter of 2007, the carbon tax came back on the French political agenda. However, the volatility of oil prices and the ongoing eco-nomic crisis currently strengthen the threat it seems to pose to the poorer
households, which hinders its political acceptability. This article is conse-quently devoted to the equity argument, with as main objective to avoid that the actual stakes of a carbon tax reform be blurred by the misconception that the agent paying the tax is necessarily the one bearing its ultimate cost. The gap between the direct and the ultimate cost can indeed be substantial, as will be proven in the case of France.
I.
Perceived vs. real impacts: reasons for the
gap
The immediate impact of a carbon tax on the welfare of households3 is obviously linked to the share of their budgets devoted to energy consumption. It is thus intuitively regressive (Parry et al., 2005): the richer households ad-mittedly consume more energy and are bound to pay more carbon tax in abso-lute terms, but the share of energy is larger in the budget of the lower-income households, at least in most OECD countries.4 The welfare of the lower-income households is thus a priori more impacted by both an lower-income effect (lower purchasing power of the disposable income), and the ‘necessity good’ quality of the carbon-intensive energy consumptions (stronger utility loss).
This basic reasoning already appears in early works by Poterba (1991) or Pearson and Smith (1991)—who also stress that the ‘partial equilibrium’ framework implicit behind it has substantial shortcomings: it assumes that en-ergy producers or distributors pass the entire tax burden through to the con-sumers; it considers a fixed level and structure of energy supply and demand, thereby precluding adaptive behaviour; at last, it ignores the propagation of the carbon tax to other goods and services prices through their intermediate energy consumptions, and thus the ultimate effects on the economy and house-hold income. This chain of effects resorts to fiscal incidence, which deals with
3 The following analysis is restrained to the distribution of the economic cost of a carbon tax, i.e. does not extend to the distribution of the induced environmental benefits.
4 Although Bosquet (2000) points to exceptions, and Hassett et al. (2007) show that conclusions differ whether current consumption or current income are used as richness indicator. Pearson and Smith (1991) analyse 6 European countries to find that Ireland only shows a strong correlation between income and energy expenses. Scarcer research on developing countries reveals a loose correlation, if not an inverse relationship (Yusuf and Resosudarmo, 2007).
possible discrepancies between the directly perceived distributive impacts and those ultimately resulting from ‘general equilibrium’ effects.
Partial equilibrium analyses were admittedly extended by allowing for consumption trade-offs through the introduction of price-elasticities differenti-ated by class. It turned out that such adaptive behaviour attenuates the imme-diate direct impact of a tax, but hardly ever reverses its sign (Cornwell and Creedy, 1996; West and Williams, 2004). On the contrary, the use of input-output tables for evaluating the propagation of the tax effect to all prices tends to reinforce the regressive effect (Hamilton and Cameron, 1994; Hassett et al., 2007; Wier et al., 2005). But such computation, however close to the immedi-ate perception of consumers and facilitimmedi-ated by quite simple arithmetic or linear algebra, ultimately reasons in a fictitious world: it assumes constant nominal income, and ignores the use made of the tax revenue, which disappears in some unexplainable potlatch.
Although less intuitive and consequently more contrasted, general equi-librium analyses are also more realistic in that they forbid any form of potlatch and guarantee a sort of ‘mass conservation principle’, through their representa-tion of a balanced accounting framework. This indeed allows to demonstrate the crucial role of the recycling mode in determining the ultimate effect of a carbon tax. Historically general equilibrium analyses of the carbon tax were focussed on the ‘double dividend’ debate, i.e. the question whether the envi-ronmental benefit induced by a carbon tax could be combined to gains in eco-nomic growth and employment. While the abundant literature dedicated to this question is still open to further research,5 it has nevertheless reached a rather consensual set of conclusions:
• Recycling carbon tax revenues in a decrease of a pre-existing distortive tax produces a ‘weak’ double-dividend, i.e. achieves some environ-mental target at a lower welfare cost than a tax whose proceeds are lump-sum recycled—or than other economic instruments as norms, for that matter.6 The more distortive the pre-existing tax, the better. In
5 Bovenberg (1999) provides a synthesis of the theoretical underpinnings. A survey of empirical studies can be found in sections of the second and third Assessment Reports of the Intergovern-mental Panel on Climate Change (IPCC, 1995; IPCC, 2001; IPCC, 2007).
6 Norms create rents benefitting the polluting industries beyond what is legitimated by the cost of their technological restructuring. Besides, the marginal cost of a norm is at least partially
Europe a consensus tends to view decreasing labour taxes (payroll taxes) superior to decreasing other taxes, subsidies, public deficit or debt reduction, etc. (cf. IPCC, 1995, Chapter 8).
• Obtaining a ‘strong’ double dividend, that is recycling the carbon tax proceeds in such a way that the total economic cost of the reform is negative, is far from being automatic. Intuitively, substituting a carbon tax to payroll taxes should indeed favour employment, and hence growth. But taxing carbon means taxing consumption, and taxing con-sumption is equivalent to taxing the income that pays for it. A payroll-tax substituting carbon payroll-tax thus ultimately weighs on labour as a source of income, same as the levy it is replacing (Bovenberg and De Mooij, 1994a, 1994b; Goulder, 1995).7
• The ‘strong’ double dividend potential is less elusive when accounting for the fact, as empirical models do, that the carbon tax burden is not entirely borne by labour or the national productive capital. Indeed it also weighs on non-wage household income (financial and property rents, transfer revenues), as well as on the oil and gas rent of exporting countries (Goulder, 1995; Ligthart, 1998). In total, the levy on national labour is indeed decreased and net gains can occur, all the more so as the labour market is rigid (Carraro and Soubeyran, 1996).
In this perspective, accounting for general equilibrium effects becomes crucial to assess the fate of low-income classes: a carbon tax that reduces in-come inequality can also reduce the latter classes’ welfare if it has a positive total cost; conversely, a carbon tax causing a strong double dividend, i.e. in-ducing negative total costs, can increase income inequality while improving the welfare of the low-income class.
Notwithstanding, general equilibrium literature on the distributive ef-fects of a carbon tax is much less abundant than that on the aggregate double
passed through to intermediate and final consumers, whereas that of a carbon tax can be com-pensated by a recycling in the decrease of other production taxes.
7 Besides, a carbon tax distorts the consumption goods market, thus degrading the utility house-holds derive from their income. In stylized models like that of Bovenberg and De Mooij (op. cit.), where unemployment is voluntary, this discourages labour supply and depresses activity.
dividend, and still less extensive than the partial equilibrium one on the same subject.8 As a matter of fact the past decade has seen less research on the car-bon tax because of the prejudice of a political impairment, despite the ac-knowledged theoretical potential9, and because of the attention gained by the tradable emission permit option, in the wake of the Kyoto Protocol.10 The re-sulting weakness in the state-of-the-art requires the economist to be modest on the numerical results, but should not prevent him from delivering insights on the robust mechanisms determining the ultimate consequences of alternative carbon tax reforms.
The following two sections thus shed light on how the perceived impact of a carbon tax changes with the level of analysis. They envisage the imple-mentation of a tax up to €200 per tonne of CO2 (hereafter /tCO2)11 in 2004
France, whose household agent is divided into 20 income classes on the basis of an INSEE Budget des Familles survey covering the years 2000-2001.12 The welfare index used to measure class impacts is the change in real consumption, i.e. the sum of a class’s consumption expenses deflated by its specific Fisher price index.13 For the sake of clarity results are reported aggregated into 5 household classes, of the 5% ‘poorest’, the 30% ‘modest’, the 30% ‘median’, the 30% ‘rich’ and the 5% ‘richest’ households.
8 Let us still quote Proost and Van Regemorter (1995) on Belgium, and Yusuf and Resosudarmo (2007) on Indonesia.
9 See the recent Harvard Project on International Climate Change Agreement (Aldy and Stavins, 2008). The body of the report stresses the advantages of coordinated national taxes; but these are barred from the summary because their adoption is seen as “politically unlikely”.
10 This rests on a wrong interpretation of the Protocol, which indeed creates a permit market between States, but leaves to each State the choice of which domestic instruments to implement. A State could couple a fiscal reform with programs on buildings and transport, to become a per-mit seller on international markets without having created a domestic perper-mit market.
11
Which ex ante increases the average price of gasoline by 54%, and that of residential energy by 38%. Although the fossil fuels of residential use are much less taxed that gasoline the heavy share of electricity in residential consumption accounts for the lower strength of the signal. 12 Following INSEE “income” is defined as total household income over household number of consumption units (CU), with CU measured following a modified OECD scale: 1 CU for the first adult, 0.5 CU for any other person above 14 and 0.3 CU per children below 14.
13 Consumption is preferred to total income to ease the comparison between partial and total equilibrium. In general equilibrium the class-specific propensities to consume have limited variations that are correlated enough to guarantee that comparing the classes’ variations of real consumption is very similar to comparing their total income variations.
II. Lessons from partial equilibrium analysis
II.1.
Direct impacts with constant energy
con-sumptions
Let us first consider the impact of a carbon tax as spontaneously per-ceived at the time of its implementation, that is notwithstanding changes in the energy consumptions and their carbon intensities, in the relative prices net of the new tax, in nominal incomes or indeed in the consumption-savings trade-off. Facing such constraints households can adjust their non-energy consump-tions only. This provides a first order approximation of the tax effects.14
-6% -3% id. +3% +6% +9% 40 80 120 160 200
Tax, 2004 euros per tonne CO2
R e a l c o n s u m p ti o n ( c la s s t o ta l)
5% poorest 30% modest 30% median 30% rich 5% richest
Figure 1 Distributive effects,
partial equilibrium with constant energy consumptions
14 The first order monetary measurement of the welfare variation (compensating variation) is the cost increase of the initial good and services consumed. This approximation is only valid for marginal price variations (Bourguignon and Spadaro 2006).
Unsurprisingly, from such an angle the carbon tax appears regressive whatever its level (Figure 1). Indeed, poorest, modest and median households alike consistently lose a share of their real consumption roughly one and a half times that lost by the richest households, for the simple reason that their en-ergy budget share is respectively 38%, 36% and 33% higher—the higher rate of motorisation of the median and modest classes explains why their loss is closely comparable to that of the poorest class, despite lower budget shares.
II.2.
Impacts after adaptation to the new relative
prices
Turning to the ability of households to adapt to the new set of relative prices implies facing three difficulties related to estimating energy price elas-ticities:
• The questions raised by time series econometrics in energy matters: (i) the difference between short- and long-term elasticities, and the irre-versibility or asymmetry effects of a price increase vs. a price decrease (Gately, 1992; Peltzman, 2000); (ii) the erratic nature of energy prices since the first oil shock in 1973, that make them ill-suited to provide es-timates for stable policy-related price-signals; (iii) the questionable use of a general consumer price index to deflate current energy prices, con-sidering the dominant role of a certain set of prices (e.g. that of house rental services) in the shaping of mobility demand.
• The lack of panel data over both a period long enough and sufficiently disaggregated households to grasp the long-term heterogeneity of households’ behaviour—acknowledging that the ability of households to adapt depends on, beyond their income level, parameters as diverse as the degree of urban sprawl, the share of rurality, or the equipment in in-frastructures.
• The impossibility to reason with constant elasticities over the large spectrum of taxes tested in this paper, be it only because of the exis-tence of basic needs and technical asymptotes to energy efficiency at any given temporal horizon.
For lack of a better solution, we derived own-price, cross-price and in-come elasticities that are, for each household class:
• Based on an Almost Ideal Demand System (Deaton and Muellbauer, 1980) estimated on long-term time series (INSEE, 2007);15
• Decreasing with the tax level, in order to have consumption tend to-wards an asymptotic value meant as an incompressible basic need.16 En-ergy asymptotic values are assumed identical for all classes and set at 80% of the lowest consumption per capita.
Taking account of these elasticities and asymptotes produces impact es-timates that can be interpreted as those of a carbon tax having had sufficient time before 2004 to deploy its adaptation effects. These estimates seem very close to those obtained without adaptive behaviour (compare Figure 2 to Fig-ure 1): for all household classes consumption flexibility only slightly allevi-ates the tax burden, and the regressive effect is hardly changed.17
15
Elasticities for automotive fuel (-50% on average, standard deviation across classes of 7%) and for residential energy (-11% on average, standard deviation of 12% across classes) are com-parable to values found in the existing literature (Graham and Glaister, 2002).
16 The reasons for this modelling choice are discussed in a special issue of The Energy Journal dedicated to hybrid modelling (Hourcade et al., 2006 ; Ghersi and Hourcade, 2006).
17 Part of this lack of sensitivity is explained by the use of real consumption as indicator. Real consumption cannot capture ‘basket composition’ effects that would certainly show if some utility function could have been properly calibrated. Indeed, detailed modelling results reveal consumption decreases of up to 21% for automotive fuel, 5% for residential energy (for a €200/tCO2 tax).
-6% -3% id. +3% +6% +9% 40 80 120 160 200
Tax, 2004 euros per tonne CO2
R e a l c o n s u m p ti o n ( c la s s t o ta l)
5% poorest 30% modest 30% median 30% rich 5% richest
Figure 2 Distributive effects,
partial equilibrium with adaptive energy consumptions
II.3.
Introducing a ‘mass conservation’ principle
Before turning to the more complex general equilibrium effects, the par-tial equilibrium analysis can be further refined by the introduction of a simple ‘mass conservation’ principle, with the aim of correcting the ‘potlatch’ disap-pearance of carbon tax revenues. Let us assume that this revenue is redistrib-uted to households as a fixed amount per consumption unit (CU, cf. footnote 12). This recycling rule, through which a substantial share of carbon tax pay-ments of the higher classes is redistributed to the poorer, results in a dramati-cally different distribution impact: whatever the tax level the reform turns out progressive (Figure 3).
That an obviously highly egalitarian recycling rule should lead to a pro-gressive impact might appear tautological. This step is simply meant as a demonstration that, beyond the direct regressive effect of the carbon tax, the recycling mode of its fiscal product induces another distributive effect that is potentially strongly progressive.
-6% -3% id. +3% +6% +9% 40 80 120 160 200
Tax, 2004 euros per tonne CO2
R e a l c o n s u m p ti o n ( c la s s t o ta l)
5% poorest 30% modest 30% median 30% rich 5% richest
Figure 3 Distributive effects, partial equilibrium with adaptive energy consumptions and fixed per-CU recycling
In this context it is commonly recognised a good practice to analyse the ‘pure’ effect of taxation by simulating lump-sum recycling, i.e. that each agent or aggregate thereof gets its carbon tax payments refunded. Lump-sum recy-cling provides indeed a useful framework in which to compare the efficiency of diverse recycling options. But this does not mean that it is the only legiti-mate assumption to be made when assessing a double dividend potential, as is sometimes argued under the pretence that any other recycling option could be organised as an independent set of transfers between agents. It indeed remains that, if a carbon tax were levied, it would be desirable to explore the best pos-sible recycling option. That best pospos-sible recycling option is as much part of the carbon tax reform as the tax itself.
Introducing a ‘mass conservation principle’ thus forces to jointly ana-lyse the tax and its recycling, which is proven to loosen the mechanical link between the carbon tax and the regressive effect. Then general equilibrium modelling is required to grasp the simultaneous adaptation of agents to the diverse forms such general reorganisations of the fiscal structure can take.
III. Ultimate distributive impacts: general
equi-librium analyses
The analysis below is based on comparative static modelling conducted with the IMACLIM-S computable general equilibrium model. The version used is an open-economy one distinguishing 4 productions: 3 energy goods and a composite remainder; it is enhanced from previous versions by the dis-aggregation of 20 income classes, endowed with the same adaptation capabili-ties as those used in partial equilibrium, and by a detailed description of the distribution of the national income among the 20 classes, firms, public admini-strations and the rest of the world. The resulting financial positions are bal-anced by agent-specific interest rates on a financial market, and debt services duly represented.18
Our purpose being to demonstrate the importance of the tax-recycling option, we choose to base our simulations on a given set of macro-economic behavioural assumptions: identical decreasing relation between propensity to consume and income; fixed investment-disposable income ratio; identical technical asymptotes and basic needs; fixed international prices; etc. Two sets of assumptions are crucial enough to deserve more exposition.
A first set regards public administrations. On the one hand, we assume a strict ‘euro for a euro’ budget neutrality of the carbon tax: whatever its use the amount recycled is strictly identical to the amount levied, to the euro.19 On the other hand real we consider constant public expenses (public consumption, public investment, per capita transfers) and a fixed ratio of public debt to GDP as well. Eliminating the latter two adjustment variables facilitates the compari-son of different options. It also triggers either a vicious or a virtuous circle, as
18 Ghersi (2009) presents a ‘core’ version of the model limited to one global region and 2 pro-ductions. Ghersi et al. (2009) propose a detailed description of the 2.3 version, only marginally different from version 2.1 applied to this research. Ghersi and Hourcade (2006) develop the particular stance regarding the producers’ behaviour.
19 In the quite detailed framework of IMACLIM-S there are many possible interpretations of the budget neutrality hypothesis (constant fiscal pressure, constant absolute deficit, constant ratio of deficit to GDP, etc.), all of which have specific macro-economic impacts. We opt for a definition that is arguably the most tangible, and also echoes the ‘mass conservation principle’ explored in partial equilibrium (cf. supra).
it implies the need to raise or lower other taxes20, depending on whether the variations of the fiscal bases compensate the direct losses of the interior tax on petroleum products (hereafter TIPP according to the French acronym) caused by the drop in automotive fuel consumption.21
A second set of assumptions relates to the labour market and its degree of imperfection. First, to represent structural situations of unemployment and limited wage flexibility, we adopt a wage curve (Blanchflower and Oswald, 2005) that correlates the average wage relative to foreign prices to the unem-ployment rate. The choice of correlating the wage relative to foreign prices rather than the real wage (i.e. the wage relative to some domestic consumer price index) is made to reflect competitiveness constraints specific to the French-European Union context. It forces a wage moderation that sets limits on the energy price propagation effects and amplifies a trade-off in favour of labour, but simultaneously allows for higher real wage losses. Second, aggre-gate employment impacts are assumed to affect classes proportionally to their initial number of unemployed—which makes classes all the more sensitive to employment variations as they are poor. This simplifying assumption is adopted for lack of information and should be revised in future research.
The resulting modelling framework is calibrated on 2004 France and applied to simulate 5 reforms (Table 1):
• The R1 reform consists in taxing carbon emissions from the households, then refunding them the entire tax product as a fixed amount per CU—a reform identical to the one assessed with the introduction of a ‘mass conservation’ principle above.
• The R2 reform enlarges the carbon tax base of R1 to carbon emissions from the firms.
• The R3 reform covers emissions as R2 but recycles the tax proceeds in a decrease of payroll taxes.
• R3ND and R4 reforms, are two variants that impose a neutralisation of
the distributive impacts.
20 The required shift is modelled as an identical scalar applied to all tax rates and excise taxes represented (including the payroll taxes in the case when they benefit from the euro for a euro recycling).
Reform Carbon tax on Revenue recycled Distributive impacts neutralised R1 Household emissions To households, fixed per CU amount
No R2 All emissions To households,
fixed per CU amount
No R3 All emissions In a decrease
of payroll taxes
No R3ND All emissions In a decrease
of payroll taxes
Through a zero-sum transfer among income classes
R4 All emissions To households, their ag-gregate tax payment; In a decrease of payroll taxes, the remainder.
Through an adjustment of the amount re-funded to each class
Table 1 Five alternative reforms for a carbon tax
III.1. Recycling modes and activity levels: towards
an equity-efficiency dilemma?
By nature, shifting to a general equilibrium framework multiplies the criteria for comparing different policies. Focussing on the reforms R1 to R3 to begin with, we will start by delineating their aggregate economic impact, and then examine how this aggregate impact is distributed among household classes.
R1 has a decreasing effect on GDP (Table 2), fundamentally consistent with the theoretical analysis stressing that taxing one good is less efficient than putting the same burden on total income—because of the Slutsky substi-tution effect. In our simulation this effect is not compensated by the mild growth stemming from a redistribution in favour of the poorer classes and their higher propensity to consume, notably because our budget neutrality con-straint implies increases of the pre-existing taxes. The net effect on employ-ment is nonetheless mildly positive (+0,15% for a tax level of €200/tCO2),
thanks to a shift in demand towards labour-intensive rather than energy-intensive goods.
21 The VAT on automotive fuel does not constitute such losses as the VAT is similarly levied on any consumption that is substituted to them (even if in some instances at a reduced rate).
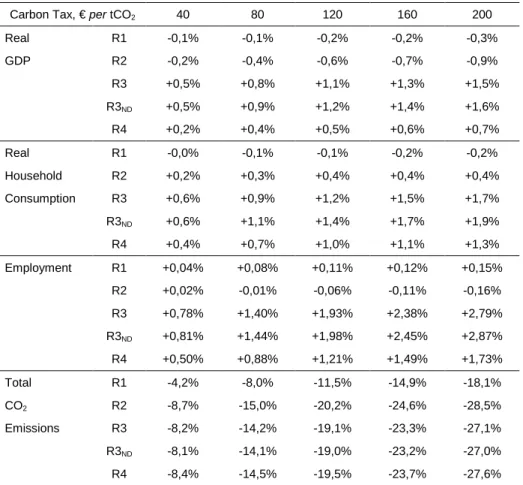
Carbon Tax, € per tCO2 40 80 120 160 200 Real R1 -0,1% -0,1% -0,2% -0,2% -0,3% GDP R2 -0,2% -0,4% -0,6% -0,7% -0,9% R3 +0,5% +0,8% +1,1% +1,3% +1,5% R3ND +0,5% +0,9% +1,2% +1,4% +1,6% R4 +0,2% +0,4% +0,5% +0,6% +0,7% Real R1 -0,0% -0,1% -0,1% -0,2% -0,2% Household R2 +0,2% +0,3% +0,4% +0,4% +0,4% Consumption R3 +0,6% +0,9% +1,2% +1,5% +1,7% R3ND +0,6% +1,1% +1,4% +1,7% +1,9% R4 +0,4% +0,7% +1,0% +1,1% +1,3% Employment R1 +0,04% +0,08% +0,11% +0,12% +0,15% R2 +0,02% -0,01% -0,06% -0,11% -0,16% R3 +0,78% +1,40% +1,93% +2,38% +2,79% R3ND +0,81% +1,44% +1,98% +2,45% +2,87% R4 +0,50% +0,88% +1,21% +1,49% +1,73% Total R1 -4,2% -8,0% -11,5% -14,9% -18,1% CO2 R2 -8,7% -15,0% -20,2% -24,6% -28,5% Emissions R3 -8,2% -14,2% -19,1% -23,3% -27,1% R3ND -8,1% -14,1% -19,0% -23,2% -27,0% R4 -8,4% -14,5% -19,5% -23,7% -27,6% N.B.: The variations prevail at the end of a post-reform adjustment process. If 20 years are required for energy mutations and
macro-economic adjustments, then the 2.4% GDP gap between R2 and R3 is equivalent to a 0.12% variation of the average annual growth rate over the period.
Table 2 General equilibrium aggregate impacts
R2, by extending the tax base to emissions from firms, increases the GDP losses. This is again consistent with theoretical results (Bovenberg and Goulder 1996): the tax on intermediate inputs propagates to other goods and services, which leads to a reinforcement of the deadweight loss caused by the Slutsky substitution effect. In addition, the resulting general price increase hurts competitiveness, which contracts economic activity, which in turn forces public administrations to increase other tax rates—and starts a vicious circle.
In the light of such GDP losses the consumption gains of R2 might seem paradoxical. They are permitted by a significant redistribution of na-tional income in favour of households due to (i) the indexation of social
trans-fers on prices; (ii) the payment to households of all carbon tax proceeds in-cluding those whose burden is ultimately borne by other agents.
The comparative results of R3 are themselves in line with the literature on second best economies:22 using the carbon tax proceeds to lower payroll taxes increases the activity level. At €200/tCO2 GDP increases by 1.5%,
em-ployment by 2.8%, and carbon emissions drop by 27%. On the latter environ-mental achievement it is interesting to note the hardly perceivable influence of the recycling mode; this indicates dominance of the direct impact of the tax on relative prices over any indirect effect, including the variations in activity.23
-6% -3% id. +3% +6% +9% 40 80 120 160 200
Tax, 2004 euros per tonne CO2
R e a l c o n s u m p ti o n ( c la s s t o ta l)
5% poorest 30% modest 30% median 30% rich 5% richest
Figure 4 General equilibrium distributive impact, reform R1
Let us now analyse how these impacts affect the different classes. Un-surprisingly R1, which strictly reproduces the ‘constant mass’ partial equilib-rium variant (cf. section II.3), shows a comparable distributive impact (com-pare Figures 3 and 4). However, general equilibrium mechanisms
22 Cf. the surveys provided by the relevant sections of the successive IPCC (1995, 2001, 2007). The results are also in line with previous modelling analyses by IMACLIM-S (Hourcade and Ghersi, 2000; Ghersi et al., 2001).
cally decrease the welfare of the three richest classes, whereas they increase that of the poorest classes up to €120/tCO2. The reason for this difference in
sensitivity lies in heterogeneous income structures and labour market situa-tions. The poorest and modest classes indeed have high proportions of their income (resp. 51% and 46%) guaranteed in real terms in the form of price-indexed social transfers. Besides, thanks to high unemployment rates (resp. 42% and 22%) they benefit relatively more from a mild labour creation effect (+0.15% for €120/tCO2). For the lower tax levels, these two benefits
compen-sate the erosion of purchasing power caused by the increased fiscal pressure necessary to maintain public expenses and debt in a context of lower growth, which adds up to the direct energy price increase. By contrast the higher in-come classes face an inin-come loss strongly correlated to the GDP decrease; this loss cannot be compensated by gains on the labour market that are limited by much lower unemployment levels.24
-6% -3% id. +3% +6% +9% 40 80 120 160 200
Tax, 2004 euros per tonne CO2
R e a l c o n s u m p ti o n ( c la s s t o ta l)
5% poorest 30% modest 30% median 30% rich 5% richest
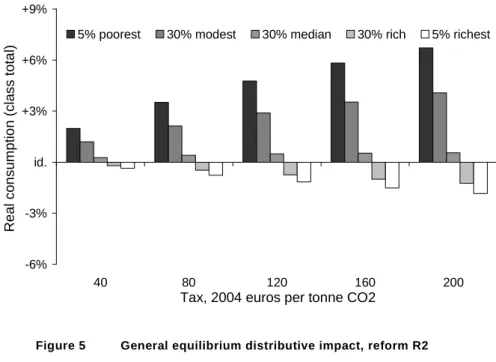
Figure 5 General equilibrium distributive impact, reform R2
24 This holds even though the gap between unemployment benefits and the average wage, i.e. the gain from employment creation, is strongly increasing with income.
The distributive impact of R2 (Figure 5) is profiled as that of R1, but much more contrasted. This directly results from the multiplication by 2.5 of the tax proceeds, and their highly progressive recycling rule. The poorest households are strongly advantaged: at €200/tCO2 their yearly tax payments
amount to €500, but the generalised per-CU recycling rule hands them back €2 131; the €1 631 balance amounts to 8% of their consumption expenditures. The higher the income class, the smaller this balance compared to the revenue losses caused by macro-economic adjustments. It is still high enough to allow the median class to turn its R1 loss into a gain, but not so for the higher classes: at €200/tCO2 the highest class benefits from a €916 balance that
amounts to a modest 1.3% of its consumption expenditures, and cannot com-pensate a marked decline in activity income (wages and rents).
-6% -3% id. +3% +6% +9% 40 80 120 160 200
Tax, 2004 euros per tonne CO2
R e a l c o n s u m p ti o n ( c la s s t o ta l)
5% poorest 30% modest 30% median 30% rich 5% richest
Figure 6 General equilibrium distributive impact, reform R3
R3 results are quite different from those of R1 and R2: although R3 in-creases both the aggregate income and total household consumption (Table 2), it widens the gap between income classes. At €200/tCO2 the real consumption
increase of the richest class is ca. six times larger than that of the poorest (Figure 6). The lower income households are indeed compensated from the carbon tax burden through employment creation only, and lose the benefit of
the direct redistribution scheme. Besides, the social transfers that guarantee them against GDP losses also limit their ability to benefit from GDP gains. By contrast the richer classes, less sensitive to higher energy prices, capture a greater share of the increased growth thanks to income sources that are more correlated to general activity.
In total, the comparison between R1, R2 and R3 ultimately leads to an equity-efficiency dilemma. R1 and R2, through the choice of a direct redistri-bution of the carbon tax proceeds to households, overturn the distributive im-pacts of the tax, but do so at the cost of GDP and either aggregate consump-tion or employment losses. Conversely, R3 simultaneously improves GDP, employment and aggregate consumption, but does so by renouncing to a direct action on income distribution, and consequently leads to an inequitable distri-bution of the fruits of the growth it triggers.
III.2. Options for a compromise
The relative performance of R3 arguably encourages to derive variants of this reform that, while conserving its aggregate efficiency, might fare better in terms of equity. The spectrum of possible variants is quite large, and it is obviously beyond the scope of this paper to try to cover it. R3ND and R4 are
merely selected to illustrate how the ultimate consequences of a carbon tax hang on the political compromises expressed in its recycling rule.
-6% -3% id. +3% +6% +9% 40 80 120 160 200
Tax, 2004 euros per tonne CO2
R e a l c o n s u m p ti o n ( c la s s t o ta l)
5% poorest 30% modest 30% median 30% rich 5% richest
Figure 7 General equilibrium distributive impact, reform R3ND
The R3ND variant combines R3 assumptions with a zero-sum transfer
among household classes that aims at equalising their real consumption varia-tions (Figure 7) 25. Its aggregate impacts are very close to those of R3 in both environmental and macro-economic terms (Table 2).26 Such a quasi separabil-ity of efficiency and equseparabil-ity indicates that the behaviour of income classes is not heterogeneous enough to substantially modify the carbon tax impact on the productive system, aggregate consumption and emissions. However, any opti-mistic inference on a possible conciliation of both criteria must be qualified by a caveat concerning political acceptability: R3ND submits the richer classes to
a double levy (levy to compensate the poorer households on top of the carbon tax) that could only be justified under a general political compromise to de-crease inequalities.
25 This indicator, obviously not the most appropriate equity criterion, is merely retained for its legibility in the format used to present distributive results. Any more appropriate criterion could be targeted to shape the distributive compensations of R3ND and R4 without substantially chang-ing aggregate results—as hinted by the very similar macroeconomic outcomes of R3 and R3ND. 26 The mild macro-economic advantage of R3ND over R3 is caused by the higher propensity to consume of lower income classes, who benefit from the transfers at the expense of the richer classes.
-6% -3% id. +3% +6% +9% 40 80 120 160 200
Tax, 2004 euros per tonne CO2
R e a l c o n s u m p ti o n ( c la s s t o ta l)
5% poorest 30% modest 30% median 30% rich 5% richest
Figure 8 General equilibrium distributive impact, reform R4
The R4 variant, at last, anticipates any argument about the burden shar-ing between households and firms by optshar-ing for a scheme that redistributes their own tax payments to the former, and uses the tax payments of the latter to decrease payroll taxes.27 The share of the proceeds redistributed to house-holds then allows to control the distributive effect in a manner similar to that of R3ND (Figure 8). The macroeconomic and distributive impacts of R4 turn
out to fall between those of R2 on one side, and R3 on the other side. By con-trast to R2 GDP increases, as production costs benefit from the recycling of the tax proceeds levied on intermediate consumption; this generates consump-tion gains that, by contrast to R3, are distributed in a controlled manner.
27 This dual recycling has been prevailing in Switzerland since January 2008: tax proceeds levied on intermediate consumption are redistributed to firms on the basis of their labour costs; those levied on final consumption are redistributed to households through a rebate on their public health insurance cost.
Conclusion
The contrasted impacts of a carbon tax on different household classes ultimately result from the interaction of three effects: (i) the sheer weight of the tax payments, strongly determined by the budget share of energy expenses and hence rather regressive; (ii) the distribution of the macroeconomic conse-quences of the tax (themselves strongly sensitive to the recycling of its pro-ceeds), which hangs both on the specific position of each class on the labour market (rate of unemployment, wedge between wage and unemployment bene-fits) and on its income structure (share of revenue only remotely connected to variations in general activity—transfer payments); (iii) potential direct redis-tribution schemes of part or of all the tax proceeds to households, which offer a powerful leverage to overturn the first two effects.
Contrary to a misconception inherited from partial equilibrium analyses, there is thus no mechanical link between a carbon tax and its ultimate distribu-tive effects. The implementation of a carbon tax invites indeed to a political trade-off through the choice of a recycling rule. A direct redistribution of the tax proceeds to households can be used to favour the poorest household classes, but at a macroeconomic cost in terms of both GDP and either aggre-gate consumption or employment. Conversely, a recycling of all tax proceeds in lower payroll taxes results in higher GDP, consumption and employment, but at the cost of a widening of the gap between the lower and the higher reve-nue classes—although it manages to increase the consumption of all classes. A mix recycling scheme, which devotes the tax levied on firms to payroll tax rebates, and that levied on household to the financing of redistributive trans-fers, is proven to provide a compromise between the two polar options: it al-lows to achieve both an improvement of all macroeconomic indicators, and a control of the distributive impacts of the reform.
References
Aldy, J. E. and Stavins, R. N. (2008). Designing the Post-Kyoto Climate Regime: Lessons from the Harvard Project on International Climate Agree-ments. Report for Harvard Project on International Climate Agreements, Belfer Center for Science and International Affairs. Cambridge, MA: Harvard
Ken-nedy School.
http://belfercenter.ksg.harvard.edu/publication/18686/designing_the_postkyoto _climate_regime.html Accessed 09 July 2009.
Baranzini, A., Goldemberg, J. and Speck, S. (2000). A Future for Car-bon Taxes. Ecological Economics, 32(3), 395-412.
Blanchflower, D. G. and Oswald, A. J. (2005). The Wage Curve Re-loaded. Working Paper 11338. National Bureau of Economic Research. http://www.nber.org/papers/w11338 Accessed 09 July 2009.
Bosquet, B. (2000). Environmental Tax Reform: Does it Work? A Sur-vey of the Empirical Evidence. Ecological Economics, 34(1), 19-32.
Bourguignon, F. J. and Spadaro, A. (2006). Microsimulation as a Tool for Evaluating Redistribution Policies. Journal of Economic Inequality, 4(1), 77-106.
Bovenberg, A. L. (1999). Green Tax Reform and the Double Dividend: An Updated Reader's Guide. International Tax and Public Finance, 6(3), 421-443.
Bovenberg, A. L. and De Mooij, R. A. (1994a). Environmental Levies and Distortionary Taxation. American Economic Review, 84(4), 1085-1089.
Bovenberg, A. L. and De Mooij R. A. (1994b). Environmental Taxes and Labor-Market Distortions. European Journal of Political Economy, 10(4), 655-683.
Bovenberg, A. L. and Goulder, L. H. (1996). Optimal Environmental Taxation in the Presence of Other Taxes: General Equilibrium Analyses. American Economic Review, 86(4), 985-1000.
Carraro, C. and Soubeyran, A. (1996). Environmental Taxation and Employment in a Multi-Sector General Equilibrium Model. In Carraro, C. and Siniscalco, D. (Eds.) Environmental Fiscal Reform and Unemployment (pp. 73-93). The Hague: Kluwer Academic Publishers.
Cornwell, A. and Creedy, J. (1996). Carbon Taxes, Prices and Inequal-ity in Australia. Fiscal Studies, 17(3), 21-38.
Deaton, A. S. and Muellbauer, J. (1980). An Almost Ideal Demand Sys-tem. American Economic Review, 70(3), 312-326.
Ekins, P. (1999). European Environmental Taxes and Charges: Recent Experience, Issues and Trends. Ecological Economics, 31(1), 39-62.
Gately, D. (1992). Imperfect Price-Reversibility of Oil Demand: Asymmetric Responses of US Gasoline Consumption to Price Increases and Declines. The Energy Journal, 13(4), 179-207.
Graham, D. J. and Glaister, S. (2002). The Demand for Automobile Fuel: a Survey of Elasticities. Journal of Transport Economics and Policy, 36(1), 1-25.
Goulder, L. H. (1995). Environmental Taxation and the ‘Double Divi-dend’: A Reader's Guide. International Tax and Public Finance, 2(2): 157-183.
Ghersi, F. (2009). Impact Assessments of Climate Policies: IMACLIM-S. In Gerlagh, R., Bosetti, V. and Schleicher, IMACLIM-S. (Eds.), Modeling Sustainable Development (pp. 170-181). Cheltenham: Edward Elgar.
Ghersi, F. and Hourcade, J.-C. (2006). Macroeconomic Consistency Is-sues in E3 Modelling: the Continued Fable of the Elephant and the Rabbit. The Energy Journal, Special Issue 2, 27-49.
Ghersi, F., Hourcade, J.-C. and Quirion, P. (2001). Marché International du Carbone et Double Dividende : Antinomie ou Synergie ? Revue Française d’Économie, 16(2), 149-177.
Ghersi, F. and Thubin, C. (2009). The IMACLIM-S Model Version 2.3. Working Paper. Centre International de Recherche sur l’Environnement et le Développement.
http://www.imaclim.centre-cired.fr/spip.php?article162andlang=en Accessed 09 July 2009.
Hamilton, K. and Cameron, G. (1994). Simulating the Distributional Ef-fects of a Canadian Carbon Tax. Canadian Public Policy, 20(4), 385-399.
Hassett, K. A., Mathur, A. and Metcalf, G. E. (2007). The Incidence of a U.S. Carbon Tax: A Lifetime and Regional Analysis. Working Paper 13554. National Bureau of Economic Research.
Hourcade, J.-C. and Ghersi, F. (2000). Le Rôle du Changement Tech-nique dans le Double Dividende d’Écotaxes. Économie et Prévision, 143-144, 47-68.
Hourcade, J.-C., Jaccard, M., Bataille, C. and Ghersi, F. (2006). Hybrid Modeling: New Answers to Old Challenges. The Energy Journal, Special Issue 2, 1-11.
INSEE (2007). Consommation effective des ménages par produits. Les comptes de la Nation en 2007 - Base 2000. Institut National de la Statistique et des Études Économiques.
http://www.insee.fr/fr/themes/comptes-nationaux/souschapitre.asp?id=73 Ac-cessed 09 July 2009.
IPCC (1995). Climate Change 1995: Economic and Social Dimensions of Climate Change. Bruce, J. P., Lee, H. and Haites, E. F. (Eds.). Contribution of Working Group III to the Second Assessment Report of the Intergovern-mental Panel on Climate Change (IPCC). Cambridge, U.K.: Cambridge Uni-versity Press.
IPCC (2001). Climate Change 2001: Mitigation. Metz, B., Davidson, O., Swart, R. and Pan, J. (Eds.). Contribution of Working Group III to the Third Assessment Report of the Intergovernmental Panel on Climate Change (IPCC). Cambridge, U.K.: Cambridge University Press.
IPCC (2007). Climate Change 2007: Mitigation. Metz, B., Davidson, O., Bosch, P., Dave, R. and Meyer, L. (Eds.). Contribution of Working Group III to the Fourth Assessment Report of the Intergovernmental Panel on Climate Change (IPCC). Cambridge, U.K.: Cambridge University Press.
Ligthart, J. E. (1998). The Macroeconomic Effects of Environmental Taxes - A Closer Look at the Feasibility of ‘Win-Win’ Outcomes. Working Paper 98/75. International Monetary Fund.
Parry, I. W. H., Sigman, H., Walls, M. and Williams III, R. C. (2005). The Incidence of Pollution Control Policies. Discussion Paper 05-24. Re-sources For the Future.
http://www.rff.org/Documents/RFF-DP-05-24.pdf Accessed 09 July 2009. Pearce, D. W. (1991). The Role of Carbon Taxes in Adjusting to Global Warming. The Economic Journal 101(407): 938-948.
Pearson, M. and Smith, S. (1991). The European Carbon Tax: an As-sessment of the European Commission Proposal. Conference Papers. Institute for Fiscal Studies, London.
Peltzman, S. (2000). Prices Rise Faster than They Fall. Journal of Po-litical Economy, 108(3): 466-502.
Poterba, J. M. (1991). Is the Gasoline Tax Regressive? In D. Bradford (Ed.), Tax Policy and the Economy (pp. 145-164). Cambridge, MA: MIT Press.
Proost, S. and Van Regemorter, D. (1995). The Double Dividend and the Role of Inequality Aversion and Macroeconomic Regimes. International Tax and Public Finance, 2(2), 207-219.
West, S. E. and Williams III, R. C. (2004). Estimates from a Consumer Demand System: Implications for the Incidence of Environmental Taxes. Journal of Environmental Economics and Management, 47(3), 535-558.
Wier, M., Birr-Pedersen, K., Jacobsen, H.K. and Klok, J. (2005). Are CO2 Taxes Regressive? Evidence from the Danish Experience. Ecological
Economics, 52(2), 239-251.
Yusuf, A. A. and Resosudarmo, B. (2007). On the Distributional Effect of Carbon Tax in Developing Countries: The Case of Indonesia. Working pa-per 200705. Padjadjaran University, Bandung.