Contents lists available atScienceDirect
Int J Appl Earth Obs Geoinformation
journal homepage:www.elsevier.com/locate/jagLarge scale operational soil moisture mapping from passive MW radiometry:
SMOS product evaluation in Europe & USA
Khidir Abdalla Kwal Deng
a,b, Salim Lamine
c, Andrew Pavlides
d, George P. Petropoulos
d,e,⁎,
Yansong Bao
a,b, Prashant K. Srivastava
f, Yuanhong Guan
gaCollaborative Innovation Center on Forecast and Evaluation of Meteorological Disasters, Nanjing University of Information Science & Technology, Nanjing, 210044,
China
bSchool of Atmospheric Physics, Nanjing University of Information Science and Technology, Nanjing, 210044, China cFaculty of Natural Sciences, Life and Earth Sciences, University Akli Mohand Oulhadj of Bouira, 10000, Bouira, Algeria dSchool of Mineral & Resources Engineering, Technical University of Crete, Crete, Greece
eDepartment of Soil & Water Resources, Institute of Industrial & Forage Crops, Hellenic Agricultural Organization“Demeter”, Larisa, Greece fInstitute of Environment and Sustainable Development, Banaras Hindu University, India
gSchool of Mathematics and Statistics, Nanjing University of Information Science and Technology, Nanjing, 210044, China
A R T I C L E I N F O
Keywords: Surface soil moisture Earth observation Operational products SMOS
Validation
A B S T R A C T
Earth Observation (EO) allows deriving from a range of sensors, often globally, operational estimates of surface soil moisture (SSM) at range of spatiotemporal resolutions. Yet, an evaluation of the accuracy of those products in a variety of environmental conditions has been often limited. In this study, the accuracy of the SMOS SSM global operational product across 2 continents (USA, and Europe) and a range of land use/cover types is in-vestigated. SMOS predictions were compared against near concurrent in-situ SSM measurements from the FLUXNET observational network. In total, 7 experimental sites were used to assess the accuracy of SMOS derived soil moisture for 2 complete years of observations (2010–2011). The accuracy of the SMOS SSM product is investigated in different seasons for the seasonal cycle as well as different continents and land use/cover types. Results showed a generally reasonable agreement between the SMOS product and the in-situ soil moisture measurements in the 0–5 cm soil moisture layer. Root Mean Square Error (RMSE) in most cases was close to 0.1 m3m−3(minimum 0.067 m3m−3). With a few exceptions, Pearson’s correlation coefficient was found up to
approx. 55%. Grassland, shrublands and woody savanna land cover types attained a satisfactory agreement between satellite derived and in-situ measurements but needleleaf forests had lower correlation. Better agree-ment was found for the grassland sites in both continents. Seasonally, summer and autumn underperformed spring and winter. Our study results provide supportive evidence of the potential value of this operational product for meso-scale studies in a range of practical applications, helping to address key challenges present nowadays linked to food and water security.
1. Introduction
Soil moisture corresponds to water in both the uppermost layer of the land surface– called Surface Soil Moisture (SSM) – and the root zone or vadose area. This parameter is strongly affected by many factors such as soil texture, organic materials, and topography as well as land use/land cover and rainfall (Srivastava et al., 2016a; Raffelli et al., 2017) Soil moisture, particularly SSM plays a significant role in the distribution of the mass and energyfluxes between the land and the atmosphere, and it controls the different components of the water and
energy balance (Seneviratne et al., 2010;Bao et al., 2018). Further-more, it is a key state variable in organizing the natural ecosystems and biodiversity (Vereecken et al., 2008; Carlson and Petropoulos, (in press)), also important to modeling extreme events such asflooding or landslides prediction (Bittelli et al., 2012; Wanders et al., 2014), drought monitoring (Sánchez-Ruiz et al., 2014), and numerical weather prediction (DeRosnay et al., 2013). Considering many aspects in life such as food security and water resources management, it is essential for agriculture and irrigation management practices. Particularly, in developing irrigation management practices for more crop production
https://doi.org/10.1016/j.jag.2019.04.015
Received 12 February 2019; Received in revised form 21 April 2019; Accepted 23 April 2019
⁎Corresponding author at: School of Mineral & Resources Engineering, Technical University of Crete, Chania, Greece.
E-mail addresses:[email protected](K.A.K. Deng),[email protected](S. Lamine),[email protected](A. Pavlides),
[email protected](G.P. Petropoulos),[email protected](Y. Bao),[email protected](P.K. Srivastava),[email protected](Y. Guan). Int J Appl Earth Obs Geoinformation 80 (2019) 206–217
0303-2434/ © 2019 Elsevier B.V. All rights reserved.
and optimum use of water resources especially in arid and semi-arid regions (Rotzer et al., 2012;Canone et al., 2015;Brocca et al., 2017a; Canone et al., 2017). Thus, large scale SSM accuracy evaluation spa-tially and temporally represents an important topic to be investigated. SSM point based measurements at particular locations fail to ef-fectively capture this variability. There are different approaches used for soil moisture measurements (a recent review can be found in Petropoulos et al., 2015a), including the establishment of relevant op-erational networks (Petropoulos and McCalmont, 2017). In-situ tech-niques, such as the gravimetric Time Domain Reflectometry (TDR) and the Frequency Domain Reflectometry (FDR) (Brocca et al., 2017a,b) provide accurately SSM. However, they are of too sparse spatial cov-erage to characterize the spatiotemporal features of soil moisture at large-scale (Crow et al., 2012;Pierdicca et al., 2012). Newly developed techniques such as cosmic ray and GPS moderately address this issue (Dorigo et al., 2013).
Earth Observation (EO) provides promising methods to survey SSM at large scale at satisfactory spatiotemporal resolution (Srivastava et al., 2016b;Petropoulos et al., 2018a). In the past two decades immense progress has been achieved on developing soil moisture products by using EO from microwave, optical and thermal satellite sensors (for a review see e.g. (Petropoulos et al., 2018b). Several microwave instru-ments were launched for developing SSM global products from active/ passive microwave signals. Currently, L-band microwave sensors are considered the most promising for SSM estimation. The Soil Moisture Ocean Salinity (SMOS) mission of European Space Agency (ESA) carries thefirst operational L-band radiometer to measure SSM at spatial re-solution of˜40 km (Kerr et al., 2012;Djamai et al., 2015). Currently, the satellite Scatterometers of the European Remote Sensing (ERS-1/2) and the Advanced Scatterometer (ASCAT) onboard of the Meteorological Operational satellite program Metop-A and Metop-B (2007–2014) provide soil moisture retrievals at global scale.
In order to obtain long term soil moisture estimation at global scale,
passive and active microwave soil moisture products have been used in combination. For example, a method to derive soil moisture from SMAP/Sentinel-1 data such as SMAP L-band brightness temperatures and Copernicus Sentinel-1 C-band backscatter coefficients has been developed. Likewise, there are efforts to merge the passive and active soil moisture products under the European Space Agency Climate Change Initiative soil moisture product (CCI SM), in an attempt to generate a long term global scale soil moisture record (Liu et al., 2011; Draper et al., 2012) The Water Cycle Observation Mission (WCOM) satellite is being developed by the Chinese Academy of Sciences to combine the passive and active microwave sensors and is expected to be launched in 2020 (Shi et al., 2014).
Due to its lower sensitivity to surface roughness and vegetation cover, the L-band is more appropriate for assessing soil moisture con-ditions (Calvet et al., 2011). This makes it the most suitable microwave band for soil moisture measurement from space. In the recent years, the product has been evaluated by various studies in several geographical regions around the globe like USA (Zhuo et al., 2015), Argentina (Grings et al., 2015), Europe (Ro¨tzer et al., 2014;González-Zamora et al., 2015), China (Cui et al., 2017), India (Chakravorty et al., 2016) and West-Africa (Louvet et al., 2015).
Despite the major importance of soil moisture and measuring it ef-fectively in global scale, a systematic presentation of the accuracy of the MIRAS instrument of SMOS has been examined so far by very few studies (Petropoulos et al., 2014; Fascetti et al., 2014; Petropoulos et al., 2015b;Djamai et al., 2015;Liu et al., 2018;Chen et al., 2018). The motivation of our study was to investigate the accuracy of soil moisture measurements by SMOS in the Northern hemisphere. SMOS SSM is acquired by using remote sensing through indirect measurement techniques. There are many factors influencing their retrievals (e.g. radio interference, vegetation cover, soil roughness, etc. (see for ex-amplePetropoulos et al., 2014). Therefore, comprehensive evaluation of those operational products through all the seasons on different fferent land cover types inEUROPE. Results are shown for: a) 2010: ES_AGU (red) and ES_LJU (blue). b) 2011: ES_AGU (red), ES_LJU (blue), FR_MAU (green) (For interpretation of the references to colour in thisfigure legend, the reader is re-ferred to the web version of this article).
vegetation cover types is highly required, so that the data provider and the user can clearly understand the uncertainties associated with the data and assist in further algorithm development (Srivastava et al., 2014).
Although a number of studies have been focused on evaluation of SMOS, studies available on assessment of products over the Northern hemisphere are to our knowledge scarce. In this context, this study explores SMOS soil moisture product accuracy in different seasons and variety of land cover types at selected sites belonging to the FLUXNET global in-situ measurements network to investigate the different factors that might influence the accuracy of the soil moisture product estima-tions. A better understanding of MIRAS SSM data can lead to rapid developments in important areas of the economy, such as agriculture,
monitoring plant growth as well as food and water security. 2. Data description
2.1. In-situ measurements
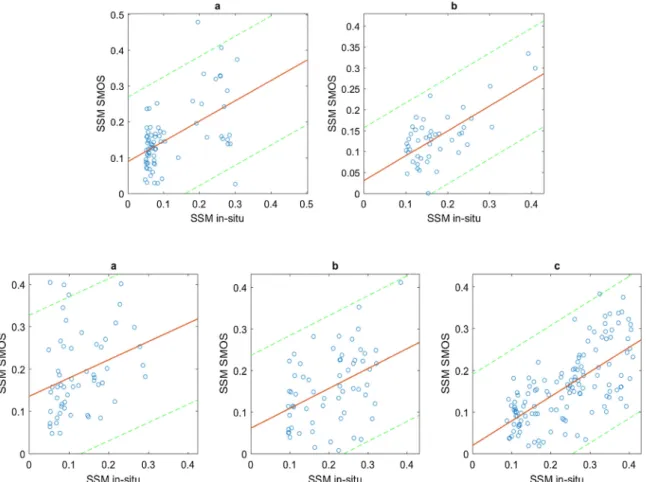
FLUXNET (http://fluxnet.ornl.gov/obtain-data) is the largest global network of micrometeorological fluxes and ancillary parameters (Baldocchi et al., 1995) in the regional and global scale. SSM is mea-sured at 30-min intervals using standardized instrumentation across sites. After data are collected standard procedures for error corrections, gap-filling and quality control take place to make sure the data are consistent for all sites and datasets. Erroneous data measurements with Fig. 2. Agreement between in-situ and predicted SSM from SMOS for all the different land cover types in Europe. Results are shown for: i- 2010: a) ES_AGU and b) ES_LJU ii- 2011: a) ES_AGU b) ES_LJU c) FR_MAU (green) (For interpretation of the references to colour in thisfigure legend, the reader is referred to the web version of this article).
Fig. 3. Agreement between in-situ (red) and predicted SSM (blue) from SMOS for the different land cover types throughout 2010 in EUROPE. Results are shown for: (a) ES_AGU and (b) ES_LJU. (For interpretation of the references to colour in thisfigure legend, the reader is referred to the web version of this article).
obvious instrument errors are removed from the in-situ data.
In this study, in-situ data for the years 2010 and 2011 were acquired from seven sites. Three of those sites were situated in Europe (AGU, LJU, and MAU) and four were in the United States (ME2, VAR, TON, WHS). Only sites with continuous long term datasets, at surfaces top 5 cm depth were selected. Another factor during the selection of sites was homogeneity in the land cover type. To avoid any mixed pixel ef-fects on the overall performance, satellite pixels are chosen over the FLUXNET towers having the largest homogenous land cover.
The 7 sites selected in this study are: ES Agu, US-WHS & ES-LJu —open shrubland, US-Me2—Evergreen Needle-Leaf Forest, US-Var —grasslands, FR-MAU —croplands. For FR-MAU, only data from 2011 were available. All in-situ data were obtained from the FLUXNET website and where possible, verified by the site manager above. 2.2. SMOS soil moisture product
The SMOS mission is a part of European Space Agency. It is thefirst L-band microwave satellite devoted to provide global measurements of soil moisture over land and ocean salinity by observing natural mi-crowave emissions from the earth surface. The SMOS satellite was launched in November 2009, its orbit is 763 km which is approximately circular with a 6 a.m. (ascending) and 6 p.m. (descending) equatorial local crossing time and still works surpassing 5 year its proposed service period.
The interferometric radiometer onboard of SMOS satellite operates in the L-band microwave. The SMOS platform main instrument is Microwave Imaging Radiometer with Aperture Synthesis (MIRAS), a dual polarized 2-D interferometer that records emitted energy from earth surface in microwave L-band (1.4 GHz). It is aimed to provide near-surface soil moisture estimations with global coverage, a three days revisit time at the equator and approximately daily at the pole, spatial resolution of around 40 km (Kerr et al., 2001). The SMOS SSM products are defined on the Icosahedral Snyder Equal Area projection (ISEA 4H9 grid) with aperture 4, resolution 9. The shape of cells is a hexagon (Srivastava et al., 2016a). Its mission expected accuracy of 4% which expected to be achievable over relatively uniform area (Panciera et al., 2011). The soil moisture retrievals evaluated in this study are the SMOS products version (v05) image granules which were acquired from Eoli-SA portal covering the full years of 2011 and 2012.
3. Methods
In-situ measurements recorded in FLUXNET at the time closer of SMOS overpass were selected for the comparisons performed in this study. After quality assessment, the data values were extracted (Excel Macro VBA) and assigned to point shapefiles of the study site (Tabular join in ArcMap 10.2). The shapefiles were imported on top of the pre-processed SMOS image pixels in the BEAM VISAT and SMOS toolbox. These pixels were further analyzed using Microsoft Excel and Matlab Fig. 4. Agreement between in-situ (red) and predicted SSM (blue) from SMOS for the different land cover types throughout 2011 in EUROPE. Results are shown for: (a) ES_AGU and (b) ES_LJU and (c) FR_MAU (For interpretation of the references to colour in thisfigure legend, the reader is referred to the web version of this article).
Table 2
Comparison per season between Satellite (SMOS) and observed SSM at all validation sites in EU for 2010 and 2011. Units are in m3/m3.
Measure Autumn 2010 Winter 2010 Spring 2010 Summer 2010 Autumn 2011 Winter 2011 Spring 2011 Summer 2011 ME (bias) 0.039 −0.051 −0.030 0.031 −0.014 −0.087 −0.063 −0.010 MAE 0.061 0.101 0.067 0.053 0.075 0.099 0.110 0.064 RMSE 0.078 0.116 0.077 0.071 0.093 0.119 0.139 0.089 R 0.305 0.234 0.559 −0.110 0.338 0.432 0.218 0.365 Rs 0.282 0.144 0.649 0.021 0.293 0.404 0.277 0.298 Scatter 0.068 0.107 0.073 0.065 0.093 0.081 0.126 0.089 Slope 0.452 0.443 0.626 −0.185 0.334 0.531 0.236 0.372 Intercept 0.093 0.100 0.037 0.128 0.095 0.053 0.115 0.089 N 44 19 26 31 79 55 50 63
2016a. Comparisons of the in-situ soil moisture (0–5 cm) and the sa-tellite soil moisture retrievals were performed and are presented in the results below. Evaluation was performed on point by point comparison of the in-situ and satellite products. The statistical performance mea-sures used were: The Root Mean Square Error (RMSE), Pearson’s Correlation coefficient (R) including slope and intercept, Spearman’s rank correlation coefficient (Rs), the Mean Error (Bias), and the stan-dard deviation (Scatter). Those statistical measures have been used in other previous studies (e.g. (Petropoulos et al., 2013;Deng et al., 2019). The analysis was carried out on different land cover types and agree-ment was evaluated for 7 sites. Similarly, agreeagree-ment was also evaluated
for the 4 seasons, spring (March- May), summer (June–August), autumn (September–November) and winter (December–February), direct point-by-point comparisons were performed at every in-situ station to eval-uate the statistical agreement for each threshold. Analysis was per-formed for each scenario independently for both 2010 and 2011. Fig. 5. Agreement between in-situ and predicted SSM from SMOS for the different seasons for all sites together shown here for year EUROPE. In particular, for (a) Autumn, (b) Winter, (c) Spring, (d) for 2011.
Table 3
Comparison between Satellite (SMOS) and observed SSM at the validation sites in USA based on land cover type, for 2010 and 2011 as well as all sites (both years). ME2 stands for Evergreen Needle-leaf Forest, TON represents Woody Savannahs, VAR stands for Grasslands and WHS represents Open Shrublands. Units are in m3/
m3.
Measure ME2 2010 ME2 2011 TON 2010 TON 2011 VAR 2010 VAR 2011 WHS 2010 WHS 2011 All Sites ME (bias) −0.045 −0.025 −0.033 −0.016 0.047 0.073 0.074 0.082 0.014 MAE 0.089 0.033 0.054 0.055 0.051 0.077 0.075 0.082 0.062 RMSE 0.117 0.040 0.075 0.068 0.065 0.093 0.086 0.092 0.080 R 0.116 0.759 0.890 0.875 0.947 0.842 0.616 0.682 0.803 Rs 0.232 0.276 0.840 0.849 0.913 0.845 0.528 0.629 0.736 Scatter 0.110 0.031 0.068 0.067 0.046 0.059 0.045 0.042 0.079 Slope 0.176 2.036 0.768 0.758 1.238 1.406 1.014 1.436 0.789 Intercept 0.079 −0.116 0.024 0.046 0.008 −0.022 0.073 0.068 0.050 N 31 29 61 46 58 28 31 29 313
4. Results 4.1. Europe
4.1.1. Different land covers performance comparisons
Thefirst study area is Europe, with three stations. The land cover type mainly covered by AGU represents Shrublands, LJU represents olive orchards and MAU represents croplands. AGU and LJU are used for the evaluations in 2010, and AGU, LJU and MAU are used for the year 2011.
Table 1,Figs. 1–5 show the evaluation results of SMOS SSM product in Europe for the years 2010 and 2011. In addition, considering that the scatter plot at a given significance level can effectively show the general trends of the correlation R between the SMOS predicted SSM with the in-situ measurements and outliers of an array, 95% confidence levels was used to intuitively reflect and compare the parameter values shown inFig. 2. Generally, as indicated from the statistical metrics calculated for the case of the comparisons for all sites, a relatively satisfactory agreement between the two compared datasets was reported (RMSE = 0.101 m3/m3, bias = -0.024 m3/ m3, scatter = 0.099 m3/m3 and R = 0.446).
Further analysis was conducted to evaluate the product perfor-mance over the different land cover types. As can be seen fromTable 1, Figs. 1 and 2, the correlation coefficient varied from 0.537−0.683 in 2010 over AGU& LJU to 0.303, 0.428 & 0.673 in 2011 over AGU, LJU and MAU respectively. Notably, for AGU and MAU in the 2011 the RMSE is larger than 0.1 m3m−3due to the presence of bias whereas the correlation obtained for AGU was low (R = 0.303). On both land covers AGU (Shrubland) and LJU (Olive), SSM product shows a good estima-tion against the in-situ measurements for the year 2010 (Fig. 1a). The SSM product estimation showed lower performance against the in-situ measurements for the year 2011 (Fig. 1b). When the results are com-bined for all sites for both years, there is indication of bias (−0.024) leading to an underestimation of the predicted SSM. In addition, per-formance for all sites was better in 2010 than 2011 with overall lower RMSE for 2010 than 2011. Similarfindings were reported also for the Scatter. In general, SMOS product behaved similarly in the different land cover types. The SMOS products for LJU (2010) had the bestfitting trend with a high R (Fig. 2b).
4.1.2. Temporal variability
To explore the temporal trends between in-situ and SMOS product for different seasons during 2010 and 2011, the in-situ measurements (red) and the predicted SSM (blue) over AGU, LJU in 2010, AGU, LJU and MAU in 2011 are investigated by month, when possible by the data, as shown inFig. 3. The 95% confidence intervals are shown as green
dashed lines in Figs. 3 and 4. Due to discontinuous data and small number of data per month, the confidence margins are wide and there are gaps in the data. Thus, it is not always possible to have results for overestimation or underestimation in a given month with statistical certainty.
In 2010, as shown inFig. 3, the SMOS product overestimated the in-situ observations from September to November over AGU (Fig. 3a) with statistical significance. In 2011, SMOS product aligns with AGU within the 95% confidence level, except for October and November although data for the previous months are scarce. Looking at the entirety of AGU though, SMOS tends to overestimate the SSM. The time series for LJU in 2011 show a greater lack of data and cannot lead to conclusions about overestimation or underestimation. For Croplands (MAU site,Fig. 4c) the data is continuous. SMOS underestimates the SSM for this site especially from January to April.
Table 2 summarizes the comparisons between autumn, winter, spring and summer in 2010 and 2011.Figs. 3–5show the agreement between predicted and observed soil moisture for the different seasons separately for 2010, 2011. Generally, all seasons displayed adequate RMSE (between 0.071 and 0.139) but a low correlation coefficient. No clear patterns that can be seen between the seasons in 2010 and 2011. The correlation (R 0.22) in spring 2011, could be associated with the negative bias and the smaller size in comparison to the other seasons in 2010 and 2011.
4.2. USA
4.2.1. Comparisons for different land use/cover types
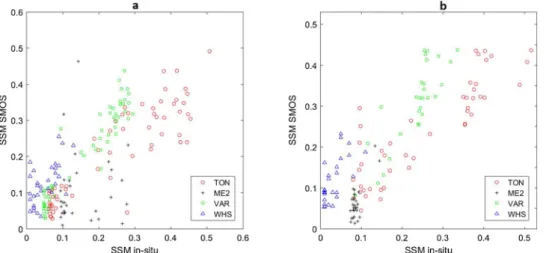
A total of four stations were included in the USA. The characteristic land surface cover types in this area are as follows: ME2 stands for Evergreen Needle-leaf Forest (ENF), TON represents Woody Savannahs (WSA), VAR stands for Grasslands (GRA) and WHS represents Open Shrublands (OSH).Table 3andFigs. 6–9show the comparison statistics between SMOS product and the in-situ measurements over different land cover types. The correlation coefficient of the predicted and the observed measurements is included in the scatterplots (Fig. 6).
Overall, as indicated from the statistical metrics computed for the analysis of the combination of all sites, a very good agreement between the two datasets was indicated (RMSE = 0.080 m3/m3, bias = 0.014
m3/ m3, scatter = 0.079 m3/m3and R = 0.80). In the case of the dif-ferent Land cover comparison, SMOS product had negative bias over ME2 (ENF) and TON (WSA), while the positive bias over VAR (GRA) and WHS (OSH) for both 2010 and 2011. In term of correlation coef-ficient, SMOS product performance was good for all sites except ME2 (ENF) which has minimum correlation coefficient for RME2 _2010= 0.116 reflected by the RMSE = 0.117, in contrast to the high
Fig. 6. Agreement between in-situ and predicted SSM from SMOS for all the different land cover types in USA. Results are shown for US_ME2 (black), US_TON (red), US_VAR (green) and US_WHS (blue): a) 2010 b) 2011.
performance in 2011 for the same site (RME2_2011 =0.759,
RMSE = 0.040). In addition, SMOS product shows maximum scatter (or standard deviation) on ME22010(Scatter = 0.110), while the scattering
is minimum in ME22011(Scatter = 0.031). Moreover, the product has
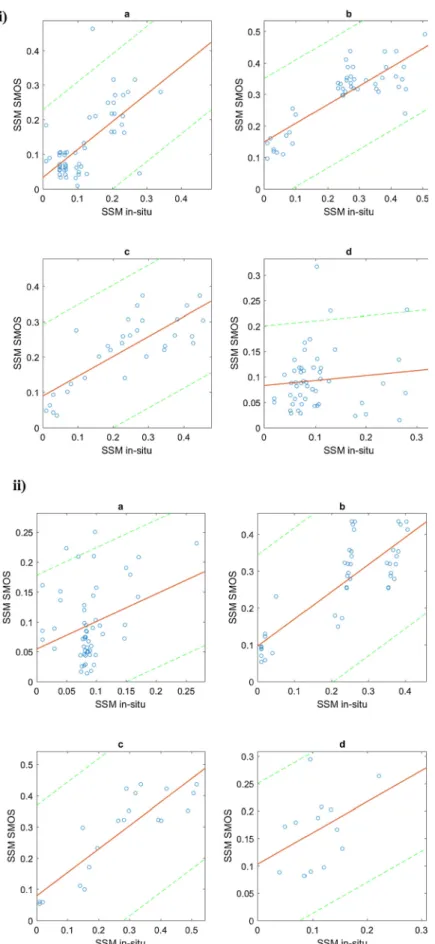
shown small RMSE values (all between 0.040 and 0.117), illustrating preferable correlation to the in-situ measurements. In addition, the SMOS products for TON, VAR and WHS showed good data quality in terms of accuracy, stability, and correlation coefficient over the dif-ferent land cover types in USA, as seen in the scatter plots ofFig. 7. In contrast SMOS product over Evergreen Needle-forest ME2 could not effectively coincide with the in-situ measurements (Fig. 7: (i)-a and (ii)-a) displaying either very high or very low slope and high intercept.
4.2.2. Temporal variability
Fig. 8shows the temporal fitting trend between the in-situ mea-surements (red) and the predicted SSM (blue) over TON (Woody Sa-vannahs), VAR (Grasslands) and WHS (Open Shrublands). For ME2 in 2010 and for all sites in 2011, the data were discontinuous with large gaps so the temporalfitting was not included. Even for the remaining sites, in some cases there was a small number of data per month leading to wide confidence margins. Thus, it is not always possible to have results for overestimation or underestimation in a given month with statistical certainty.
SMOS SSM estimations for TON (Woody Savannahs) is in good agreement with in-situ SSM from May to December with statistically significant underestimation for March and April. For VAR (Grasslands, Fig. 8b) and WHS (Shrublands,Fig. 8c), a slight (and not always sta-tistically significant) overestimation of the SSM by SMOS can be wit-nessed throughout the year.
Table 4summarizes the comparisons between the seasons andFig. 9 shows the agreement between SSM SMOS and the in-situ measurements for the different seasons separately for 2010 and 2011. In general, the SSM SMOS product has shown low RMSE in all the seasons as shown in Table 4andFig. 9. However, the correlation coefficient R was inferior in autumn 2011 and for both summers and generally good in the other seasons in both years. RMSE has the highest values in winter in both years. Spring of 2011 has the highest Pearson’s coefficient from all sites investigated in all continents and the lowest bias 0.012 m3/m3.
5. Discussion
In this study, SSM SMOS operational product is evaluated using in-situ measurements in two continental regions based on different land cover types. Three in-situ networks in Europe that included: AGU (Shrublands), LJU (olive orchards) and MAU (croplands). In USA four in-situ networks were used namely: ME2 (Evergreen Needle-leaf Forest), TON (Woody Savannahs), VAR (Grasslands) and WHS (Open Shrublands). The performance was evaluated using metrics defined in previous work (Petropoulos et al., 2013). Results are shown in section 4. In this section, an extended discussion is conducted on SMOS SSM product overall performance on different land cover types in order to further improve the algorithm.
To summarize, SMOS SSM product is generally applicable in all the selected areas. As shown in Tables 1–4, several errors metrics e.g. RMSE, Bias, Scatter, and R showed satisfactory accuracy over selected sites in Europe and USA. In Europe, SMOS SSM has shown reasonable R values, except over the Open Shrubland of AGU2011. This could be due
to number of factors such as the retrieved SMOS SSM product observed at a depth of 0–5 cm, whereas in-situ measurement sensors observed at 5 cm. Thus, the strong response to wet and dry period at shallow depth could be a reasonable explanation for discrepancies in agreement (Petropoulos et al., 2013). The SMOS values usually range between (0.001–0.7 m3
m−3), although the values generally presented a dry bias, which causes an underestimation. There is not strong evidence suggesting systematic overestimation or underestimation of SSM by SMOS. This result is coincident with some previous studies that have validated SMOS (Petropoulos et al., 2014). Recent studies (Gumuzzio et al., 2016;Cui et al., 2017) have suggested that the error in SMOS could be due to lack of scale representation between SMOS and the in-situ observations of surface temperature, land cover information, soil condition in particular and the RFI.
Previous studies focusing on the product comparisons at the annual scale shows that soil moisture estimates are driven to a certain extent by the seasonal cycle (Qin et al., 2013;Petropoulos et al., 2018b). In our study, in several cases of the seasonal cycle investigation there was a slight underestimation of SSM by SMOS. The negative correlation in summer can be explained mainly by lack of spatial sampling between predicted and observed comparison (AlBitar et al., 2012). Also, it can be partially attributed to lesser fractional vegetation cover than other Fig. 7. Agreement between in-situ and predicted SSM from SMOS for the
dif-ferent land cover types in USA. Results are shown for (a) US_ME2, (b) US_TON, (c) US_VAR and (d) US_WHS. i- 2010 ii- 2011.
seasons and/or could be associated with the smaller sample size than other seasons. On the temporal series comparisons, the predicted SMOS SSM product often overestimates slightly the in-situ observations from May to June or August. This could be explained by the presence of dew which is most prominent during summer, spring and autumn, respec-tively (DeJeu et al., 2005;Du et al., 2012). In winter, SMOS predictions have low accuracy for European sites and perform very well in USA sites. As such, no conclusions about the performance of SMOS in winter can be made from our study. Summer correlation coefficient is gen-erally suboptimal compared to other seasons for both 2010 and 2011 for USA and European sites.
In the USA sites SMOS showed good agreement between the two datasets. In term of correlation coefficient, SMOS product performance was good for TON (WSA), VAR (GRA), and WHS (OSH) in 2010 and 2011, but underperformed for ME22010(ENF). In the case of the
dif-ferent vegetation cover comparison, SMOS product had negative bias over ME2 (ENF) and TON (WSA). The product had positive bias over VAR (GRA) and WHS (OSH) in both years 2010 & 2011. Studies linked SMOS errors to global parameters such as soil texture, RFI, and land cover suggested that globally the forest presence in the radiometerfield of view appears to have the great influence on SMOS error up to (56.8%) whereas 1.7% of the RFI. The extent of the impact varies among different continents; however, soil texture was highlighted as the main influence over Europe whereas RFI had the greatest influence over Asia. Additionally, a land cover difference as a result of spatial heterogeneity could increase the error in SM within a 0.25◦-resolution pixel. Whereas, forest as well dense vegetation could increase the SSM error by negatively affecting microwave penetration (Rotzer et al.,
2012;Leroux et al., 2013;Liu et al., 2018)
The Correlation coefficient (R) was inferior in summer and good for winter and spring for both 2010 and 2011. In both years RMSE has high values in winter. This could be due to the frozen soil. During summer and spring the error could partially be explained by the presence of dew which has a significant effect on passive microwave observations by increasing horizontal brightness, and is most prominent during summer, spring, and autumn, respectively (De Jeu et al., 2005; Du et al., 2012). RFI can be defined as the disturbance that affects an electromagnetic radiation emitted from an external source (Murray, 2013). It is a major problem in SMOS SSM retrieval, which decreases the efficiency of retrieved soil moisture (Jackson et al., 1999). These disturbances largely reduce or limit the quality of the data. Hence, signal contamination removal in L-band is an ongoing research chal-lenge in Europe and many other parts of the world (Kerr et al., 2012; Oliva et al., 2012;Daganzo-Eusebio et al., 2013).
Overall, the lack of agreement between the predicted and observed SSM for all scenarios examined here can be attributed to a number of factors, such as: (1) the topographic and vegetation properties com-plexity. It is known that high vegetation density (e.g., taller and/or denser), frozen soils, snow cover, and volume scattering in dry soils are very critical for SSM operational products retrieval accuracy (Brocca et al., 2017a,b). With regards to vegetation effects in particular the quality of SSM retrievals could be strongly affected by the vegetation structure and water content. (2) The differences in terms of the SSM sensing depth between the compared datasets. In our study the surface ground measurement used for the evaluation is at 5 cm. while the sampling depth of the effective soil moisture of SMOS varies as a Fig. 8. Agreement between in-situ (red) and predicted SSM (blue) from SMOS for the different land cover types throughout 2010 in the USA. Results are shown for: (a) US_TON, (b) US_VAR and (c) US_WHS (For interpretation of the references to colour in thisfigure legend, the reader is referred to the web version of this article).
Table 4
Comparison per season between Satellite (SMOS) and observed SSM at all validation sites in USA for 2010 and 2011. Units are in m3/m3.
Measure Autumn 2010 Winter 2010 Spring 2010 Summer 2010 Autumn 2011 Winter 2011 Spring 2011 Summer 2011 ME (bias) 0.009 0.045 −0.013 −0.011 0.006 0.037 0.012 0.055 MAE 0.050 0.079 0.069 0.057 0.049 0.071 0.067 0.064 RMSE 0.074 0.091 0.086 0.082 0.063 0.084 0.078 0.083 R 0.662 0.827 0.792 0.109 0.318 0.837 0.868 0.403 Rs 0.560 0.679 0.735 0.161 0.208 0.805 0.856 0.324 Scatter 0.075 0.080 0.086 0.082 0.063 0.077 0.079 0.065 Slope 0.804 0.590 0.562 0.098 0.461 0.738 0.752 0.569 Intercept 0.033 0.149 0.089 0.083 0.054 0.096 0.078 0.103 N 53 46 31 51 54 45 20 13
Fig. 9. Agreement between in-situ and predicted SSM from SMOS for the different seasons for all sites together shown here for year USA. In particular, for (a) Autumn, (b) Winter, (c) Spring, (d) Summer[i] 2010 and [ii] 2011.
Petropoulos et al., 2014). 6. Conclusions– future work
The quantification of the SMOS SSM product accuracy is crucial for hydrological applications of the product and for the retrieval algorithm refinement. This study explores the performance of the SMOS product. SMOS data were compared to in-situ measurements from FLUXNET validated observational networks over different land cover, seasonal and varied climatic zones. This comparison increases our understanding to the product application at continental expanse. SMOS product is available for a long term period that can be used in modeling of scale-related researches such as land surface and hydrological studies. On the other hand the present evaluation can provide help and feedback for the current retrieval algorithm improvement.
The study results showed that direct comparison of SMOS opera-tional product with in-situ observations indicate good performance of the product within these sites in respect of the RMSE. The mainfindings of the study can be summarized as follows:
(1) The overall comparison at variety of sites showed generally rea-sonable agreement between the SMOS product and the in-situ measurement of soil moisture, but at different vegetation cover, some SMOS observations show negative bias. The results were largely comparable to pervious related validation studies. (2) The agreement between the in-situ measurements and the product
SSM estimations is observed in regard to different vegetation covers, where SMOS product displayed negative bias over ME2 (ENF) and TON (WSA), while the positive bias over VAR (GRA) and WHS (OSH). This conclusion suggests that the vegetation effects must be carefully accounted for consistent SSM estimations. SMOS uses nadir optical depth and different polarization incidence angle to estimate vegetation optical depth. Land cover impacts the var-iation of soil moisture content because of increasing transpiration losses and rainfall interception. Furthermore, the type of land cover also influences the vegetation attenuation and scattering albedo which can affect the overall soil moisture retrieval. Therefore, analyzing the effect of vegetation on these algorithms would be important.
(3) The seasonal periods where the predicted and observed SSM ex-hibited low correlation coefficient are summer and autumn. This could partially be explained by the presence of dew which is most prominent during summer, spring and autumn. Seasonality is one of the major controls on soil moisture dynamic and its variability can have very important impacts which can influence overall perfor-mance of the soil moisture retrieval.
The work presented was focused on temperate areas. As the results were promising, work is ongoing in expanding the SMOS SSM, SMAP, ASCAT operational SSM product evaluation over cold and arid regions. The effect of vegetation cover factor that affects the data quality
The contribution of DKAK and YB was supported by Projects of International Cooperation and Exchanges NSFC (NSFC-RCUK_STFC) (61661136005), the National Key Research and development Program of China (2016YFA0600703),“Six Talents Peak” high-level talent pro-ject in Jiangsu Province (2015-JY-013), and Propro-jects of Key Laboratory of Radiometric Calibration and Validation for Environmental Satellites National Satellite Meteorological Center, China Meteorological Administration. GPP’s contribution has been supported by the FP7-People project ENViSIoN-EO (project reference number 752094) and SL’s by the High Performance Computing Wales (HPCW) TRANSFORM-EO project. Sincere thanks also go to Matthew North who helped to conduct the research. Authors wish to thank EUMETSAT for the pro-vision of the SMOS satellite data and also the FLUXNET network for the provision of the in-situ data used in the present study.
References
Baldocchi, D.D., Valentini, R., Running, S., Oechel, W., Dhalman, R., 1995. Strategies for measuring and modeling CO2 and water vaporfluxes over terrestrial ecosystems. Global Change Biol. 2, 159–168 (Submitted).
Bao, Yansong, Lin, Libin, Wu, Shanyu, Deng, Khidir Abdalla Kwal, Petropoulos, George P., 2018. Surface soil moisture retrievals over partially vegetated areas from the synergy of Sentinel-1 and landsat 8 data using a modified water-cloud model. Int. J. Appl. Earth Obs. Geoinf. 72 (October), 76–85.https://doi.org/10.1016/j.jag.2018.05.026. Bitar, Ahmad Al, Leroux, Delphine, Kerr, Yann H., Merlin, Olivier, Richaume, Philippe,
Sahoo, Alok, Wood, Eric F., 2012. Evaluation of SMOS Soil Moisture Products Over Continental U.S. Using the SCAN/SNOTEL Network. IEEE Trans. Geosci. Remote. Sens. 50 (5), 1572–1586.https://doi.org/10.1109/TGRS.2012.2186581. Bittelli, Marco, Valentino, Roberto, Salvatorelli, Fiorenzo, Rossi Pisa, Paola, 2012.
Monitoring soil-water and displacement conditions leading to landslide occurrence in partially saturated clays. Geomorphology 173–174 (November), 161–173.https:// doi.org/10.1016/j.geomorph.2012.06.006.
Brocca, Luca, Ciabatta, Luca, Massari, Christian, Camici, Stefania, Tarpanelli, Angelica, 2017a. Soil moisture for hydrological applications: open questions and new oppor-tunities. Water 9 (2), 140.https://doi.org/10.3390/w9020140.
Brocca, Luca, Crow, Wade T., Ciabatta, Luca, Massari, Christian, de Rosnay, Patricia, Enenkel, Markus, Hahn, Sebastian, et al., 2017b. A review of the applications of ASCAT soil moisture products. IEEE J. Sel. Top. Appl. Earth Obs. Remote. Sens. 10 (5), 2285–2306.https://doi.org/10.1109/JSTARS.2017.2651140.
Calvet, Jean-Christophe, Wigneron, Jean-Pierre, Walker, Jeffrey, Karbou, Fatima, Chanzy, André, Albergel, Clément, 2011. Sensitivity of passive microwave observa-tions to soil moisture and vegetation water content: L-Band to W-Band. IEEE Trans. Geosci. Remote. Sens. 49 (4), 1190–1199.https://doi.org/10.1109/TGRS.2010. 2050488.
Canone, D., Previati, M., Bevilacqua, I., Salvai, L., Ferraris, S., 2015. Field measurements based model for surface irrigation efficiency assessment. Agric. Water Manage. 156 (July), 30–42.https://doi.org/10.1016/j.agwat.2015.03.015.
Canone, Davide, Previati, Maurizio, Ferraris, Stefano, 2017. Evaluation of stemflow ef-fects on the spatial distribution of soil moisture using TDR monitoring and an in-filtration model. J. Irrig. Drain. Eng. 143 (1), 04016075.https://doi.org/10.1061/ (ASCE)IR.1943-4774.0001120.
Carlson, T.N., Petropoulos, G.P., 2019. A new method for estimating of evapotranspira-tion and surface soil moisture from optical and thermal infrared measurements: the simplified triangle. Int. J. Remote Sens [in press].
Chakravorty, Aniket, Ram Chahar, Bhagu, Prakash Sharma, Om, Dhanya, C.T., 2016. A regional scale performance evaluation of SMOS and ESA-CCI soil moisture products over India with simulated soil moisture from MERRA-Land. Remote Sens. Environ. 186, 514–527.https://doi.org/10.1016/j.rse.2016.09.011.
Chen, Fan, Crow, Wade T., Bindlish, Rajat, Colliander, Andreas, Burgin, Mariko S., Asanuma, Jun, Aida, Kentaro, 2018. Global-scale evaluation of SMAP, SMOS and ASCAT soil moisture products using triple collocation. Remote Sens. Environ. 214
(September), 1–13.https://doi.org/10.1016/j.rse.2018.05.008.
Crow, Wade T., Berg, Aaron A., Cosh, Michael H., Loew, Alexander, Mohanty, Binayak P., Panciera, Rocco, de Rosnay, Patricia, Ryu, Dongryeol, Walker, Jeffrey P., 2012. Upscaling sparse ground-based soil moisture observations for the validation of coarse-resolution satellite soil moisture products. Rev. Geophys. 50 (2), RG2002.
https://doi.org/10.1029/2011RG000372.
Cui, Huizhen, Jiang, Lingmei, Du, Jinyang, Zhao, Shaojie, Wang, Gongxue, Lu, Zheng, Wang, Jian, 2017. Evaluation and Analysis of AMSR-2, SMOS, and SMAP Soil Moisture Products in the Genhe Area of China. J. Geophys. Res. Atmos. 122 (16), 8650–8666.https://doi.org/10.1002/2017JD026800.
Daganzo-Eusebio, Elena, Oliva, Roger, Kerr, Yann H., Nieto, Sara, Richaume, Philippe, Martha Mecklenburg, Susanne, 2013. SMOS radiometer in the 1400–1427-MHz passive band: impact of the RFI environment and approach to its mitigation and cancellation. Ieee Trans. Geosci. Remote. Sens. 51 (10), 4999–5007.https://doi.org/ 10.1109/TGRS.2013.2259179.
Deng, Khidir, Lamine, Salim, Pavlides, Andrew, Petropoulos, George, Srivastava, Prashant, Bao, Yansong, Hristopulos, Dionissios, Anagnostopoulos, Vasileios, 2019. Operational soil moisture from ASCAT in support of water resources management. Remote Sens. (Basel) 11 (5), 579.https://doi.org/10.3390/rs11050579. Djamai, Najib, Magagi, Ramata, Goïta, Kalifa, Hosseini, Mehdi, Cosh, Michael H., Berg,
Aaron, Toth, Brenda, 2015. Evaluation of SMOS soil moisture products over the CanEx-SM10 area. J. Hydrol. (Amst.) 520, 254–267.https://doi.org/10.23919/ EUSIPCO.2017.8081611.
Dorigo, W.A., Xaver, A., Vreugdenhil, M., Gruber, A., Hegyiová, A., Sanchis-Dufau, A.D., Zamojski, D., et al., 2013. Global automated quality control of in situ soil moisture data from the international soil moisture network. Vadose Zone J. 12 (3), 0.https:// doi.org/10.2136/vzj2012.0097.
Draper, C.S., Reichle, R.H., De Lannoy, G.J.M., Liu, Q., 2012. Assimilation of passive and active microwave soil moisture retrievals. Geophys. Res. Lett. 39 (4).https://doi.org/ 10.1029/2011GL050655.n/a-n/a.
Du, Jinyang, Jackson, Thomas J., Bindlish, Rajat, Cosh, Michael H., Li, Li, Hornbuckle, Brian K., Kabela, Erik D., 2012. Effect of dew on aircraft-based passive microwave observations over an agricultural domain. J. Appl. Remote Sens. 6 (1), 63571.
https://doi.org/10.1117/1.JRS.6.063571.
Fascetti, F., Pierdicca, N., Pulvirenti, L., Crapolicchio, R., 2014. ASCAT and SMOS soil moisture retrievals: a comparison over Europe and Northern Africa. 13th Specialist Meeting on Microwave Radiometry and Remote Sensing of the Environment, MicroRad 2014, Proceedings 45, 10–13.https://doi.org/10.1109/MicroRad.2014. 6878898.
González-Zamora, Ángel, Sánchez, Nilda, Martínez-Fernández, José, Gumuzzio, Ángela, Piles, María, Olmedo, Estrella, 2015. Long-term SMOS soil moisture products: a comprehensive evaluation across scales and methods in the Duero Basin (Spain). Phys. Chem. Earth 83–84, 123–136.https://doi.org/10.1016/j.pce.2015.05.009. Grings, Francisco, Bruscantini, Cintia A., Smucler, Ezequiel, Carballo, Federico, Eugenia,
María, Dillon, Maria Eugenia, Angela Collini, Estela, Salvia, Mercedes, Karszenbaum, Haydee, 2015. Validation Strategies for Satellite-Based Soil Moisture Products Over Argentine Pampas. IEEE J. Sel. Top. Appl. Earth Obs. Remote. Sens. 8 (8), 4094–4105.https://doi.org/10.1109/JSTARS.2015.2449237.
Gumuzzio, A., Brocca, L., Sánchez, N., González-Zamora, A., Martínez-Fernández, J., 2016. Comparison of SMOS, modelled and in situ long-term soil moisture series in the Northwest of Spain. Hydrol. Sci. J. Des Sci. Hydrol.https://doi.org/10.1080/ 02626667.2016.1151981.
Jackson, T.J., Le Vine, D.M., Hsu, A.Y., Oldak, A., Starks, P.J., Swift, C.T., Isham, J.D., Haken, M., 1999. Soil moisture mapping at regional scales using microwave radio-metry: the southern great plains hydrology experiment. IEEE Trans. Geosci. Remote Sens. 37 (5), 2136–2151.https://doi.org/10.1109/36.789610.
Jeu, Richard A.M. De, Holmes, Thomas R.H., Owe, Manfred, 2005. Determination of the effect of dew on passive microwave observations from space. In: Owe, Manfred, D’Urso, Guido (Eds.), Geophysical Research Abstracts 7: 04001, pp. 597608.https:// doi.org/10.1117/12.627919.
Kerr, Y.H., Waldteufel, P., Wigneron, J.-P., Martinuzzi, J., Font, J., Berger, M., 2001. Soil moisture retrieval from space: the soil moisture and ocean salinity (SMOS) mission. IEEE Trans. Geosci. Remote Sens. 39, 1729–1735.
Kerr, Yann H., Waldteufel, Philippe, Richaume, Philippe, Pierre Wigneron, Jean, Ferrazzoli, Paolo, Mahmoodi, Ali, Bitar, Ahmad Al, et al., 2012. The SMOS Soil Moisture Retrieval Algorithm. IEEE Trans. Geosci. Remote. Sens. 50 (5), 1384–1403.
https://doi.org/10.1109/TGRS.2012.2184548.
Leroux, Delphine J., Kerr, Yann H., Richaume, Philippe, Fieuzal, Remy, 2013. Spatial distribution and possible sources of SMOS errors at the global scale. Remote Sens. Environ. 133 (June), 240–250.https://doi.org/10.1016/j.rse.2013.02.017. Liu, Y.Y., Parinussa, R.M., Dorigo, W.A., M De Jeu, R.A., Wagner, W., van Dijk, A.I.J.M.,
McCabe, M.F., Evans, J.P., 2011. Developing an improved soil moisture dataset by blending passive and active microwave satellite-based retrievals. Hydrol. Earth Syst. Sci. 15 (2), 425–436.https://doi.org/10.5194/hess-15-425-2011.
Liu, Yangxiaoyue, Yang, Yaping, Yue, Xiafang, 2018. Evaluation of satellite-based soil moisture products over four different continental in-situ measurements. Remote Sens. (Basel) 10 (7), 1161.https://doi.org/10.3390/rs10071161.
Louvet, Samuel, Pellarin, Thierry, Bitar, Ahmad Al, Cappelaere, Bernard, Galle, Sylvie, Grippa, Manuela, Gruhier, Claire, et al., 2015. SMOS soil moisture product evaluation over West-Africa from local to regional scale. Remote Sens. Environ. 156, 383–394.
https://doi.org/10.1016/j.rse.2014.10.005.
Murray, D., 2013. Using RF recording techniques to resolve interference problems. 2013 IEEE AUTOTESTCON.https://doi.org/10.1109/AUTEST.2013.6645046.
Oliva, Roger, Daganzo, Elena, Kerr, Yann H., Mecklenburg, Susanne, Nieto, Sara, Richaume, Philippe, Gruhier, Claire, 2012. SMOS radio frequency interference sce-nario: status and actions taken to improve the RFI environment in the
1400–1427-MHz passive band. IEEE Trans. Geosci. Remote. Sens. 50 (5), 1427–1439.https://doi. org/10.1109/TGRS.2012.2182775.
Panciera, Rocco, Walker, Jeffrey P., Kalma, Jetse, Kim, Edward, 2011. A proposed ex-tension to the soil moisture and ocean salinity level 2 algorithm for mixed forest and moderate vegetation pixels. Remote Sens. Environ. 115 (12), 3343–3354.https://doi. org/10.1016/j.rse.2011.07.017.
Petropoulos, George P., McCalmont, Jon P., 2017. An operational in situ soil moisture & soil temperature monitoring network for West Wales, UK: the WSMN network. Sensors (Switzerland) 17 (7), 1481.https://doi.org/10.3390/s17071481. Petropoulos, George, Griffiths, Hywel, Dorigo, Wouter, Xaver, Angelika, Gruber,
Alexander, 2013. Surface soil moisture estimation. Remote Sensing of Energy Fluxes and Soil Moisture Content. CRC Press, pp. 29–48.https://doi.org/10.1201/b15610-4. Petropoulos, George P., Ireland, Gareth, Srivastava, Prashant K., Ioannou-Katidis, Pavlos, 2014. An appraisal of the accuracy of operational soil moisture estimates from SMOS MIRAS using validated in situ observations acquired in a Mediterranean environ-ment. Int. J. Remote Sens. 35 (13), 5239–5250.https://doi.org/10.1080/2150704X. 2014.933277.
Petropoulos, George P., Ireland, Gareth, Barrett, Brian, 2015a. Surface soil moisture re-trievals from remote sensing: current status, products & future trends. Phys. Chem. Earth 36–56.https://doi.org/10.1016/j.pce.2015.02.009.Parts A/B/C 83–84. Petropoulos, George P., Ireland, Gareth, Srivastava, Prashant K., 2015b. Evaluation of the
Soil Moisture Operational Estimates From SMOS in Europe: Results Over Diverse Ecosystems. IEEE Sens. J. 15 (9), 5243–5251.https://doi.org/10.1109/JSEN.2015. 2427657.
Petropoulos, G.P., Srivastava, P.K., Ferentinos, K.P., Hristopoulos, D., 2018a. Evaluating the capabilities of optical/TIR imaging sensing systems for quantifying soil water content. Geocarto Int. 1–18.https://doi.org/10.1080/10106049.2018.1520926. Petropoulos, George P., Srivastava, Prashant K., Piles, Maria, Pearson, Simon, 2018b.
Earth observation-based operational estimation of soil moisture and evapo-transpiration for agricultural crops in support of sustainable water management. Sustainability (Switzerland) 10 (1), 181.https://doi.org/10.3390/su10010181.
Pierdicca, Nazzareno, Pulvirenti, Luca, Fascetti, Fabio, Crapolicchio, Raffaele, Talone, Marco, Puca, Silvia, 2012. Soil moisture from satellite: a comparison of METOP, SMOS and ASAR products. Proceedings 2012 EUMETSAT Meteorological Satellite Conference. pp. 1–8.
Qin, Jun, Yang, Kun, Lu, Ning, Chen, Yingying, Zhao, Long, Han, Menglei, 2013. Spatial upscaling of in-situ soil moisture measurements based on MODIS-derived apparent thermal inertia. Remote Sens. Environ. 138 (November), 1–9.https://doi.org/10. 1016/j.rse.2013.07.003.
Raffelli, Giulia, Previati, Maurizio, Canone, Davide, Gisolo, Davide, Bevilacqua, Ivan, Capello, Giorgio, Biddoccu, Marcella, et al., 2017. Local- and plot-scale measure-ments of soil moisture: time and spatially resolvedfield techniques in plain, hill and mountain sites. Water 9 (9), 706.https://doi.org/10.3390/w9090706.
Ro¨tzer, K., Montzka, C., Bogena, H., Wagner, W., Kerr, Y.H.H., Kidd, R., Vereecken, H., et al., 2014. Catchment scale validation of SMOS and ASCAT soil moisture products using hydrological modeling and temporal stability analysis. J. Hydrol. (Amst.) 519, 934–946.https://doi.org/10.1016/j.jhydrol.2014.07.065.PA.
Rosnay, P., Drusch, M., Vasiljevic, D., Balsamo, G., Albergel, C., Isaksen, L.A.De, De Rosnay, Patricia, Drusch, Matthias, Vasiljevic, Drasko, Balsamo, Gianpaolo, Albergel, Clément, Isaksen, Lars, 2013. Simplified extended Kalman filter for the global op-erational soil moisture analysis at ECMWF. Q. J. R. Meteorol. Soc. 139 (674), 1199–1213.https://doi.org/10.1002/qj.2023.
Rotzer, K., Montzka, C., Bogena, H., Wagner, W., Kidd, R., Vereecken, H., 2012. Time series analysis of SMOS and ASCAT: soil moisture product validation in the Rur and Erft catchments. 2012 IEEE International Geoscience and Remote Sensing Symposium 14, 3716–3719.https://doi.org/10.1109/IGARSS.2012.6350510.IEEE. Sánchez-Ruiz, Sergio, Mari´a María Piles, María, Sánchez, Nilda, Martínez-Fernández,
José, Merce` Vall-llossera, Mercè, Camps, Adriano, Sa´nchez-Ruiz, Sergio, et al., 2014. Combining SMOS with visible and near/Shortwave/Thermal infrared satellite data for high resolution soil moisture estimates. J. Hydrol. (Amst.) 516 (August), 273–283.https://doi.org/10.1016/j.jhydrol.2013.12.047.
Seneviratne, Sonia I., Corti, Thierry, Davin, Edouard L., Hirschi, Martin, Jaeger, Eric B., Lehner, Irene, Orlowsky, Boris, Teuling, Adriaan J., 2010. Investigating soil moisture-climate interactions in a changing moisture-climate: a review. Earth. Rev. 99 (3–4), 125–161.
https://doi.org/10.1016/j.earscirev.2010.02.004.
Shi, Jiancheng, Dong, Xiaolong, Zhao, Tianjie, Du, Jinyang, Jiang, Lingmei, Du, Yang, Liu, Hao, Wang, Zhenzhan, Ji, Dabin, Xiong, Chuan, 2014. WCOM : THE Science Scenario and Objectives of A Global Water Cycle Observation Mission. State Key Laboratory of Remote Sensing Science, Institute of Remote Sensing and Digital Earth, Chinese Academy of Sciences CAS Key Laboratory of Microwave Remote Sens, pp. 3646–3649. https://www.mendeley.com/catalogue/wcom-science-scenario-objectives-global-water-cycle-observation-mission-state-key-laboratory-remote/. Srivastava, Prashant K., Han, Dawei, Ramirez, Miguel A. Rico, Islam, Tanvir, 2013. Appraisal of SMOS Soil Moisture at a Catchment Scale in a Temperate Maritime Climate. J. Hydrol. (Amst.) 498 (August), 292–304.https://doi.org/10.1016/j. jhydrol.2013.06.021.
Srivastava, Prashant K., Han, Dawei, Rico-Ramirez, Miguel A., O’Neill, Peggy, Islam, Tanvir, Gupta, Manika, 2014. Assessment of SMOS soil moisture retrieval parameters using tau-omega algorithms for soil moisture deficit estimation. J. Hydrol. (Amst) 519, 574–587.https://doi.org/10.1016/j.jhydrol.2014.07.056.PA.
Srivastava, P.K., Islam, T., Singh, S.K., Gupta, M., Petropoulos, G.P., Gupta, D.K., Wan Jaafar, W.Z., Prasad, R., 2016a. Soil moisture deficit estimation through SMOS soil moisture and MODIS land surface temperature. Satellite Soil Moisture Retrieval: Techniques and Applications. Elsevier, pp. 333–347. https://doi.org/10.1016/B978-0-12-803388-3.00017-6.
Srivastava, Prashant K., Petropoulos, George P., Kerr, Yann H., Kerr, Yann H., Srivastava, K.A.K. Deng, et al. Int J Appl Earth Obs Geoinformation 80 (2019) 206–217