HAL Id: hal-01629866
https://hal.archives-ouvertes.fr/hal-01629866
Submitted on 6 Nov 2017HAL is a multi-disciplinary open access archive for the deposit and dissemination of sci-entific research documents, whether they are pub-lished or not. The documents may come from teaching and research institutions in France or abroad, or from public or private research centers.
L’archive ouverte pluridisciplinaire HAL, est destinée au dépôt et à la diffusion de documents scientifiques de niveau recherche, publiés ou non, émanant des établissements d’enseignement et de recherche français ou étrangers, des laboratoires publics ou privés.
Monitoring damage evolution of SiC f /[Si B C] m
composites using electrical resistivity: Crack
density-based electromechanical modeling
Coraline Simon, Francis Rebillat, Vincent Herb, Gérald Camus
To cite this version:
Coraline Simon, Francis Rebillat, Vincent Herb, Gérald Camus. Monitoring damage evolution of SiC f /[Si B C] m composites using electrical resistivity: Crack density-based electromechanical modeling. Acta Materialia, Elsevier, 2017, 124, pp.579 - 587. �10.1016/j.actamat.2016.11.036�. �hal-01629866�
1
Monitoring damage evolution of SiC
f/[Si-B-C]
mcomposites using electrical
resistivity: crack density-based electromechanical modeling
Coraline Simona,b, Francis Rebillata, Vincent Herba,b, Gérald Camusa
a
Laboratoire des Composites Thermostructuraux, (CNRS-CEA-SAFRAN), University of Bordeaux, 3 allée de la Boétie, 33600 Pessac, France
b
SAFRAN Ceramics, Rue Toussaint Catros, 33187 Le Haillan, France
Abstract. The introduction of Ceramic Matrix Composites parts in civil aeronautical engines requires a thorough understanding of their mechanical behavior. In this respect, a SiCf/PyC/[Si-B-C]m composite was submitted to room temperature tensile tests with electrical
resistance monitoring and acoustic emission recording. The evolution of the electrical resistance as a function of strains was modeled using a network of resistances in series and parallel, with the introduction of locally higher resistances representing potential discontinuities in the material due to matrix microcracks. The evolution of the effective matrix crack density was deduced from the interposed unloading-reloading cycles. A high-quality correlation was found between the measured and predicted evolution of (i) the electrical resistance as a function of strains and (ii) their residual behavior observed upon unloading. A relationship is therefore established between the electrical resistance of the sample and the density of matrix cracks leading to a hindering of mechanical properties.
Keywords: Ceramic Matrix Composites (CMCs); Electrical resistivity; Mechanical behavior;
2 1. Introduction
The excellent thermo-mechanical properties of SiC/SiC ceramic matrix composites (CMCs) under oxidizing environment (high strength, toughness and creep resistance) have led to many developments for their implementation in next generation aeronautical engines [1,2], since both weight reductions and higher service temperatures should increase the engine efficiency. However, it is well-known that matrix cracking is a damage mechanism inherent to this type of materials, which, under oxidizing environments, can be critical with the formation of paths towards fibers and interphase for oxidizing volatile species (O2, H2O), contributing to reduce
dramatically the mechanical properties [2-7]. Therefore, regarding the safety concerns relative to civil aeronautics, it is essential to be able to monitor the evolution of matrix cracking under mechanical and environmental conditions of interest.
Many non-destructive evaluation techniques (NDE), such as acousto-ultrasonic, X-ray or thermography, have been used for damage detection in various types of materials including CMCs. However, most of these techniques (i) require that the components should be taken out for quite long durations, and (ii) are more efficient for the detection of out-of-plane flaws (such as delamination) than the typical thin transverse cracks perpendicular to the surface observed in CMCs. Acoustic emission has proved to be an interesting technique for quantifying matrix cracking as well as predicting times to rupture [8-10]. However, with this technique, it is necessary to monitor the material during all its service life, because it is sensitive to transitions of states (a crack creation for instance), and it cannot evaluate a damage state at zero stress without previous monitoring, which would be useful for maintenance.
Electrical resistance has proved to be a pertinent measure of the damage state for various materials such as carbon fiber-reinforced polymer composites (CFRP) [11], particle
3
reinforced polymer composites [12], and more recently in civil engineering materials [13, 14]. This technique presents the advantage of possible discrete measurements without monitoring, as it provides a physical property of the material at a given time instead of a transition of states as it is the case with AE. As for CFRPs, the fiber is almost the only constituent conducting the current, the electrical resistance of such materials is very sensitive to fiber breakage, which happens to be the main tensile damage mode. CFRP resistance has also been monitored in real time during static and fatigue loading [15], which has allowed to link the resistance increase to the fraction of broken fibers. For SiCf/SiCm composites, both the fibers
and the matrix are electrical conductors. Hence, electrical resistivity has proved to be very sensitive to transverse matrix cracking in chemical-vapor-infiltrated (CVI) composites either at room temperature [17] or at high temperature [18], and for melt-infiltrated (MI) composites at room temperature [19]. The measurement of residual resistances (at zero stress) higher than initial resistance, increasing besides with the maximum applied stress, has been noted on both MI and CVI materials [17]. All of these tested materials were processed with a boron nitride (BN) interphase, which is a poor electrical conductor. The material tested in the present work presents a pyrocarbon (PyC) interphase, which possesses a high electrical conductivity, and its resistance monitoring could therefore give access to different damage modes. Indeed, in BN-MI composites, the dominant conductive phase is the free silicon in the matrix: transverse matrix cracking (the main damage mechanism responsible for the non-linear behavior of SiC/SiC composites) causes severe disruptions in the current path and leads to high resistance increase, up to +800% [19]. However, in the considered CVI composite with PyC interphase, the dominant conductive phase should be the interphase, which should remain partly joined to the fiber close to matrix cracks. Matrix cracking, friction and debonding will locally alter the quality of the interphase, yet without generating any neat rupture in the current path, but modifications of local electric contacts due to wear with moves of carbon fragments along the
4
sliding surface depending on the level of stress, the loading/unloading step, the temperature and chemical reactions (as a local percolation phenomenon).
Several models have been proposed for CFRP composites [20], coupling electrical resistors network models to mechanical shear-lag models, and introducing an “electrical ineffective length” analogous to the well-established mechanical ineffective length. The damage mode leading to an increase of the resistance is considered, for these materials, to be fiber breakage, describing the strength of fibers by a Weibull distribution function. Regarding CMCs, an analytical model [23] inspired by previous work on CFRPs has been proposed, accounting for both fiber breakage and matrix cracks. The probability of fracture of a fiber is also described by a Weibull distribution function, and fiber fractures are introduced as ruptures in the analytical resistor network. The predictions of this analytical model have proved to be in positive correlation with experimental results for both CVI and MI woven SiC/SiC composites with a BN interphase until a strain of about 0.3%. Another model [19] based on transverse matrix cracking (instead of fiber breakage) is closely adapted to the geometry of MI composites with a BN interphase: matrix crack segments are treated as a parallel circuit consisting of fibers, Si in the matrix (i.e. the dominant electrical conductor) and the current in the interface region between the fiber and the matrix. This model appears to be accurate up to the stress required for matrix crack saturation.
In this work, an electrical resistor network model is proposed with a geometry close to the one used by [23], but considering transverse matrix cracking as the main damage mode leading to an increase in the resistance. This model is adapted to the material of the study with a CVI matrix based on the [Si-B-C] system, which presents a relatively low conductivity, and a pyrocarbon interphase with a high electrical conductivity. Moreover, the introduction of mechanical damage in the electrical model is a key issue for a satisfying coupling between
5
electrical and mechanical behaviors. This damage was previously introduced as a Weibull distribution for fiber breakage [23] with extra parameters to be fitted, or through micro-mechanical analytical expressions [19], yet with difficulties to obtain a precise estimation of debonding lengths. In this work, it is proposed to derive mechanical damage indicators directly from the stress-strain behavior of the tested material (using unloading-reloading cycles), and to use them in the electrical model. Hence, it is possible to check if a correlation is reached between an effective mechanical damage and its evolution of electrical resistance measured on the same sample.
2. Experimental materials and methods
Tensile tests have been performed on a Nicalon NL207 SiC fiber-reinforced composite produced by SAFRAN-Herakles refered to as Cerasep® A40C. The fibers were woven in an interlock pattern, with 52% of the fibers orientated in the loading direction (warp) and 48% perpendicular (weft). Prior to the processing of the SiC matrix, these fibers were coated with a pyrocarbon interphase. The total fiber volume fraction is approximately 40%. The matrix is composed of both ex-polymer SiC (PIP) and CVI layers based on the [Si-B-C] system, with self-healing properties (Fig. 1). Finally, a self-healing seal-coat was applied to the exterior to protect the samples.
Dog-bone shape specimens of a length of 200 mm were used on an Instron 8501 hydraulic machine. These sampled were fitted with glass fiber-reinforced epoxy tabs, in order to electrically insulate the composite specimens from the testing system. Two extensometers (25 mm) with knife edges electrically insulated from the sample by a thin layer of glue were placed on the opposite edges of the specimens.
6
Electrical resistance was measured using a four-point probe method in order to minimize contact resistance. Conductive wires were connected to the specimen in two different ways. Two rings were painted around the specimen with silver conductive varnish (130 mm apart for sample A, 65 mm apart for samples B and C), in order to collect the surface current on the whole perimeter of the sample. The inner wires were pasted to these rings using conductive epoxy. Shallow grooves were machined in the edges at the extremities of the sample so that the outer wires could be set in the right place, and then fixed using conductive epoxy. This method, similar to the one described in [18] allows the wire to be in contact not only with the seal-coat but also with the bulk of the material, the inner fibers and interphase.
A constant direct current was applied through the outer wires whereas the associated voltage was measured between the inner wires. A power supply (AOIP PJ6301) provided a current of 10mA, and a voltmeter (Agilent 34970A) measured the induced voltage. Electrical resistance was measured using this system with a precision of 0.5 mΩ. The stability of the measure was checked once the sample fixed in the hydraulic jaws without loading applied during 5h.
Three samples were tested in tension at a constant displacement rate of 0.1 mm/min: two (A and B) with interposed unloading/reloading cycles and one (C) tested monotonically. Acoustic emission signals were additionally recorded, using a MISTRAS Group SA system, equipped with two PICO sensors placed symmetrically on the grips. Data was acquired at a rate of 2 MHz, and events were localized by calculation of the difference between the times of arrival at each sensor. The detection threshold was fixed to 50 dB.
3. Results
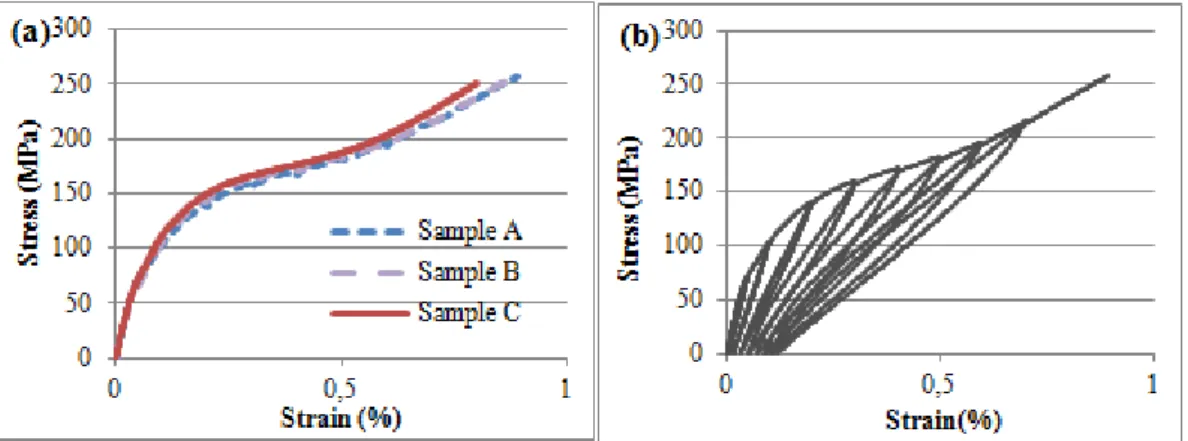
The mechanical behavior of the three samples is very close, demonstrating a good reproducibility of these tests (Fig. 2a). Samples A and B were tested in the same conditions
7
and present failure strains of 0.89% and 0.86%, whereas sample C, tested monotonously, has a slightly lower failure strain (0.80%). The mechanical behavior of sample A with the interposed cycles is displayed on Fig. 2b; the one of sample B is very close.
The evolution of electrical resistance and acoustic energy versus stress during the unloading-reloading tensile test for sample A is presented on Fig. 3a. The initial resistance of the tested sample is 1.615 Ω ± 0.5 mΩ (corresponding to a resistivity of 0.914 Ω.mm), and this value increases up to 2.297 Ω just before failure. This maximum resistance change of 42.3% is consistent with the changes reported in [17] of +30% for Hi-NiC /BN/SiC-CVI composites and +52% for Syl-iBN/BN/SiC-CVI composites, and it is neatly inferior to the changes observed for MI composites (>450% [19]). Successively, the electrical resistance increases when the stress is applied, and then decreases during the unloading phases. Respectively, the acoustic emission energy is very active for intermediate stresses until 150 MPa, and then increases with a lower rate, whereas the electrical resistance increases quite slowly until 150MPa and then rises dramatically. As expressed in [17], this proves that the electrical resistance is sensitive to phenomena which do not cause acoustic emission, such as crack opening or fiber strain. The measurement of electrical resistance becomes therefore complementary to acoustic emission analysis.
The presence of residual resistances for an unloaded state higher than the initial zero stress resistance is of clear interest for a potential use as a damage indicator or health-monitoring technique. After unloading, the measurement of the residual resistance can give an indication concerning the stress history of the sample.
During the hysteresis loops, the resistance decreases during the unload phase, down to the residual resistance, and then increases when load is applied again. For the first cycles, the same stress-resistance behavior is obtained during unloading and reloading, and then a slight
8
difference appears during hysteresis loops. Thus, the same level of resistance is reached during reloading at a lower stress than previously during the unloading phase. At the end of the hysteresis loop, the resistance is greater than at its beginning, whereas the same strain is reached. The phenomenon is clearly amplified with applied stress. It was already described in [19] for MI composites, with loops closing respectively at about 25% of the maximum stress before the cycle, much earlier than here, at 85% of the maximum stress.
Sample B was tested in the same conditions, except that the inner electrical contacts were 65 mm apart (instead of 130 mm for sample A). Hence, the initial resistance is lower for sample B than for sample A (Table 1). The increase in resistance at failure was measured at 60.7% for sample B, which is higher than 42.3% for sample A. Indeed, due to the dog-bone shape of the specimen, the material is mainly damaged in the central part of the sample (about 50 mm), and much less in the higher section zones. Hence, for the 130mm apart contacts, an important length of sample will not lead to resistance increase, whereas for the 65mm apart contact, most of the inspected material contributes to resistance increase. This explains the discrepancy between the percentages of resistance increase at failure. In order to efficiently compare these tests, it is more relevant to consider the relative increase R-R0 which eliminates
the influence of the spacing between contacts, as long as the damaged zone is included between them. It has been checked that samples A and B have indeed very close (R-R0)
values at failure.
It has therefore been decided to compare the different tests using this more relevant (R-R0)
value (Fig. 3b). Samples A and B were very close in terms of mechanical behavior, and a very good reproducibility concerning the evolution of resistance is achieved as well. Sample C, submitted to a monotonic tensile test, presents a lower increase in resistance: it does not account for the resistance increases during the interposed unloading/reloading cycles.
9
Further detailed observations can be highlighted regarding the unloading/reloading tests: in particular, once the reloading is completed, the following rate of resistance increase is much higher. This behavior is observed very soon in the damage evolution of the material, for both samples A and B (sample A only is displayed on Fig. 4a, sample B is very similar). After the relatively low peak stresses of 52 MPa and 73 MPa, the previous maximum stress experienced by the sample does not clearly affect its stress-strain behavior during the reloading phase (Fig. 4b). Yet, it does affect distinctly the stress-resistance behavior (Fig. 4a); this observation could be of great interest for maintenance in order to assess if a part has been submitted to unexpected loads. The mechanical state of the sample appears to be identical before and after a hysteresis loop on a stress-strain curve (Fig. 2b and Fig. 4b) yet the increase in electrical resistance shows that the electrical contacts have been modified during this cycle, indicating a slight evolution of the state of the interfaces. Hence, the electrical resistance is sensitive to phenomena which do not affect the mechanical behavior of the material.
Besides, by analogy with the mechanical behavior, a “resistive modulus” could be introduced as the stress-resistance rate during the unload-reload cycles. The initial resistive modulus is very high as the resistance is almost unchanged during the initial loading (up to around 50 MPa), and then it decreases dramatically: the resistive modulus at a strain of 0.7% (200 MPa) is 20 times less than the one at 0.1% (100 MPa). Indeed, for a damaged material with a great crack density and a more extended global debonded length, the effect of the applied load on each of these defects (such as crack opening) will contribute to the global resistance increase. Concerning a sound material without crack, only the piezo-resistivity of the material can have an influence, but it is very limited compared to the influence of defects. Hence, the resistive modulus, or the electrical sensitivity of the material to applied load, could be an efficient indicator to qualify, or perhaps even quantify, the damage state of the material.
10
The analysis of the evolution of electrical resistance versus strain can bring complementary information (Fig. 5). During the unloading-reloading cycles, the values of resistance are very close in function of strain (contrary to in function of stress). It should be noted that the evolution of the residual resistances versus residual strain (Fig. 5, points of minimum strain) is close to parabolic and seems similar to the observations reported in [17], and in [24] for (C/C-SiC) composites. Moreover, leaving aside the discontinuities of resistance induced by unloading and reloading, the resistance at maximum strain increases linearly with strain for strains greater than 0.3%
The examination of the fracture surface by scanning electron microscopy revealed debonded fibers, and no fragile fracture planes (Fig. 6). This is due to matrix cracking in the longitudinal yarns, leading to debond zones around the fibers. This micrography illustrates that the progressive increase of resistance has to be related to an extended mechanical damage: over the entire debond length, which is at least as long as the pull-out fiber lengths, the pyrocarbon interphase is altered and so is its electrical conductivity, as it is demonstrated in Part 4.
4. Electro-mechanical model
A coupled electromechanical model has been developed in order to describe the evolution of the electrical resistance as a function of strain of the considered SiC/SiC composite. In this 0°/90° woven composite, the uni-axial tensile load was applied in the direction of the 0° yarns which therefore beared most of the stress. It is therefore conceivable to consider the 0°/90° composite as a 0° unidirectional composite, with a fiber volume fraction Vf of half the volume
fraction of the 0°/90° composite [25].
When an electrical current is applied to the Cerasep® A40C material, it can flow through the SiC part of the matrix and the fibers, which are both semi-conductive, as well as through the
11
pyrocarbon interphase. Thus, the resistivity values of these three main constituents of the A40C composite were individually measured using the four-point probe method previously described on specifically designed samples (Table 2). The resistivity of the fibers was measured on a tow of about 500 fibers; its efficient cross-section was determined from the density of the fibers, and the length and weight of the tow, which are all available with high precision. It corresponded to 509 fibers of 14 mm in diameter, which is very close to the expected number of fiber in the tow. The resistivity of SiC-CVD was measured on a rectangular sample of SiC-CVD (dimension: 15 mm x 2.7 mm x 1.0 mm). Regarding pyrocarbon, a flake (27 mm x 2.5 mm x 0.1 mm) was used for the four-point probe measurement.
The gathered values in Table 2 show that the section of pyrocarbon available in the material is extremely reduced as compared to the section of the two other constituents, namely the fibers and the SiC matrix. However, the conductivity of pyrocarbon is much higher (about 4 orders of magnitude) that it is from far the constituent of highest conductivity (by two orders of magnitude) with respect to their typical sections. It can thus be inferred that in the Cerasep®A40C composite material, the main conductive network is linked to the pyrocarbon interphase.
As it is well-known in CMCs, matrix cracking is the main damage mode responsible for the non-linear mechanical behavior of the material. Fiber breaks, which should locally completely interrupt the interphase conductive network, occur in the studied composite at a very advanced damage state, i.e. after matrix crack saturation. Conversely, a matrix crack does not create any neat rupture of the interphase, and this interphase should remain at least partly joined to the fiber. A matrix crack leads to a local high stress concentration, and the onset of an interfacial slip zone. Within this slip zone, friction and debonding take place when the
12
material is loaded, and this should certainly deteriorate the quality of the pyrocarbon interface layer. The pyrocarbon (002) cristallographic planes will locally debond, whereas their alignment should be degraded because of friction. These mechanisms can only lead to an increase of the local resistance of the pyrocarbon layer.
This inferred behavior is expressed in the following electro-mechanical model, inspired from the work of Xia et al. [20] on CRFP composites and adapted to the present SiC/PyC/[Si-B-C] composite: the main damage mechanism is however considered as matrix cracking instead of fiber breaks. The material of the study is schematically represented on Fig. 7a in a damaged state involving cracks in the seal-coat, in the inter-yarn matrix, in the transverse yarns and in the longitudinal yarns [29]. The cracks in these first three locations introduce discontinuities in the material whereas they do not affect the pyrocarbon network in the longitudinal direction. However, the cracks within the longitudinal yarns are bridged by the longitudinal fibers and the resulting advanced damage state leads to a local alteration of the pyrocarbon interphase around these fibers, which in turn influences the longitudinal resistivity of the material. Hence, only the cracks occurring in the longitudinal yarns, and transverse to the loading direction, will be accounted for in the model (Fig. 7b).
A representation of the composite similar to the one proposed in [23] is considered, as a network of cells set out parallel and in series (Fig. 7b), and then adapted to the Cerasep®A40C material considered in the present work. Each cell is composed of a longitudinal fiber coated by its interphase and a cylinder of matrix, and has a length δ corresponding to the typical matrix cracking interval. Initially, the cell is undamaged (Fig. 7c) and has a uniform resistivity
ϕs in the fiber direction. When a matrix crack occurs (Fig. 7d), the area of the cell outside the
13
the pyrocarbon layer is altered, as previously described, and its resistivity is increased to ϕd
(with ϕd >ϕs).
The resistance R0 of the initial network of undamaged cells with a uniform resistivity ϕs, at
zero applied stress, can be expressed as Eq 1.
(1)
where N is the number of parallel fibers, m is the number of cells in series, and A and δ respectively the cross section area and the length of the unit cell.
Creations of matrix cracks are represented in the network by an increase of the central resistance of the concerned cell: the local resistivity increases from ϕs to ϕd, and the related
central resistance increases from Rscenter to Rdcenter (Fig. 7d). This modification of the local
central resistance can be reported as a function of the matrix crack density ρc (0 < ρc < 1):
(2)
When the material is unaltered and ρc is null, the average cell central resistivity is ϕs (and
). Reversely, when the matrix crack saturation is reached, all the cells are affected, ρc is equal to 1, the average cell central resistivity is ϕd (and ).
The total resistance of the network presented in Fig. 7b is expressed by Eq (3):
(3)
When a tensile strain ε is imposed, the resistivity ϕs becomes ϕs’= (1+αε) ϕs, where α is the
piezo-resistance factor of the pyrocarbon in tension. The same effect is applied to the resistivity of the damaged part ϕd (with a supposed identical α coefficient for an undamaged
14
and a debonded interface). Hence, the total resistance of the network under loading can be expressed by Eq. (4).
(4) The ratio of resistance change ΔR = R-R0 on the zero-stress resistance R0 is then deduced by
the combination of Eq. 4 and Eq. 1:
(5)
Once this step is reached, the equation requires determining the evolutions of the matrix crack density ρc and the debonded length ld. The most obvious way to access an estimation of the
matrix crack density could be to analyze the acoustic emission energy. However, this method turned out to give unsuitable results, since (i) the matrix cracks occurring in the seal-coat or in the transverse yarns are very energetic but have little influence on the electrical resistivity, and (ii) the electrical resistivity depends mostly on longitudinal intra-yarn cracking. It was thus proposed to consider the crack density that affects the mechanical properties of the material mainly in tension, i.e. to evaluate ρc from the mechanical behavior (precisely the
unload-reload characterization cycles) of the material.
In the case of large debonding energy (LDE) [25], the stress-strain cycles during unloading and loading present two distinct phases: a parabolic evolution (at the beginning of unloading or loading) and a linear evolution (at the end of loading unloading). An ideal cycle is symmetric, and thus three parameters are necessary and sufficient to describe completely its shape, which can for instance be taken as E*, Ep and L. E* is the derivate of the stress-strain
curve at the beginning of the parabolic phase (describing the damaged elastic behavior of the CMC), Ep is the derivative of the stress-strain curve in the linear phase (describing the
15
stress τ was null), and L is half of the second derivative of the strain-stress curve in the parabolic phase (describing the effects of friction at the interfaces).
Considering a tensile test with regularly interposed unload-reload cycles, those three parameters can be identified with uniqueness on each of the characterizations cycles. The three parameters E*, Ep and L can be directly linked to (i) the matrix crack density ρc, (ii) the
debond state and (iii) the friction resistance at the interfaces. The interface sliding stress τ0 is introduced, as well as a debonding density Ld, proportional to ld/δ (ld: debond length, δ:
average distance between two cracks), which is a global indicator equal to 1 when all the longitudinal interfaces are debonded. The relationship between (E*, Ep, L) and (ρc, Ld, τ0) can
be established based on Hutchinson’s equations [31-33]:
(6) (7) (8)
where E0 is the Young modulus of the composite, Ef is the modulus of the fibers, Vfl the
volume fraction of longitudinal fibers and β a coefficient of proportionality. This formulation observes the conditions Ep(Ld=0))= E* and Ep(Ld=1)= Vfl Ef. This system can easily be
reversed.
For each of the unloading-reloading cycles performed during a tensile test, the three parameters (E*, Ep, L) can be identified, and then the global micro-mechanical indicators (ρc, Ld, τ0) are evaluated at the related damage state.
16
Now, it is noticeable that Eq. (5) directly involves two of these indicators: and
. Introducing a constant coefficient , the equation Eq. (5) can also be written
as Eq. (9).
(9)
This expression involves two parameters α and K, in addition to the values of Ld and ρc that
are extracted for discrete values of ε from the performed characterization cycles. Hence the resistance change ΔR(ε) depending on strain can be evaluated as a function of strain through this methodology.
5. Discussion
5.1 Envelope curve
As previously shown, pyrocarbon forming the interphases is the main vector for current within this material. Hence, an increase of the material electrical resistance should result from an alteration of this carbon network, that is to say, from damage at the fiber/matrix interfaces. Electrical monitoring could therefore give an unprecedented access to the state of the interphases of the material, which are a well-known key factor for mechanical properties.
The electromechanical model presented in Section 4 and based on this hypothesis is applied to the unloading-reloading tensile test results described in Section 3. The first step consists in analyzing the stress-strain behavior and the hysteresis loops. For each of these loops, the three best fitting parameters (E*, Ep, L) are identified. From then, the parameters (ρc, Ld, τ0) are then
calculated using Eqs. 6, 7 and 8. Hence, for each maximum strain before a characterization cycle, three characteristics are obtained: the matrix crack density, the debond density and a value proportional to the interface sliding stress (τ0 / τref is plotted, where τref is an arbitrary
17
applied strain is presented on Fig. 8a. The parameter τ0 is obtained with the least precision, since a small change in τ0 does not influence much the shape of the unload-reload loop. However, Ld and ρc are obtained with good precision, since the moduli at the beginning of
unloading and end of reloading can be calculated precisely from the high quality experimental curve, and Ld and ρc are directly calculated from these moduli. The debond density Ld
increases slowly for low strains (ε < 0.1%) and then at a higher rate. The increase of crack density ρc slows down from 0.4%, with the matrix crack saturation.
The “theoretical” hysteresis loops of the strain-stress curves can be drawn using those 3 parameters, in solid lines, on Fig. 8b, and compared to the experimental curve in dotted line. The correspondence between the experimental and theoretical cycles is of good quality, except for the stiffening close to zero stress (due to roughness at the interfaces which is not taken into account).
The evolutions of ρc and Ld can then be introduced in Eq. 9 given by the electromechanical
model. The coefficient of pyrocarbon piezo-resistivity (gauge factor ) is estimated at a value of 10, based on the stress-strain behavior from the very first cycles with low levels of damage. It is difficult to find values of gage factors for pyrocarbon in literature, but for comparison the gauge factor of T700S carbon fibers has been measured at 5.14 [22], which is in a correct order of magnitude. The coefficient K is identified as 0.75. Eq. 9 can now be evaluated for each strain value for which an unload-reload cycle was performed.
As this model does not take into account the non reversibility of the hysteresis loops which is extremely complex to quantify, the theoretical results will be compared to the increases in resistance recorded at maximum applied strain only. In other words, the increases in resistance due to the cycles are subtracted. The resulting evolutions of resistance are presented in dotted lines on Fig. 9 for samples A and B. It appears that these calculated resistances
18
match almost perfectly with the experimental monotonous test (sample C). Hence, the increases in resistance when strain is the maximum previously applied are consistent for the three samples.
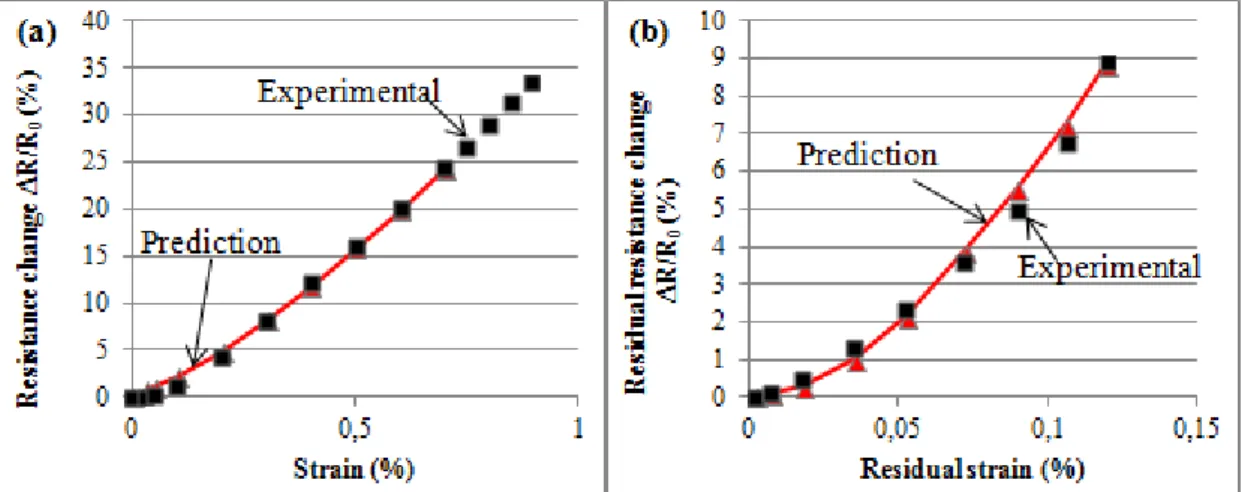
As previously stated, the resistance-strain rate at maximum applied strain becomes constant from 0.3% in strain, (Fig. 10a for sample A). The correlation between predicted and experimental resistances is of good quality, with a correct transcription of the initial slow increase in resistance, and then an increasing rate until reaching a linear phase starting from 0.3%. For sample B, as the reproducibility is of very good quality, results very close to these presented in Fig. 10a are obtained.
5.2 Residual strains
The model can also be applied to the zero stress points. As it can be considered that no further damage is created during the unloading phase, the debonding and crack densities at zero stress are identical to their values at the previous maximum strain . Eq. 9 can be adapted into
Eq. 10:
(10)
With the same value of α = 10, and an adapted value of K = 0.35, the predicted values presented in Fig. 10b are obtained. The value of α is logically unchanged because it is intrinsic to the initial material. However, K is not the same for maximum and residual resistance, because the resistivity of the damaged sections is different at maximum or zero stress. Taking this into account, the predicted residual resistance evolution issuing from the damaged values presented in Fig. 10b is in correlation with the experimental values.
This model leads to good correlations with both maximum and residual resistances evolution, until a maximum strain of 0.7% (for which the last unloading-reloading cycle was performed),
19
quite close to the failure strain of 0.9%. It seems therefore to be valid on a large scale of damage phases. The input data used to introduce mechanical damage in the electrical model is directly taken from the mechanical behavior of the tested sample, with therefore a closer relation between input damage data and real damage than by introducing a statistical function where extra parameters need to be fitted. Two coefficients need to be determined in order to use this model: the pyrocarbon gauge factor which can be deduced from the initial elastic loading and the coefficient K which has to be fitted with the experimental data.
5.3 Hysteresis loops
Concerning limitations, the irreversibility of the unloading-reloading cycles regarding resistance is not described by the model. Indeed, it has been observed (Fig. 3) that (i) the resistivity of a fixed damaged section should be significantly modified as a function of the applied stress during a hysteresis loop and (ii) the resistance after reloading is signifcantly higher than the resistance at the previous maximum strain. Logically, it is supposed in the model that no further damage (increase in crack or debonding densities) is introduced below the previous maximum strain. Yet, it appears that during these cycles, the electrical contacts are modified leading to a higher resistance after reloading. These reversible and irreversible phenomena are too complex to quantify and therefore are not introduced in the analytical model. Besides, fiber breakage is not taken into account, but it is not a predominant damage mode until only fibers sustain the whole load. Another limitation is the hypothesis of a regular resistor network with uniform or averaged cell size: in the real material, the length between cracks is non-uniform with possible overlapping debonding lengths, and shorter locally with the crimp of yarn.
Taking note of those limitations, it can be stated that a relationship has been established between the electrical resistance evolution of the sample and its level of mechanical damage,
20
quantified by global debonding density and matrix crack density. The electrical resistance of the sample clearly depends on the evolution of those two micro-mechanical parameters.
6. Conclusion
The evolution of the electrical resistance of a SiC/PyC/[Si-B-C] woven composite was monitored during three tensile tests, two with intermediate unloading-reloading cyles, and one monotonously. It has been demonstrated to be an effective technique to assess the accumulation of damage during tensile loading. Residual resistances were measured, and it was noted that the sensitivity of the resistance to applied strain increases with the damage state of the material. These tests displayed a good reproducibility. An electro-mechanical model has been developed, relating mechanical damage parameters and electrical resistance of the material. The electrical model was developed as a network of resistor cells in which matrix cracks are gradually introduced by local increases of resistance. This electrical analysis showed dependence on the matrix crack density and the debonding density, which were directly extracted from the mechanical behavior of the sample during the tensile test. A relationship was therefore established between (i) electrical resistance and (ii) matrix crack density and debonding density. A good correlation was found between measured maximum resistances and the model prediction based on the experimental evolution of damage parameters. The correlation proved to be correct as well for residual resistances.
This monitoring technique could be further used during thermo-mechanical testing. This would present a great interest on such a material because it would allow a real-time monitoring of the state of the pyrocarbon interphase, submitted to friction in an oxidizing environment. Unloading-reloading cycles could be performed as well in order to provide input data for the model which would be tested in another situation. Few adjustments should be
21
needed to be adapted to elevated temperature testing and creep or cyclic fatigue. These points will be treated in our further works.
Acknowledgements
This work was supported by SAFRAN Ceramics, mainly through a PhD scholarship provided to Coraline Simon. The authors would like to gratefully acknowledge Bruno Humez (LCTS).
Nomenclature
Initial resistivity in the fiber direction K Adimensional parameter
Resistivity in the damaged zone α Gage factor for pyrocarbon
R0 Initial resistance of the composite ε Strain
Rs Resistance of the intact part of the cell εres Residual strain
Rd Resistance of the damaged part of the cell εmax Maximum previously applied
strain
Rcenter Resistance of the center part of the cell
Interface sliding stress
Reference interface sliding stress
Rres Residual resistance (at zero load) Ef Young Modulus of the fibers Rmax Maximum resistance (at previous
maximum load)
E0 Young Modulus of the composite Averaged distance between two cracks Vfl Volume fraction of the longitudinal
fibers
A Section of the cell E* Modulus at the beginning of
reloading
m Number of cells in series Ep Modulus at the end of unloading N Number of fibers in parallel L Micromechanical parameter linked
to the hysteresis loop width
ld Debonding length
Ld Debonding density (=ld/δ)
Matrix crack density
β Coefficient of proportionality between L, and
References
[1] R. Naslain, Design, Preparation and properties of non-oxide CMCs for application in engines and nuclear reactors: an overview, Composites Science and Technology 64 (2004) 155–170.
[2] F. Christin, Design, fabrication, and application of Thermostructural Composites like C/C, C/SiC, and SiC/SiC composites, Advanced Engineering Materials 4 [12] (2002) 903-912.
22
[3] F. Rebillat, Advances in self-healing ceramic matrix composites, in: I.M. Low (Ed), Advances in ceramic matrix composites, Woodhead Publishing, Cambridge, 2014, pp. 369-409.
[4] F. Lamouroux, S. Bertrand, R. Pailler, R. Naslain, M.Cataldi, Oxidation-resistant carbon-fiber-reinforced ceramic-matrix composites, Composites Science and Technology 59 (1999) 1073-1085.
[5] J.A. DiCarlo, H.M. Yun, J.B. Hurst, Fracture mechanisms for SiC fibers and SiC/SiC composites under stress-rupture conditions at high temperatures, Applied Mathematics and Computation 152 (2004) 473-481.
[6] W.H. Glime, J.D. Cawley, Oxidation of carbon fibers and films in ceramic matrix composites: a weak link process, Carbon 33 [8] (1995) 1053-1060.
[7] L. Casas, J.M. Martinez-Esnaola, Modelling the effect of oxidation on the creep behavior of fibre-reinforced ceramic matrix composites, Acta Materiala 51 (2003) 3745-3757.
[8] G.N. Morscher, Stress-dependent matrix cracking in 2D woven SiC-fiber reinforced melt-infiltrated SiC matrix composites, Composites Science and Technology 64 (2004) 1311–1319.
[9] E. Maillet, N. Godin, M. R’Mili, P. Reynaud, J. Lamon, G. Fantozzi, Analysis of acoustic emission energy release during static fatigue tests at intermediate temperatures on ceramic matrix composites: towards rupture time prediction, Composites Science and Technology 72 (2012) 1001-1007.
[10] M. Moevus, D. Rouby, N. Godin, M. R’Mili, P. Reynaud, G. Fantozzi, G. Farizy, Analysis of damage mechanisms and associated acoustic emission in two SiC/[Si–B–C] composites exhibiting different tensile behaviours. Part I: Damage patterns and acoustic emission activity, Composites Science and Technology 68 (2008) 1250-1257.
[11] K. Schulte, C. Baron, Load and failure analyses of CFRP laminates by means of electrical resistivity measurements, Composites Science and technology 36 (1989) 63-76.
[12] G.R. Ruschau, S. Yoshikawa, R.E. Newnham, Resistivities of conductive composites, J. Appl. Phys. 72 (1992) 953.
[13] R. Ranade, J. Zhang, J. P. Lynch, V. C. Li, Influence of micro-cracking on the composite resistivity of engineered cementitious composites, Cement and Concrete Research 58 (2014) 1-12.
[14] V. Vesely, P. Konecny, P. Lehner, Influence of crack propagation on electrical resistivity and ultrasonic characteristics of normal concrete assessed by sequential TPB fracture, Theoretical and Applied Fracture Mechanics 80 (2015) 2-13.
[15] X. Wang, S. Wang, D.D.L. Chung, Sensing damage in carbon fiber and its polymer-matrix and carbon-matrix composites by electrical resistance measurements, Journal of Materials Science 34 (1999) 2703-2713.
[16] X. Wang, D.D.L. Chung, Fiber-breakage in polymer-matrix composites during static and fatigue loading, observed by electrical resistance measurement, Journal of Material Research 14 (1999) 4224-9.
23
[17] C.E. Smith, G.N. Morscher, Z. Xia, Monitoring damage accumulation in CMCs using electrical resistivity, Scripta Materiala 59 (2008) 463-466.
[18] C.E. Smith, G.N. Morscher, Z. Xia, Electrical resistance as a Nondestructive Evaluation Technique For SiC/SiC CMC under creep-rupture loading, Int. J. Appl. Ceram. Technol. 8 (2011) 298-307.
[19] G.N. Morscher, C. Baker, C. Smith, Electrical Resistance of SiC Fiber reinforced SiC/Si Matrix Composites at Room Temperature during Tensile Testing, Int. J. Appl. Ceram. Technol. 11 (2014) 263-272.
[20] Z.H. Xia, T. Okabe, J.B. Park, W.A. Curtin, N. Takeda, Quantitative damage detection in CFRP composites: coupled mechanical and electrical models, Composite Science and Technology 63 (2003) 1411-1422.
[21] Z.H. Xia, W.A. Curtin, Modeling of mechanical damage detection in CFRPs via electrical resistance, Composite Science and Technology 67 (2007) 1518-1529. [22] J.B. Park, T. Okabe, N. Takeda, W.A. Curtin, Electromechanical modeling of
unidirectional CFRP composites under tensile loading conditions, Composites: Part A 33 (2002) 267-275.
[23] T. Sujidkul, C. Smith, Z. Ma, G. N. Morscher, Z. Xia, Correlating electrical resistance change with mechanical damage in woven SiC/SiC composites: experiment and modeling, J. Am. Ceram. Soc. 97 (2014) 2936-2942.
[24] H. Böhrk, P. Leschinski, T. Reimer, Electrical resistivity measurement of carbon-fiber-reinforced ceramic matrix composite under thermo-mechanical load, Composites Science and Technology 76 (2013) 1-7.
[25] A.G. Evans, F.W. Zok, Review: The physics and mechanics of fibre-reinforced brittle matrix composites, Journal of Materials Science 29 (1994) 3857-3896.
[26] L. L. Snead, Limits on irradiation-induced thermal conductivity and electrical resistivity in silicon carbide materials, Journal of Nuclear Materials 329-333 (2008) 524-529.
[27] Y. Katoh, T. Nozawa, L.L. Snead, T. Hinoki, A. Kohyama, Property tailorability for advanced CVI silicon carbide composites for fusion, Fusion Engineering and Design 81 (2006) 937–944.
[28] A. P. Graham, G. Schindler, G. S. Duesberg, T. Lutz, W. Weber, An investigation of the electrical properties of pyrolytic carbon in reduced dimensions: vias and wires, Journal of Applied Physics 107 (2010) 114316.
[29] L. Guillaumat, Micro-cracking of CMCs: relationships with the microstructure and the mechanical behavior. PhD Thesis 1056, University of Bordeaux, France, 1994. [30] E. Grippon, Endommagement et microfissuration d’un composite à matrice céramique tissé 3D : approche multi-échelle et évaluation ultrasonore. PhD Thesis 4908, University of Bordeaux, France, 2013.
[31] M.Y. He, B.X. Wu, A.G. Evans, J.W. Hutchinson, Inelastic strains due to matrix cracking in unidirectional fiber-reinforced composites, Mechanics of materials 18 (1994) 213-229.Mechanics of Materials 1
[32] J. W. Hutchinson, H. M. Jensen, Models of fiber debonding and pullout in brittle composites with friction, Mechanics of materials 9 (1990) 139-163.
24
[33] J.-M. Domergue, E. Vagaggini, A. G. Evans, Relationships between hysteresis measurements and the constituent properties of ceramic matrix composites: II, Experimental studies on unidirectional materials, J. Am. Ceram. Soc. 78 (1995) 2721-2731.
Figure captions
Figure 1 – Micrography of a polished cross-section from a material similar to Cerasep® A40C
25
Figure 2 – Stress-strain behavior for (a) the three samples without displaying unloading/reloading cycles for samples A and B, and (b) for the complete testing of sample A
Figure 3 – (a) Electrical resistance and cumulative AE energy during a tensile test with interposed characterization cycles for sample A and (b) comparison of the evolutions of resistance (R-R0) versus stress for the three tested samples
26
Figure 4 – Comparison of the behaviors of sample A at the beginning of the tensile test (three first loading-unloading cycles), up to 103 MPa, in the planes (a) Stress-Resistance and (b) Stress-Strain
Figure 5 – Evolution of the electrical resistance depending on strain during an unload-reload tensile test to failure (sample A)
27
Figure 6 – Scanning electron microscopy image of the SiC/PyC/[Si-B-C] composite showing debonded fibers at the fracture surface of sample A
Figure 7 – Schematic representation of (a) the damaged SiCf/SiC material loaded at a strain
of around 0.5% with crack propagation in the seal-coat, in the inter-yarn matrix, in the transverse yarns and in the longitudinal yarns, (b) an electrical network of multiple parallel cells in series representing the composite, with occurrences of matrix cracks, (c) the initial sound unit cell, (d) a cell after a matrix crack with debonded interfaces and altered pyrocarbon interphase.
28
Figure 8 – (a) Evolution with strain of dimensionless parameters τ0, Ld and ρc, as obtained by
identification on the experimental hysteresis loops (sample A) and (b) Stress-strain behavior of the SiC/SiC composite, experimental (dotted line) and theoretical unload-reload cycles (solid lines) defined by the 3 parameters identified on each cycle (sample A).
29
Figure 9 – Evolutions of resistance R-R0 as a function of strain for samples A and C. The
evolutions for samples A and B with subtraction of resistance increases during the cycles are presented in dotted lines.
Figure 10 – Experimental and predicted resistances as a function of applied strain during the tensile test performed on sample A for (a) maximum resistances (α=10, K=0.75) and (b) residual resistances (α=10, K=0.35)18 (
30
Table 1 – Electrical resistance values before and after testing on three samples
Sample A Sample B Sample C
Length between contacts (mm) 130 65 65
R0 (Ohm) 1,615 1,070 1,168
R at failure (Ohm) 2,297 1,720 1,650
R at failure (%) 42,3 60,7 41,3
R-R0 at failure (Ohm) 0,683 0,650 0,482
Table 2- Typical resistivity values of the material constituents
NL207 fiber PyC SiC-CVD
Resistivity (Ω.m), measured values 9 1.5 x10⁻⁵ 0.3
Resistivity (Ω.m), in literature 10 [26] 3.3 x10
-5
[27]
4.5 x10⁻⁵ [28] 0.1 [27] Typical surface in the composite relative
to PyC surface (order of magnitude) 20 1 20


![Figure 6 – Scanning electron microscopy image of the SiC/PyC/[Si-B-C] composite showing debonded fibers at the fracture surface of sample A](https://thumb-eu.123doks.com/thumbv2/123doknet/12928352.373895/28.892.109.508.203.535/figure-scanning-electron-microscopy-composite-showing-debonded-fracture.webp)