HAL Id: tel-00767412
https://tel.archives-ouvertes.fr/tel-00767412
Submitted on 19 Dec 2012HAL is a multi-disciplinary open access archive for the deposit and dissemination of sci-entific research documents, whether they are pub-lished or not. The documents may come from teaching and research institutions in France or abroad, or from public or private research centers.
L’archive ouverte pluridisciplinaire HAL, est destinée au dépôt et à la diffusion de documents scientifiques de niveau recherche, publiés ou non, émanant des établissements d’enseignement et de recherche français ou étrangers, des laboratoires publics ou privés.
THÈSE
Pour obtenir le grade de
DOCTEUR DE L’UNIVERSITÉ DE GRENOBLE
Spécialité : PhysiqueArrêté ministériel : 7 août 2006
Présentée par
Romain COULON
Thèse dirigée par Alejandro A. Franco et
préparée au sein du Laboratoire des Composants pour les piles à combustibles, les électrolyseurs et de modélisation. (Commissariat à l’Energie Atomique et aux Energies Alternatives) et de l’Institut de thermodynamique technique (Deutsches Zen-trum für Luft und Raumfahrt)
dans l'École Doctorale de Physique
Modélisation de la dégradation
chimique de membranes dans
les piles à combustible à
mem-brane électrolyte polymère.
Thèse soutenue publiquement le 31 janvier 2012, devant le jury composé de :
Michael EIKERLING
Professeur, Simon Fraser University, Vancouver, Rapporteur
Gérald POURCELLY
Professeur d’Universités, Université de Montpellier 2, Rapporteur
Thierry DEUTSCH
Docteur chercheur, Université Joseph Fourier, Grenoble, Président
Jochen KERRES
Docteur chercheur, Universität Stuttgart, Examinateur
Gwenaelle RENOUARD-VALLET
Ingénieur, Airbus, Hambourg, Examinateur
Wolfgang G. BESSLER
Co-encadrant de thèse, ingénieur chercheur, DLR Stuttgart
Alejandro A. FRANCO
i
Abstracts
Resumé en français :
Cette thèse propose une approche de modélisation de la dégradation chimique par attaque radicalaire de la membrane dans les piles à combustibles à membrane électrolyte polymère, ainsi que à son impact sur la dégradation de la performance électrochimique.
La membrane considérée dans cette étude est de type perfluorosulfonique, avec une structure dépen-dant fortement de son humidification et conditionnant les propriétés de transport. Afin d’étudier la dégradation de la membrane, il faut dans un premier temps établir un modèle de transport, qui sera utilisé aussi bien dans le modèle de dégradation que par les modèles de performance de cellule déjà existants. Une fois ce modèle établi, nous nous focalisons sur la partie dégradation chimique. Après une compréhension globale des phénomènes physico-chimiques se déroulant lors de la dégradation, une mise en équation détaillée est nécessaire. Même les concepts utilisés sont relativement simples, le besoin de nombreux paramètres nous a contraint à simplifier le modèle sur certains points, notamment le mécanisme de dégradation chimique, tant la complexité du phénomène est un frein à la paramétrisa-tion du modèle. Ce modèle, avec ses simplificaparamétrisa-tions et ses hypothèses, est ensuite validé, aussi bien d’un point de vue performance que d’un point de vue dégradation.
Il est pour finir exploité dans différents cas de figures, allant de l’utilisation ininterrompue à courant constant (test purement utilisé en laboratoire) à un cyclage plus représentatif de conditions de fonc-tionnement réelles.
PEMFC, Pile à combustible, Fenton, Dégradation, Modélisation, Membrane, Nafion®
Abstract in English:
This thesis proposes a modeling approach of the chemical degradation by radicals attack of the mem-brane in polymer electrolyte memmem-brane fuel cells, as well as its impact on the electrochemical perfor-mance degradation. The work considers a perfluorosulfonated acid type membrane. Its structure is strongly influenced by humidification, which also impacts the transport properties of mass and charge within the membrane. In order to study the degradation of the membrane, we first established a multi-species transport model for protons, water, and dissolved gases, radicals and ions. We then included detailed chemical reaction mechanisms of hydrogen peroxide formation, hydrogen peroxide decompo-sition, and radical attack of the membrane. Finally, a feedback between degradation, structure, and performance was established. Parameters were identified and the model was validated using literature experimental data both under performance and degradation aspects.
The model was then exploited under different conditions, from pure laboratory conditions (constant current kept over a long time) to working conditions which are more representative of the use of a PEMFC for stationary applications (performance cycles).
iii
Remerciements / Danksagung
Trois ans c’est le temps nécessaire à terminer le lycée. C’est aussi le temps nécessaire à terminer une école d’ingénieur. Mais ce fut également le temps nécessaire à l’aboutissement de ce projet de thèse. En premier lieu, je tiens ici à remercier les membres du jury. Mes rapporteurs, Michael Eikerling et Gerald Pourcelly, pour le temps qu’ils m’ont accordé, à la fois lors de la révision de mon manuscrit et également lors de leur présence à ma soutenance. Ich bedanke mich auch bei Jochen Kerres, für seine Anwesenheit bei der Verteidigung und sein große Interesse an meiner Arbeit. Je voudrais également remercier Gwenaelle Renouard-Vallet et Nicolas Fouquet pour le temps qu’ils m’ont accordé à lors de l’examen de mon manuscrit. Et merci à Thierry Deutsch, qui fut un temps mon directeur de thèse. Ensuite viennent ceux qui me soutiennent et supportent depuis 3 ans (voire plus). Alejandro et Wolf-gang, merci pour votre soutien au cours de cette aventure, et merci surtout pour la chance que vous m’avez donnée il y a trois ans, alors que je n’avais jamais programmé, ni su ce qu’était une pile à combustible. Vos contributions et toutes les discussions enrichissantes que nous avons pu avoir ont grandement contribué à combler mes lacunes.
Nun meine Gedanken an meiner deutschen Kumpel ! Danke Dir Christian fürs vieles Lachen, Brainst-orming und Freitags-LKW! Danke auch der Modellierungsgruppe und alle, die mal dabei waren: Jo-nathan, David, der kleine Wolfgang, Vitaliy Cheng, Max, Florian, Moritz, Wendelin, Christoph und noch viel mehr, da es viele waren.
Ensuite les „français“, parce que pas beaucoup ne sont français. Obrigado les brésiliens Luiz, Daiane et Rodriginho pour m’avoir fait découvrir les paçoquinha et pour votre bonne humeur au labo. Alegato Yoshinori, your help was first quality in solving physical issues the last months. Grazie Valentina, je note que je dois arrêter les T shirt moches et me mettre aux chemises. Thank you professeur Cheah. Greetings Senthilnathan. Gracias Pablo, don’t forget that fairy wear boots in a locomotive breath. Merci également à Fus Ro Dah Benjamin, pour les quizz, les séquences vintage et sa contribution dans ma quête de faire découvrir la culture française à nos brésiliens. Merci ensuite aux « autres », ceux qui font des expériences… Nicolas, Olivier, Zhe, Federico, Anne-Gaëlle, Galdric, Samir, Mohamed, etc etc. Merci à mes secrétaires successives, qui ont dû endurer ma présence plus qu’envahissante dans leur bureau. Donc merci à vous, Gégé, Kim, Aline et Charline ! Un merci tout particulier également à Mathias, tu as beau faire des modèles, tu n’en restes pas moins un bon vosgien et merci à Jenny pour les heures passées à discuter et à rigoler.
Pour terminer, les derniers remerciements mais non les moindres, je remercie mon papa, ma maman, mon brud et ma ninette pour leur soutien moral non scientifique depuis toutes ces années passées et à venir. Je leur dédie ce manuscrit qu’ils ne comprendront jamais.
v « La théorie, c'est quand on sait tout et que rien ne fonctionne. La pratique, c'est quand tout fonctionne et que personne ne sait pourquoi. Ici, nous avons réuni théorie et pratique : Rien ne fonctionne... et personne ne sait pourquoi! »
Albert Einstein «C’est pas faux»
vii
Table of Contents
Abstracts ... i
Table of Contents ... vii
List of Tables ... xi
List of Figures ... xii
List of Abbreviations ... xix
List of Symbols ... xxiii
0 Introduction ... 3
0.1 What is modeling? Why using modeling in fuel cell technology? ... 3
0.2 Scope of this thesis ... 4
1 Context and motivation of this thesis: Membrane Degradation in PEMFC ... 8
1.1 A clean energy conversion device: The PEMFC... 8
1.1.1 General presentation ... 8
1.1.2 Components of a PEMFC ... 9
1.2 Nafion®: The first and most famous electrolyte for PEMFC ... 12
1.2.1 An enigma for modelers and polymer scientists ... 12
1.2.2 Analytical methods for morphology determination of Nafion® ... 14
1.3 Chemical degradation of the electrolyte in PEMFCs: Experimental evidence ... 22
1.3.1 Loss of cell performance over time ... 22
1.3.2 Membrane thinning ... 26
1.3.3 Production of hydrogen peroxide in the electrodes ... 30
1.3.4 Formation of radicals ... 33
1.3.5 Chemical analysis of the degradation of PFSA membranes ... 34
1.4 Chemical degradation of the electrolyte in PEMFCs: Available modeling work ... 35
1.5 Summary ... 41
viii
2.4 Summary ... 69
3 Coupling of the membrane model with electrode and cell models ... 73
3.1 Why cell models? ... 73
3.1.1 DENIS ... 73
3.1.2 MEMEPhys® ... 73
3.1.3 Membrane simulation code ... 74
3.2 Physics underlying the MEMEPhys® model ... 75
3.2.1 Presentation of the model ... 75
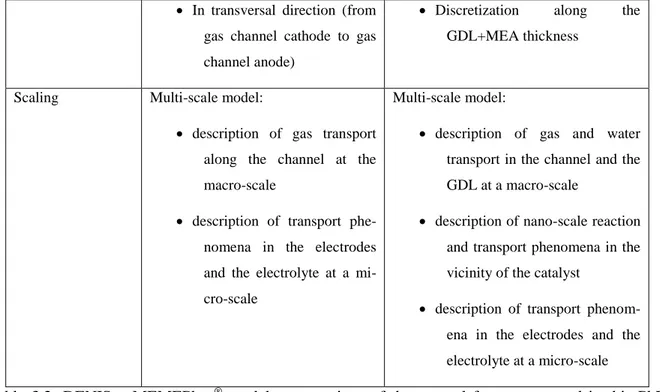
3.2.2 Description of the multi scale model of the electrodes... 76
3.2.3 Calculation of the potential in the MEMEPhys® approach ... 80
3.2.4 Coupling of the MEMEPhys® electrode model with electrochemistry ... 83
3.2.5 Channel and GDL model ... 87
3.3 Physics underlying in the electrode model of DENIS ... 88
3.3.1 Presentation of the model ... 88
3.3.2 Calculation of the cell potential in DENIS ... 89
3.3.3 Gas transport and channel model in DENIS ... 93
3.4 Comparison MEMEPhys® / DENIS electrode models ... 94
3.5 Coupling of the membrane model with the electrodes model ... 96
3.5.1 Generalities ... 96
ix
3.5.3 Specifications for the coupling in MEMEPhys® ... 97
3.6 Summary ... 99
4 Results and discussion ... 103
4.1 Introduction ... 103
4.2 Model parameterization and validation ... 105
4.2.1 Presentation of the “standard” cell used in the simulations ... 105
4.2.2 Electrochemical model ... 107
4.2.3 Chemical degradation model ... 110
4.2.4 Influence of experimental conditions on chemical degradation ... 120
4.2.5 Validity of the model ... 122
4.3 Impact of chemical degradation on cell performance under constant current load ... 123
4.3.1 Introduction ... 123
4.3.2 Impact of the chemical degradation on cell potential and membrane resistance ... 123
4.3.3 Impact of the chemical degradation on cell performance: Evolution of the polarization curve 139 4.3.4 Localization of the degradation in the membrane ... 146
4.4 Impact of chemical degradation on cell performance under cyclic current operation ... 147
4.4.1 Introduction to the necessity of the use of current cycles ... 147
4.4.2 On-off cycle of a PEMFC ... 148
4.4.3 Imin–Imax cycle of a PEMFC ... 152
4.5 Impact of the presence and the amount of iron ions on degradation ... 156
4.6 Degradation of other PFSA membranes ... 160
4.7 Prediction of long-term cell durability ... 164
4.8 Strategies for mitigating membrane degradation ... 168
4.8.1 Sensitivity analysis ... 168
4.8.2 Experimental conditions preventing the PFSA membrane chemical degradation ... 170
4.8.3 Operating conditions for a higher durability of the PFSA membrane ... 171
xi
List of Tables
Table 1.1: Materials and properties of the PEMFC components... 10
Table 1.2: Parameters of some commercial PFSA membranes (when no value for a parameter is given, this means that the parameter is not present in the chemical structure of the ionomer) ... 14
Table 1.3: Evolution of membrane thickness of Nafion® membranes exposed in H2 or O2 for 1000 h (after [71]) ... 27
Table 1.4: AST used by Young et al. [16]. ... 29
Table 3.1: Summary of the potentials calculated in the MEMEPhys® model ... 79
Table 3.2: DENIS – MEMEPhys® models: comparison of the general features as used in this PhD thesis work. ... 95
Table 4.1: Variable parameters in the simulations ... 106
Table 4.2: Main structural parameters of our standard PEMFC ... 106
Table 4.3: Gibbs activation energies for elementary steps (chemical and electrochemical) for the HOR and the ORR. ... 107
Table 4.4: Parameter used in the experiment displayed in Figure 4.5. ... 109
Table 4.5: Experimental parameters used by Liu and Zuckerbrod ... 111
Table 4.6: Gibbs activation energies for elementary steps for the H2O2 formation ... 112
Table 4.7: Experimental parameters used by Aoki et al... 114
Table 4.8: Kinetic rates of Fenton's chemistry used in our model ... 114
Table 4.9: Experimental parameters used by Young et al. for the determination of cumulative fluoride ions released under AST. ... 117
Table 4.10: Thermal evolution of the side chain degradation kinetic rate ... 119
Table 4.11: Conditions used for the on - off simulations ... 149
Table 4.12: Conditions used for the Imin–Imax simulations ... 154
Table 4.13: Parameters of membranes simulated in this study ... 161
xii
Figure 1.5: Modified core-shell model for Nafion [60]. ... 16
Figure 1.6: Haubold's sandwich-like structure for Nafion® [11] ... 17
Figure 1.7: Stack of element to describe proton conductivity in Nafion® [11] ... 18
Figure 1.8: Schematic evolution of the Nafion® structure depending on the water content [63] ... 19
Figure 1.9: Schematic view of correlated polymeric aggregates domains [65] ... 20
Figure 1.10: Evolution of the membrane structure as a function of water content λ (moles of water per mole of sulfonic acid sites). The pictures are cross-sectional representations of the membrane where the gray area is the fluorocarbon matrix, the black is the polymer side chain, the light gray is the liquid water, and the dotted line is a collapsed channel [67]. ... 21
Figure 1.11: Schematically representation of the water-channel model [13]. ... 22
Figure 1.12: IV-curve (a) 23 wt% Nafion® in cathode and repartition of losses (b) at 2.5 A·cm−2 taken at (■) 0, (♦) 150, (▲)300, and (x) 440 h [16] ... 24
Figure 1.13: IV-curve (a) 33 wt% Nafion® in cathode and repartition of losses (b) at 2.5 A·cm−2 taken at (■) 0, (♦) 150, (▲)300, and (x)440 h [16] ... 24
Figure 1.14: Evolution of the cell potential under OCV conditions [71]. ... 25
Figure 1.15: Variation of the open-circuit voltage of H2/air cell during OCV durability test at 80 °C [72]. ... 25
Figure 1.16: Variation of the H2 crossover current density during OCV durability test at 80 °C [72]. . 26
Figure 1.17: Electron probe acquired X-ray images of cross-sectioned new and used MEAs (the white arrow represents the membrane thickness) [15] ... 28
Figure 1.18: Comparison of SEM micrographs for the MEA with 33 wt % Nafion® in the cathode CL before and after AST testing at 1.0 VRHE [16]. ... 29
xiii Figure 1.19: Membrane thinning measured from SEM micrographs as a function of cumulative fluoride release (▲ 23 wt % and ■ 33 wt % Nafion®
content in the cathode CL) [16] ... 30
Figure 1.20: Oxygen reduction on carbon under alkaline conditions [79]. ... 31
Figure 1.21: Estimation of H2O2 concentration in fuel cells with different membrane thickness [18] . 32 Figure 1.22: Hydroxyl radical generated in membrane in different solutions [91] ... 33
Figure 1.23: Semi-developed formula of perfluoro(3-oxapentane)-1-sulfonic-4-carboxylic diacid (molecule A) ... 34
Figure 1.24: Individual degradation reaction steps via end group unzipping [32] ... 36
Figure 1.25: Secondary degradation reaction via end group unzipping [32]. ... 36
Figure 1.26: Unzipping degradation reaction of molecule A [32]. ... 37
Figure 1.27: Catalyst agglomerate model [36] ... 37
Figure 1.28: Comparison between experimental and simulated H2O2 concentrations under different relative humidities. Operating conditions:H2//O2; Tcell =65 °C; ambient pressure [36] ... 37
Figure 1.29: Reaction pathways involving radical species in an environment containing iron ions and PFSA membrane [38]. ... 38
Figure 1.30: Reaction rates of reactions 1 and 3–13 (Figure 1.29, 13 is the reaction between ferric ions and hydrogen peroxide) at a H2O2 concentration of 0.5 mM in the presence of PFSA ionomer with a reactive end-group concentration [38]. ... 39
Figure 1.31: Evolutions of H2O2 concentrations for the base-case parameter values at the OCV: TAnode = TCathode = 60 °C, PAnode = Pcathode = 300 kPa, no side-chain cleavage, and a constant Fe 2+ concentration of 5 ppm [39]. ... 40
Figure 1.32: Voltage degradation curve of a single cell operated at 80 °C and 0.4 A·cm–2 [103] ... 41
Figure 2.1: Schematic representation of the cell model ... 48
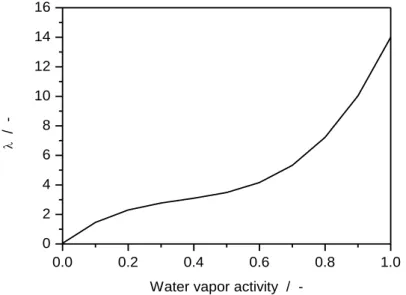
Figure 2.2: Simulated membrane water content versus water activity for a Nafion® 117 at 30 °C. ... 49
Figure 2.3: Schematic representation of the interface Electrode / Membrane (in gray color: ionomer). ... 50
Figure 2.4: Fickian diffusion coefficient values calculated with Equations 2.14, 2.15 and 2.16. ... 54
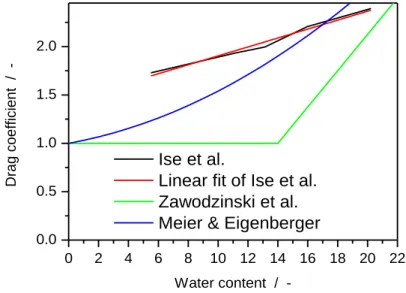
Figure 2.5: Evolution of the electro-osmotic drag coefficient with water content ... 56
Figure 2.6: Schematic representation of the causes-consequences of the chemical degradation ... 58
xiv
Figure 3.1: Structure of the S-Function implemented in Simulink to run our membrane module ... 75
Figure 3.2: MEMEPhys® model in its most evolved version [2]. ... 76
Figure 3.3: Electrode morphology and geometrical model. The Nafion® phase can be seen as an “effective Nafion®/water phase” [134]. ... 77
Figure 3.4: Schematic representation of the non-equilibrium EDL model within MEMEPhys®. Example of the anodic case: The hydrogen species arrives to the inner layer where the electron transfer reaction takes place. The proton species is produced at x = L and evacuated through x = 0. (the eventual contamination by CO and H2S pollutants is also shown but they are not treated in this PhD thesis work). ... 78
Figure 3.5: Summary of the governing equations of the DENIS model [155]. ... 90
Figure 3.6: Schematic representation of the 2D model DENIS ... 91
Figure 3.7: Detailed contributions of each cell part to the calculation of the voltage ... 91
Figure 3.8: Coupling the membrane module into MEMEPhys® ... 97
Figure 4.1: Evolution of relative humidity in GDLs and channels for different current densities at 353 K, 2 bar and 15/20 stoichiometry and 80% / 80 % RH anode/cathode. ... 104
Figure 4.2: Evolution of relative humidity in GDLs and channels for different current densities at 353 K, 2 bar and 2/4 stoichiometry and 80% / 80 % RH anode/cathode. ... 104
Figure 4.3: Steady-state water profile in the membrane for different current conditions at 353 K, 2 bar and 80% / 80 % RH anode/cathode. ... 105
Figure 4.4: Comparison of the chemical structure of Nafion® (left) and Aquivion (right) ... 108 Figure 4.5: Comparison experiment / simulation for validation of the performance model MEMEPhys®. Experiment has been carried out at 353 K, 1.5 bar, 40 % / 60 % RH anode / cathode.109
xv Figure 4.6: Comparison experiment / simulation for the hydrogen peroxide production ... 113 Figure 4.7: Hydroxyl radical generated in membrane in different solutions [91] ... 115 Figure 4.8: Evolution of the radical concentration in a Nafion® membrane starting from conditions given in Table 4.7. ... 116 Figure 4.9: Comparison experiment / simulation for the cumulative production of fluoride ion ... 120 Figure 4.10: (left) F- effluent rate from Nafion® 112 (7.2cm × 7.2cm) in 1wt% H2O2, 8 h with 10ppm
Fe2+ [158, 159], (right) Simulated evolution of the fluoride release with temperature (production of Fe2+ set to 10–3 mol·m–3·s–1, duration 500 h). ... 121 Figure 4.11: (left) Degradation rates under different temperatures (Fe2+ fixed at 30 ppm) [37], (right) Simulated evolution of the fluoride release with temperature (production of Fe2+ set to 10–3 mol·m–3·s–
1
, duration 500 h). ... 121 Figure 4.12: Evolution of the cell voltage at low current density at 0.04 A·cm–2, 2 bar, 50% relative humidity at anode and cathode, stoichiometry 8/16 anode / cathode and a production of iron ions of 2·10–5 mol·m–3·s–1. ... 123 Figure 4.13: Evolution of the water saturated vapor pressure with temperature from 0 °C to 100 °C.124 Figure 4.14: Dissolved oxygen concentration profile at 0.04 A·cm–2, 2 bar, 50% relative humidity at anode and cathode, stoichiometry 8/16 anode / cathode and a production of iron ions of 2·10–5 mol·m–
3
·s–1. ... 125 Figure 4.15: Evolution of the membrane resistance at 0.04 A·cm–2, 2 bar, 50% relative humidity at anode and cathode, stoichiometry 8/16 anode / cathode and a production of iron ions of 2·10–5 mol·m–
3
·s–1 (a) Complete signal (b) Zoom in the dashed area. ... 127 Figure 4.16: Water profile at 0.04 A·cm–2, 2 bar, 50% relative humidity at anode and cathode, stoichiometry 8/16 anode / cathode and a production of iron ions of 2·10–5 mol·m–3·s–1. ... 128 Figure 4.17:Evolution of the cell voltage at low current density at 0.04 A·cm–2, 2 bar, 50% relative humidity at anode and cathode, stoichiometry 8/16 anode / cathode and a production of iron ions of 2·10–5 mol·m–3·s–1. ... 128 Figure 4.18: Net evolution of the membrane resistance at 0.04 A·cm–2, 2 bar, 50% relative humidity at anode and cathode, stoichiometry 8/16 anode / cathode and a production of iron ions of 2·10–5 mol·m–
3
·s–1. ... 129 Figure 4.19: Evolution of the cell voltage at 0.6 A·cm–2, 2 bar, 50% relative humidity at anode and cathode, stoichiometry 8 / 16 anode / cathode and a production of iron ions of 2·10–5 mol·m–3·s–1. .. 130 Figure 4.20: Evolution of membrane resistance at 0.6 A·cm–2, 2 bar, 50% relative humidity at anode
xvi
anode and cathode, stoichiometry 8/16 anode / cathode and a production of iron ions of 2·10–5 mol·m–
3
·s–1 ... 133 Figure 4.24: Cumulative fluoride ions released by the cell at 4·10–2 A·cm–2 and different stoichiometry. ... 134 Figure 4.25: Evolution of the degradation with relative humidity at 0.04 A·cm–2, 2 bar, stoichiometry 2/4 anode / cathode and a production of iron ions of 10–3 mol·m–3·s–1. ... 135 Figure 4.26: Concentration profile of (a) O2 and (b) H2O2 in the membrane for different relative
humidity after 500 h at 0.04 A·cm–2, 2 bar, stoichiometry 2/4 anode / cathode and a production of iron ions of 10–3 mol·m–3·s–1. ... 136 Figure 4.27: Cross influence of membrane chemical degradation with current density and relative humidity (a) 50 % and (b) 90%. ... 137 Figure 4.28: Evolution of the relative humidity in the GDL in dependence on the temperature and the current density for a start condition of 50 %, stoichiometry 2 / 4. ... 138 Figure 4.29: Evolution of chemical degradation of the membrane with temperature and current density for a 50 % relative humidity and 8/16 stoichiometry. ... 139 Figure 4.30: Current profiles used for the establishment of polarization curves before and after operation of a cell 500 h at (a) 4·10–2 A·cm–2 and (b) 0.6 A·cm–2. ... 140 Figure 4.31: Evolution of cell performance over 500 h at 0.04 A·cm–2, 333 K, 2 bar, 90% relative humidity at anode and cathode, stoichiometry 2/4 anode / cathode for an iron-free system... 141 Figure 4.32: Evolution of cell performance over 500 h at 0.04 A·cm–2, 333 K, 2 bar, 90% relative humidity at anode and cathode, stoichiometry 2/4 anode / cathode with iron ions production. ... 142 Figure 4.33: Evolution of cell performance over 500 h at 0.04 A·cm–2, 363 K, 2 bar, 90% relative humidity at anode and cathode, stoichiometry 2/4 anode / cathode with iron ions production. ... 142
xvii Figure 4.34: Evolution of cell performance over 500 h at 0.6 A·cm–2, 363 K, 2 bar, 90% relative
humidity at anode and cathode, stoichiometry 2/4 anode / cathode with iron ions production ... 144
Figure 4.35: Evolution of cell performance over 500 h at 0.04 A·cm–2 and 0.6 A·cm–2, 363 K, 2 bar, 90% relative humidity at anode and cathode, stoichiometry 2/4 anode / cathode with iron ions production. ... 144
Figure 4.36: Comparison between modeling results and experimental results for the evolution of the polarization curve after 500 h at 0.6 A·cm–2. ... 145
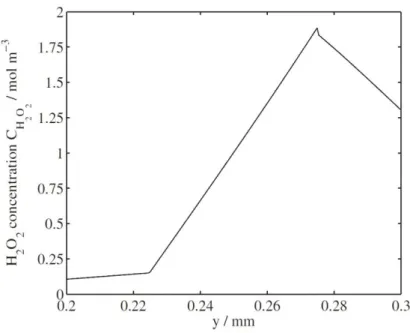
Figure 4.37: Profile of normalized concentrations along the membrane after 500 h for the species acting in the chemical degradation of the membrane at 0.6 A·cm–2, 363 K, 2 bar, 90% relative humidity at anode and cathode, stoichiometry 8/16 anode / cathode and 10–3 mol·m–3·s–1. ... 147
Figure 4.38: Current density profile used to simulate an on - off operation of a PEMFC ... 148
Figure 4.39: Evolution of the current density (a) and cell voltage (b) over time ... 149
Figure 4.40: Evolution of the water content in each compartment in the membrane. ... 150
Figure 4.41: Evolution of the membrane resistance for different operating conditions ... 151
Figure 4.42: Cumulative fluoride release for different operating conditions ... 152
Figure 4.43: Current density cycle applied to the cell (a) and response in cell voltage (b), compared to cases when the current density is kept constant. ... 153
Figure 4.44: Evolution of the water content in every compartment of the membrane during Imin–Imax cycles. ... 154
Figure 4.45: Evolution of membrane resistance under Imin–Imax cycles. ... 155
Figure 4.46: Cumulative fluoride release for different operation conditions ... 156
Figure 4.47: Dependence of the fluoride production on the iron ions production for different temperatures ... 157
Figure 4.48: F- effluent rate from Nafion® 112 (7.2cm × 7.2cm) in 1wt%H2O2, 100ºC × 8 h with iron ions [159] ... 158
Figure 4.49: Effect of Fe2+ concentration on membrane degradation [37] ... 158
Figure 4.50: Simulated evolution of the concentration of different species during degradation (500h, low current density, 363 K). ... 160
Figure 4.51: Comparison of cell voltage for different membranes at 4·10–2 A·cm–2, 333 K, 90 % relative humidity, 2 bar and 10–3 mol·m–3·s–1 Fe2+ production. ... 162
xviii
Figure 4.56: Water content profile in the membrane at EoL ... 167 Figure 4.57: Sensitivity analysis of our chemical degradation model. A positive sensitivity means that an increase of the parameter increases the degradation. A value of 1.0 means that the area specific resistance degradation is directly proportional to the parameter. ... 169 Figure 4.58: Advantages of membrane with low equivalent weight and short side chain (like Aquivion) ... 172
xix
List of Abbreviations
Abbreviation Meaning
AST Accelerated Stress Test
CCV Closed Circuit Voltage
CL Catalyst Layer
CV Cyclic Voltammetry
DAE Differential algebraic equation
DENIS Detailed Electrochemistry Numerical Impedance Simulation
DFT Density Functional Theory
DMFC Direct Methanol Fuel Cell
DMPO 5,5’-dimethyl-1-pyrroline-N-oxide
EDL Electrochemical Double Layer
EIS Electrochemical Impedance Spectroscopy
EoL End-Of-Life
ENMR Electrophoretic NMR
EPR Electron Paramagnetic Resonance
ESR Electron Spin Resonance
EW Equivalent Weight
FC Fuel Cell
FER Fluoride Emission Rate
GDL Gas Diffusion Layer
xx
MEMEPhys Modèle Electrochimique Multi-Echelle Physique
MS Mass Spectroscopy
NMR Nuclear Magnetic Resonance
OCV Open Circuit Voltage
ORR Oxygen Reduction Reaction
PBI PolyBenzImidazole
PDE Partial Differential Equation
PEMFC or PEM Polymer Electrolyte Membrane Fuel Cell
PFSA PerFluoroSulfonated Acid
PSSA Poly(StyreneSulfonic Acid)
RHE Reversible Hydrogen Electrode
ROP Rate Of Progress
RRDE Rotating Ring-Disc Electrode
SANS Small-Angle Neutron Scattering
SAXS Small-Angle X-Ray Scattering
SEM Scanning Electron Microscope
SOFC Solid oxide fuel cell
xxi
xxiii
List of Symbols
Greek
αmemb Ratio between water flux and effective water flux in the membrane / -
βe
(DENIS) Symmetry factor for the transition state / - βmemb
Proportionality coefficient between water flux into the membrane and water content difference over electrode / membrane interface / mol·m–
2
·s–1
Γ (MEMEPhys®) Dipolar surface density / D·m–2
G
i Gibbs activation energy for reaction i / J·mol–1δ Distance between proton in hydronium ion an proton-accepting water molecule / m
ε Porosity of the membrane / -
ε0 Electric permittivity of free space (=8.85·10–12 C²·J–1·m–1)
εr Relative permittivity of the membrane / -
ζ[3] (MEMEPhys®) Riemman’s function evaluated at 3 (≈1.20)
η Viscosity of water / Pa·–1
η (MEMEPhys®) Electrostatic surface potential across the adsorbed layer / V
ηs (DENIS) Electrostatic potential difference across the double layer / V
θF Final angle diffusing proton and an adjacent water molecule / -
θI Initial angle between diffusing proton and adjacent water molecule / -
θi Covering fraction of species i
λ water content or local ratio H2O/SO3 in the membrane / -
λeq
Water content in the membrane in equilibrium with the humidity in the gas phase / -
μW (MEMEPhys
®
) Dipole moment of liquid water / C·m–1
xxiv
Φ (MEMEPhys ) Electrostatic potential in the diffuse layer / V
ψ (MEMEPhys®) Electrode potential / V
Latin
O H2
a
Activity of water / -ci Concentration of specie i / mol·m–3
d (MEMEPhys®) Thickness of ad-layer / m Di Diffusion coefficient of specie i / m²·s–1
e Elementary charge (=1.60·10–19 C)
j i
E
act, Activation energy for process j of species i / J·mol–1 EW Equivalent weight of the membrane / kg·eq–1 F Faraday’s constant (= 96500 C·mol–1) Fi Flow rate of species i / mol·s–1h Planck constant (=6.62·10–34 J·s) i Current density / A·cm–2
I Absolute value of current / A
i
J
Flux of specie i / mol·s–1·m–2 J(s) Leverett J-function / -xxv kB Boltzmann constant (=1.38·10–23 J·K–1)
ki Rate constant of reaction i / s–1
Ki i
th
acidity constant of sulfuric acid / - Lmembrane Membrane length / m
lG Mean step distance for Grotthus diffusion / m
lΣ Mean step distance for surface diffusion / m
Mi Molar mass of substance i / kg·mol–1
ni Amount of substance i / mol
ns number of free sites per unit area of the metallic phase / m –2
Pi Partial pressure of species I / Pa
R Ideal gas constant (= 8.314 J·K–1·mol–1) / Resistance of the membrane / Ω r VNAFION VH2O
Rf Effective radius of fixed anion groups / m
Ri Radius of hydronium ion / m
Rw Radius of water molecule / m
s Swelling coefficient of the membrane
j
S
production term of specie j / mol·m–3·s–1 Selectrode Geometric area of electrode / m²
O H2
t
Drag coefficient of water / -T Temperature / K
Ucell Cell voltage / V
v number of water molecules surrounding one sulfonate acid group / -
i
V
Molar volume of species i / m3·mol–1 vi Rate of reaction i / mol·m–3·s–1xxvi
CL (MEMEPhys®) Compact layer
DEG Degradation
Diff Nafion® Diffusion in Nafion®
DL (MEMEPhys®) Diffuse layer
Dmj Damjanovic
dry Dry Nafion®
elde Electrode
elyt Electrolyte
EO Electro-osmotic
Far Faradic
Fick Related to Fickian diffusion
G Grotthus
gas Entire gas phase
HEY Heyrovsky
liq Liquid
m en masse
xxvii
sat Saturation
TAF Tafel
l
v
Vaporizationvap Water under vapor form
VOL Volmer
1
CHAPTER 0
Introduction
La modélisation scientifique permet de comprendre des processus via des modèles conceptuels, graphiques ou mathématiques en les partitionnant sous des formes simples.
Cette thèse aborde la thématique des piles à combustible (PAC) à membrane électrolyte poly-mère (PEMFC), qui autant d’un point de vue théorique qu’expérimental, intéresse de nouveaux groupes de recherche depuis les années 1960. Cependant les premiers travaux de modélisation ne sont apparus que 30 ans après les premiers systèmes réels, travaux réalisés par Bernardi et Verbrugge [1]. Depuis, beaucoup de modèles simulant les performances de la PAC ont été pro-posés ; en revanche les travaux s’intéressant aux évolutions à long-terme des performances sont minoritaires, ce genre d’évolution faisant plutôt l’objet d’une approche expérimentale en effec-tuant des tests de PAC sur des durées de l’ordre de 1000 heures.
La compréhension des phénomènes de dégradation est un aspect essentiel dans le développement de nouveaux matériaux, de nouvelles structures ou dans l’établissement de modes de fonction-nement optimisés visant à améliorer la durée de vie des systèmes. Les outils analytiques dispo-nibles permettent d’identifier les origines des défaillances. A partir de ces observations, il est possible d’établir des modèles permettant de simuler un comportement de plusieurs centaines d’heures en un temps réduit, ce qui est le vrai atout de la modélisation. De plus la modélisation permet d’obtenir des informations relatives à des phénomènes apparaissant à une faible échelle spatiale et temporelle.
Dans la littérature, peu de modèles proposent la prise en compte de l’évolution des propriétés structurales et de l’évolution des performances de la cellule. Franco et al. a propose une ap-proche prenant en compte l’interaction de processus de dégradation et de l’évolution des per-formances de la cellule [2-5]. Peu de travaux de modélisation traitent de la dégradation de la membrane dans les PAC, et ceux proposés montrent de grandes différences dans les résultats, et leur domaine de validité reste restreint.
L’objectif de cette thèse est de fournir à la communauté scientifique un modèle physique décri-vant la dégradation chimique des membranes acide perfluorosulfonique lors de leur application
3
0 Introduction
0.1 What is modeling? Why using modeling in fuel cell technology?
Scientific modeling is the process of generating abstract, conceptual, graphical and/or mathematical models. Science offers a growing collection of methods, techniques and theory about all kinds of spe-cialized scientific modeling. A scientific model can provide a way to read elements easily which have been broken down to a simpler form [6].
When this thesis started in 2009 and still now 3 years later, there was still a large diversity of experi-mental and modeling efforts made by different scientific groups all around the world to understand the chemical degradation of the membranes during the operation of polymer electrolyte membrane fuel cell (PEMFC). Modern PEMFC were founded at the beginning of the 1960s, but the first complete modeling work was published 30 years later, at the beginning of the 1990s by Bernardi and Verbrugge [1]. Since then, many performance models were published and presented. However modeling efforts to study degradation phenomena were not so numerous, groups focusing rather on modeling instant formance than long-term performance loss [7]. This field was let to experimental groups who per-formed tests over more than 1000 hours in order to observe the impact of the degradation on the cell performance.
The understanding of the degradation phenomena in PEMFC technology is a key aspect towards the proposal of solutions in the choice of new materials, new components structures, manufacturing pro-cesses or operating conditions for enhanced system durability. Over the years, analytic tools became more and more precise and allow nowadays identifying the causes of the cell failure. The main draw-back of this remains the time required to perform one single experiment, as unlike in modeling simula-tions, one minute in real life last one minute. Modeling proposes, in a shorter time, to provide an ap-proached result to that one obtained by experiment. Indeed, where experimental work requires a cer-tain amount of time and costs, a simulation, once it has been validated, proposes predictions and trends of the results within hours and is a way to reduce the “try-and-error” of experimental work and thus to save money.
Moreover, some phenomena are still unknown or are taking place on such a small temporal and spatial scale and space scale, that they cannot be seen by direct experimental observation. Modeling in such cases provides an interesting solution as well.
4
of the different observables. This limits their uses and validity.
The first goal of this thesis is to provide a physical model describing the chemical degradation of a perfluorosulfonated acid (PFSA) membrane for fuel cell use (for example Nafion®). Then a second objective is to couple this chemical degradation model with the structural and physical parameters which are characteristic of the membrane. Finally, a third objective is to include the two submodels into a complete cell model so that makes possible to get a feedback between instantaneous perfor-mance, degradation and evolution of the membrane structure. We try to build up the model as precise as possible so that different operating conditions and cell designs can be simulated and that the results and trends given by the model are as reliable as possible.
5
CHAPTER 1
Context and
motivation of this thesis: Degradation of
the membrane in PEMFCs
La PAC est un système convertissant l’énergie chimique des réactions d’oxydation de l’hydrogène à l’anode et de réduction de l’oxygène à la cathode en énergie électrique et en éner-gie thermique. Cette technoloéner-gie est considérée comme propre en raison de la seule présence d’eau comme sous-produits. Elle est constituée de deux électrodes (l’anode et la cathode) sépa-rées par une membrane permettant entre autre le transport de protons entre les électrodes. L’acheminement des gaz à la surface des électrodes ainsi que le transport des électrons vers l’extérieur est assuré par la présence conjointe des plaques bipolaires dans lesquelles sont gravés des canaux ainsi que de couches de diffusion des gaz.
Selon les utilisations faites de la PAC, différents types de membrane peuvent être utilisés. Celles-ci présentent des températures de fonctionnement différentes. Dans le cadre de la PEMFC fonc-tionnant à basse température (jusqu’à 90 °C), une des familles de membrane les plus utilisés est celle des membranes à acide perfluorosulfonique, dont le représentant le plus ancien et le plus connu est le Nafion, inventé dans les années 1960. Ces membranes sont composées d’un squelette similaire au Téflon sur lequel sont branchés des chaînes pendantes portant une fonction acide perfluorosulfonique. Ces membranes présentent une grande stabilité chimique, thermique et mécanique, sont imperméables à la diffusion des gaz et permettent un transport optimal des protons.
Bien que largement utilisée dans la technologie actuelle, ces membranes n’en demeurent pas moins une énigme pour les scientifiques pour toutes les questions relatives à l’organisation des chaînes de polymère au sein de la membrane et les mécanismes exacts de diffusion observés dans la membrane. Dans la littérature, plusieurs modèles ont été proposés afin de rendre compte le plus fidèlement possible de la structure exacte du Nafion et des membranes PFSA d’une manière générale, structure qui demeure à ce jour toujours inconnue [10-14]. Le fait de ne pas connaître la structure nanoscopique exacte des membranes n’est cependant pas un frein à l’étude macros-copique des membranes, plus particulièrement dans le cadre de cette thèse des aspects de
dégra-6
réduction partielle de l’oxygène à la cathode ou d’une réaction chimique entre l’hydrogène et l’oxygène à l’anode. La présence d’oxygène est expliquée par le caractère partiellement impar-fait de la membrane, celle-ci laissant diffuser entre les électrodes une partie des gaz. Quelques groupes de recherche se sont penchés sur la quantification du peroxyde d’hydrogène produit dans une cellule lors de son fonctionnement ainsi que lors de manipulation ex-situ, en particulier grâce à la technique d’électrode tournante [17-19].
En présence d’ions fer, dont l’origine dans la PAC reste discutée, le peroxyde d’hydrogène se décompose en radicaux, entre autre hydroxydes. L’étude de cette décomposition fait l’objet de nombreuses études, elle est utilisée notamment dans le traitement des eaux usées, les radicaux étant des espèces extrêmement réactives et pouvant oxyder la matière organique réfractaire dans les eaux usées [20-26]. L’étude de ces réactions entre ions fer et peroxyde d’hydrogène se nomme la chimie de Fenton. La durée de vie de ces espèces étant extrêmement courte (de l’ordre de la microseconde), leur mise en évidence et quantification ne peut se faire qu’en piégeant les radicaux en les faisant réagir avec des molécules spécifiques [27-30]. La quantification se fait ensuite par des méthodes spectroscopiques.
Lors de la synthèse de membranes PFSA, il est possible que des fonctions intermédiaires de réac-tion soient encore présentes. Ces foncréac-tions peuvent pas exemple être de type acide carboxylique. De telles fonctions sont sujettes à réagir avec les radicaux. Ce genre de réaction est l’initiation de la dégradation chimique de la membrane. Les produits ultimes de dégradation sont le dioxyde de carbone, les ions sulfates et les ions fluorure [31, 32]. La méthode classique de suivi de la dé-gradation de la membrane est la mesure de la concentration des ions fluorures dans l’eau en sortie de piles.
D’un point de vue modélisation, peu de travaux ont été proposés, la plupart du temps se focali-sant sur un des points mentionnés précédemment. Xie et Hayden proposent un mécanisme réac-tionnel basé sur l’analyse de fragments organiques dans la membrane [32]. Ce mécanisme reflète bien les observations expérimentales et est à ce jour le mécanisme communément admis par la
7 communauté. Ces travaux ne permettent cependant pas de relier le fonctionnement de la pile à combustible à la dégradation même de la membrane. Chen et Fuller ont publié de nombreux travaux sur la dégradation chimique dans les piles à combustibles [33-37]. Un de leurs axes de recherche est la formation de peroxyde d’hydrogène dans la PAC [33, 36]. Ils ont publié entre autres un modèle de production de H2O2, incluant transport d’oxygène, en utilisant une
struc-ture d’agglomérats pour les électrodes. Cependant ce modèle ne prend pas en compte le devenir des molécules de peroxyde d’hydrogène dans la cellule. Gubler et al., quant à eux, ont publié des travaux se focalisant sur le devenir de ces molécules de peroxyde d’hydrogène, notamment lors de leur décomposition en radicaux selon plusieurs réactions lors de la chimie de Fenton puis de l’attaque de ces radicaux sur la membrane PFSA en elle-même [38]. Cependant, ces précédents modèles ne reflètent pas le fonctionnement complet d’une cellule. Shah et al. ont publié des tra-vaux prenant en compte à la fois les aspects thermique, fluidiques ainsi que les phénomènes de dégradation chimique dans la membrane [39]. Ce modèle discrétisé 1D leur permet de faire des prédictions de profils de concentration selon l’épaisseur de la membrane. Cependant, la prise en compte de cette dégradation sur les performances de la cellule n’est pas prise en compte, ce qui justifie l’utilité de cette thèse aux yeux de la communauté scientifique.
8
Reaction 1.2 are the half-cell reactions occurring in the electrodes, leading to Reaction 1.3 (Figure 1.1).
Half-cell reaction at the anode H2 2 H+
+ 2 e− Reaction 1.1 Half-cell reaction at the cathode O2 + 4 H+
+ 4 e−
2 H2O Reaction 1.2Global reaction in the cell
O H O 2 1 H2 2 2 Reaction 1.3
PEMFCs have a broad application field. Even if currently their usage is still limited to prototypes and niche markets, they have a promising future. They can be used at all sizes and power ranges:
Transport applications: Power supply in automotive, aircraft and space
Stationary applications: Power supply for, for example, small houses (remote locations)
9 Figure 1.1: Basic diagram of a PEMFC [40]
1.1.2 Components of a PEMFC
Materials and design of a cell are very important because they are the main factors determining the performance and the life-time of a cell.
We can identify three groups of components in a typical cell:
Components providing a good fuel feed: Bipolar plate and gas diffusion layer (GDL)
Components allowing the reaction of the gases: Electrodes
Component ensuring isolation and proton exchange between the electrodes: Electrolyte (or membrane)
The combination of the membrane and the electrode is abbreviated under membrane electrode assem-bly (MEA).
Every component is made of a different material or combination of materials. Table 1.1 summarizes the different types of material that can be used in the PEMFCs.
10
Ionomer: same material as the corre-sponding electrolyte
Protonic conductivity Membrane /
Elec-trolyte / Separator
PFSA: Nafion®, Hyflon…
Phosphoric acid doped polybenzimid-azole (PBI)
Impermeable to gases
High protonic conductivity
Chemical, thermal and me-chanical stability
Table 1.1: Materials and properties of the PEMFC components
GDLs, whose thickness lies in generally between 100 and 300 µm, have two functions. Firstly they allow a good diffusion of the gases to the active site in the electrodes and secondly they are one of the links in the chain of the conduction of electron from the anode to the cathode. Thus they have to be conductive and porous. Moreover they have a key role in the water management in the membrane because they must both humidify the membrane and allow water removal (prevention of the water flooding at the cathode side at high current density).
Bipolar plates are often made of high-density graphite, but gold-coated steel can be for example used as well. Their main role is the distribution of gases over the whole surface of the electrode and the conduction of the excess water outside of the system. They are also current collectors. Electrons flow through the GDL at the anode to the bipolar plate, then go through an external circuit and arrive at the bipolar plate at the cathode. At a stack level, it is the junction element separating the cathode of a cell from the anode of the following one. The fluid transport is achieved through micro-channels (width ≈ 0.8 mm). The geometry of the channel is very important because it will ensure a homogenous gas sup-ply in the cell, as it can be seen in Figure 1.2.
11 Figure 1.2: Examples of flow field used at the laboratory scale
In PEMFCs, the electrodes are based on precious metals. These precious metals represent the lightest part of the whole electrode material but they are the most important because of their catalytic proper-ties. The most commonly used catalyst is platinum Pt. The amount of Pt in a single cell varies from 0.1 to 1 mg·cm−2. It could be used under a pure form, but for economic reasons, it is deposited on small particles of active coal with very high specific area. Their role is to catalyze the hydrogen oxidation reaction (HOR) (resp. oxygen reduction reaction (ORR)) at the anode (resp. cathode). Electrodes are very expensive because of the use of Pt (on 2nd of February 2012 39.50€/g). However, only a small area of Pt is effectively used (20 % to 30 % of the metal). Therefore efforts are made to control and to improve the geometry of the electrode structural properties (for example by electrode deposition) [41]. One other area of research is the development of Pt-based alloys in order to reduce the cost without reducing performances.
The electrolyte is characteristic for each kind of fuel cell. We focus our attention only on the PEMFC thus we will mention here only its electrolyte. For low-temperature fuel cells, PFSA membranes are mostly used. The first materials available in the early 60s were sulfonated polystyrene membranes. These were rapidly replaced from 1966 by Nafion®, developed by the company Du Pont de Nemours, but over the years many other companies developed their own PFSA membrane (for example Solvay Solexis, 3M, Gore…). These membranes are ion exchanger. They permit the permeation of cations, like hydronium ions H3O
+
and water can move within the membrane. Another essential function of the membrane is the separation of the gases to prevent any chemical short circuit (that means ORR and HOR taking place at the same electrode, in that case electrons will not have to flow through the exter-nal circuit). Moreover the membrane should not be electrically conductive. PFSA membranes operate
12
1.2.1 An enigma for modelers and polymer scientists
Nafion® ionomers are developed by the company Du Pont de Nemours since the early 1960s. These materials are the result of the copolymerization of tetrafluorethylene (TFE, also known as Teflon) with a perfluorinated vinyl ether comonomer. A common representation for an elementary unit of Nafion® polymer is given in Figure 1.3. This copolymerization is not well-controlled and there is no clue to determine if the distribution of the side chain is uniform on the back bone [43, 44]. For this reason, the concept of equivalent weight (EW) has been introduced. It is defined as the weight of dry Nafion® per mol of sulfonate acid groups and corresponds to the quantity of polymer needed to neutralize one equivalent of base. This value is linked to the ion-exchange capacity (IEC) through
IEC
EW 1000. Equation 1.1
The official nomenclature chosen for Nafion® membrane is following: The two first numbers corre-spond to the EW. For example for Nafion® 112, the EW is 11·100 g·eq–1, 1100 g/eq. The last number (in this example 2) corresponds to the membrane thickness in milli-inches (mil). 1 mil represents 25.4 µm, thus Nafion® 112 has a thickness of about 50 µm.
Experimentally the EW can be for example measured by acid-base titration. From the Figure 1.3, we see that the structure of Nafion® is governed by the choice of 4 indices, determined by the comonomer chosen during the synthesis. x indicates also how many –CF2- groups are present on the back bone
13 Figure 1.3: General formula of a PFSA membrane
Usually, y is taken equal to 1, n as well. The value of n depends on the comonomer which was used. From the value of the equivalent weight and the knowledge of the formula of the monomers, one can obtain the value of x via Equation 1.2. The establishment of this relation is given in Appendix A.
100 81 · 50 · 166 · 81 EW - y m n x Equation 1.2In the literature, there is no report about measuring the molecular weight of the membrane as it is common to be done for macromolecules and polymers, for example with the technique of gel permea-tion chromatography. This impossibility is due to the property of Nafion® that it does not form true solutions: Nafion® is rather a suspension and thus cannot permeate in chromatography [45].
In the following parts of this thesis, we will use the previously explained nomenclature for Nafion® designation. Table 1.2 shows the properties of some commercial membranes. We see that the range of thickness, equivalent weight and structure is very broad.
14 Flemion-R 1000 50 m=0; x=1.5-14; n=2-5 Asashi Chemi-cals Aciplex-S 1000-1200 25-100
m=0; x=3.6-10; n=2 Dow Chemicals Dow 800 125
m=0; x=5-13.5; n=2; y=1 Solvay Solexis Aquivion E87-03 870 30
Aquivion E87-05 870 50
Aquivion E87-10 870 100
Aquivion E79-03 790 30
Aquivion E79-05 790 50
Table 1.2: Parameters of some commercial PFSA membranes (when no value for a parameter is given, this means that the parameter is not present in the chemical structure of the ionomer)
While macroscopic properties give some insight into the microstructure, no direct precise observation is to date available concerning the exact microstructure of Nafion®. Such knowledge would be a real breakthrough for researchers on PEMFC. Indeed, key parameters for PEMFC operation such as water management, proton conductivity, and electro-osmotic drag are closely linked to the chemical struc-ture and the morphology of the electrolyte. As no direct observation or analytical method can be used to see behavior of Nafion®, indirect methods are carried out to derive models and assumptions on Nafion® structure.
1.2.2 Analytical methods for morphology determination of Nafion®
15 bones (Teflon skeleton) and hydrophilic side chains (the ionic sulfonate head). Thus the study of the morphology of Nafion® has to be done in regards to the water content in the membrane.
Many analytical methods have been used to analyze structural properties of Nafion®, but scientists always kept in mind that their conclusions about the structure of Nafion® are relevant only if they are put into correlation with the hydration of the membrane.
The first step after having synthesized a new material is its characterization. The molecular formula can be determined by nuclear magnetic resonance (NMR). In the case of Nafion®, such measurements were presented in the literature [46-49]. This technique is used since the beginning of the 80s to de-termine the molecular structure of synthesized Nafion® [47]. NMR allows knowing which atom groups are located in the molecule and which groups are locate in their vicinity. In fact, the structure of Nafion® was assumed knowing the comonomer and the Teflon structure, and, NMR confirmed the molecular formula. This technique is still not sufficient to advance conclusions about the morphologi-cal structure of this polymer.
A powerful technique to inquire indirectly through Nafion® is the uses of X-rays and neutrons. This technique is since the 70s one of the most used to study Nafion®. Such measurements were carried out under every possible experimental condition [11, 50-54]. But it is here neither the purpose to present an exhaustive list of the every paper dealing with small-angle X-ray scattering (SAXS), small-angle neutron scattering (SANS) and wide-angle X-ray diffraction (WAXD) nor detailing these very com-plex analytical methods.
We rather focus on some of the most cited and recognized papers which offered new insights and pro-posals about the Nafion® structure.
Gierke et al. were one of the pioneer researchers in this field [10]. He examined and compared the morphological features of Nafion®, having a range of EW, in the unhydrolyzed sulfonyl fluoride pre-cursor form, the hydrolyzed sulfonyl acid form and the neutralized metal sulfonate form. From SAXS experiment they observed evidences for crystalline structure within the fluorocarbon matrix. With a hydrolyzed form of Nafion®, they found evidences characteristic of a system containing ionic clusters within a semicrystalline matrix [55]. Based on further SAXS and WAXD analysis with the observa-tion of two scattering peaks on the profiles and considering the three most prevalent models for the morphology of ionomers at the time, including a model of spherical clusters on a paracrystalline lat-tice, a core-shell model, and a lamellar model, Gierke and co-workers concluded that the water-swollen morphology of Nafion® was best described by a model of ionic clusters that were approxi-mately spherical in shape with an inverted micellar structure [10, 56]. In consideration of the high ionic permselectivity and the requirement of a percolation pathway for ionic transport in Nafion® membranes, the spherical ionic clusters were further proposed to be interconnected by narrow
chan-16
Figure 1.4: Cluster-network model from Gierke [59].
Fujimura et al. performed SAXS and WAXD experiments as well in order to define the morphological origins of the two scattering peaks. In order to analyze the effect of ionic interactions due to the side chain, they neutralized chemically the sulfonated groups of the side chain into sulfonyl chloride, simi-lar to Nafion® but nonionic [60, 61]. Like Gierke, Fujimura found two scattering maxima at s = 0.07 nm and 0.3 nm−1 (s is scattering vector, defined as s= 2·sin(θ) / λ) which were attributed to crystalline and ionic domains. They also concluded from their measurements that the crystallinity of a Nafion® whose EW is 1100 g·mol−1 was 23% and 18-14% crystalline in the nonionic and carboxylated forms, respectively. The low angle scattering maximum at s = 0.07 nm−1 was supposed to be an average spac-ing between crystalline lamellar plate. At higher humidification, the cluster dimension is shown to increase. Fujimura et al concluded that the observed behavior can be the best described by an intra-particle core-shell model [60]. A schematically representation is given in Figure 1.5.
17 Haubold et al. proposed a variation of the lamellar model of Litt as presented in Figure 1.6 [11, 62]. They performed SAXS studies for that. They observed the usual peak at 1.4 nm−1. The scattering cross section data was fitted to a layered model whose structure element is a “sandwich”. The outer portion (shell) is composed by the side chains and the core is a liquid phase with water (and methanol in their case – Direct Methanol Fuel Cell (DMFC) conditions). In order to provide channels for the proton transport along the membrane, the “sandwiches” were stacked in a linear fashion so that the liquid core regions are contiguous as shown in Figure 1.7 [58].
18
Most of these models regard fully-humidified membranes. Gebel proposed a conceptual description for the swelling and dissolution process, as shown in Figure 1.8. In this qualitative model, the dry membrane is considered to contain isolated, spherical ionic clusters with diameters of 1.5 nm and a center-to-center separation distance of 2.7 nm. With the absorption of water, the clusters swell to hold pools of water surrounded by ionic groups at the polymer water interface in order to minimize the interfacial energy. As the water content increases to a water volume fraction between 0.3 and 0.5, structural reorganization occurs to keep constant the specific surface area, and the onset of percolation is achieved by the formation of connecting cylinders of water between the swollen, spherical clusters. At water volume fraction values greater than 0.5, an inversion of the structure occurs such that the structure resembles a connected network of rods (inverted micelles). Finally, as the membrane “dis-solves” into solution, the rodlike structures separate to yield a colloidal dispersion of isolated rods [58].
19 Figure 1.8: Schematic evolution of the Nafion® structure depending on the water content [63]
In the continuity of this work, Rubatat et al combined neutron and X-ray scattering techniques, and extended the range of X-ray scattering by using Ultra SAXS [12]. They collected scattering data from Nafion® samples at various water contents. Maxima positions and shapes of scattering profiles were similar to what other groups previously reported in the literature. This observation supported the as-sumption that the swelling process involves a dilution of the scattering entities, and not a strong struc-tural reorganization as previously proposed [63]. This dissociation was partial and continuous over the whole swelling process [64]. Although the real description should be more complex, the assumption of Rubatat that the Nafion® membrane was composed of an assembly of bundles of fibrils (as displayed in Figure 1.9) allowed them to analyze the anisotropic scattering spectra observed when a strain is applied on the membrane. They assumed the morphology of Nafion® as a mixture between amorphous phases and ordered phases, whose dimensions were derived from USAXS and organization by the ionomer peak on measured profiles.
20
Figure 1.9: Schematic view of correlated polymeric aggregates domains [65]
Weber and Newman treated the Hsu and Gierke cluster-network model as an idealization of the Yeager and Steck model, where the pathways between the clusters are the interfacial regions [14, 57, 66]. The main focus of the model is how the membrane structure changes as a function of water con-tent, where λ is the moles of water per mole of sulfonic acid sites (Figure 1.10). In the first step, the dry membrane absorbs water in order to solvate the acid groups. The initial water is associated strong-ly with the sites, and with the addition of more water in the membrane, the water becomes less bound, and inverted micelles form in the polymer matrix. With more water uptake, these clusters grow and form interconnections with each other. The connections, or collapsed channels, are transitory and have hydrophobicities comparable to the matrix. The cluster-channel network forms based on a percolation-type phenomenon of the clusters; therefore, to form a transport pathway, the clusters must grow and be close enough together to be linked by the collapsed channels [67].
21 Figure 1.10: Evolution of the membrane structure as a function of water content λ (moles of water per mole of sulfonic acid sites). The pictures are cross-sectional representations of the membrane where the gray area is the fluorocarbon matrix, the black is the polymer side chain, the light gray is the liquid water, and the dotted line is a collapsed channel [67].
A more recent structure was proposed by Schmidt-Rohr and Chen, as schematically presented in Fig-ure 1.11 [13]. Using simulations tools (they developed a new algorithm for simulating SAXS meas-urements), they proposed a novel structure named the parallel water-channel model. This model ex-plains the scattering data of unoriented samples and of oriented films or fibers with their exclusively meridional intensity for both the ionomer peak and the small-angle upturn. The stiffness of the helical backbone segments, which has been confirmed by NMR, can stabilize the long cylindrical structures [48, 49, 68, 69]. A rationale for the supposed regular alternation between clusters and channels in Gierke’s model was never given. The parallel water-channel model shows that the previously elusive channels by themselves fully account for the ionomer peak, without spherical clusters. The water-channel model naturally accounts for many of the outstanding properties of Nafion®, in particular its high proton conductivity and water permeability.
22
Figure 1.11: Schematically representation of the water-channel model [13].
1.3 Chemical degradation of the electrolyte in PEMFCs: Experimental evidence
The performance decay or the failure of a PEMFC may have several causes. Each part of the cell may be the cause of the failure and it is almost impossible to predict a priori which component would fail at first. This explains why lot of efforts have been made to separate each degradation phenomena and its effects on the cell, from the mechanical stresses on the GDL under the gas channel of the end plate to the electrochemical degradation of the catalyst and the carbon support within the electrodes. We focus here on the experimental work carried out in order to observe and underline the effect of the chemical degradation on the membrane and the global effect induced to the performance of the cell.
Several analytical techniques are currently used in the research on chemical degradation of membrane. It is possible to distinguish these methods with different criteria, for example, destructive / non-destructive methods, in-situ / ex-situ methods, direct / indirect methods, dynamic / post-mortem meth-ods. We present here some of the evidences of the chemical degradation and the analytical tools neces-sary to the observation and explanation of the degradation phenomena.
1.3.1 Loss of cell performance over time
Most of the experimental reports which can be find reports that the degradation is more important under open-circuit condition (OCV) than under a current load [70]. For this reason, most of the work made on chemical degradation of PFSA membrane was carried out at OCV. However some groups studied the impact of the cell potential on the chemical degradation.
![Table 1.3: Evolution of membrane thickness of Nafion ® membranes exposed in H 2 or O 2 for 1000 h (after [71])](https://thumb-eu.123doks.com/thumbv2/123doknet/12855268.368194/58.892.110.787.225.750/table-evolution-membrane-thickness-nafion-membranes-exposed-h.webp)
![Figure 1.19: Membrane thinning measured from SEM micrographs as a function of cumulative fluo- fluo-ride release (▲ 23 wt % and ■ 33 wt % Nafion ® content in the cathode CL) [16]](https://thumb-eu.123doks.com/thumbv2/123doknet/12855268.368194/61.892.186.693.109.603/figure-membrane-thinning-measured-micrographs-function-cumulative-release.webp)
![Figure 1.21: Estimation of H 2 O 2 concentration in fuel cells with different membrane thickness [18]](https://thumb-eu.123doks.com/thumbv2/123doknet/12855268.368194/63.892.213.674.492.870/figure-estimation-concentration-fuel-cells-different-membrane-thickness.webp)
![Figure 1.29: Reaction pathways involving radical species in an environment containing iron ions and PFSA membrane [38]](https://thumb-eu.123doks.com/thumbv2/123doknet/12855268.368194/69.892.192.704.223.503/figure-reaction-pathways-involving-radical-environment-containing-membrane.webp)
![Figure 2.10: Simplified picture of structure and proton transfer in Nafion ® in fully hydrated state [131]](https://thumb-eu.123doks.com/thumbv2/123doknet/12855268.368194/97.892.229.672.553.825/figure-simplified-picture-structure-proton-transfer-nafion-hydrated.webp)
![Figure 3.3: Electrode morphology and geometrical model. The Nafion ® phase can be seen as an “ef- “ef-fective Nafion ® /water phase” [134]](https://thumb-eu.123doks.com/thumbv2/123doknet/12855268.368194/108.892.219.678.176.457/figure-electrode-morphology-geometrical-model-nafion-fective-nafion.webp)