Publisher’s version / Version de l'éditeur:
Journal of Fire Protection Engineering, 18, 3, pp. 165-198, 2008-08-01
READ THESE TERMS AND CONDITIONS CAREFULLY BEFORE USING THIS WEBSITE. https://nrc-publications.canada.ca/eng/copyright
Vous avez des questions? Nous pouvons vous aider. Pour communiquer directement avec un auteur, consultez la
première page de la revue dans laquelle son article a été publié afin de trouver ses coordonnées. Si vous n’arrivez pas à les repérer, communiquez avec nous à PublicationsArchive-ArchivesPublications@nrc-cnrc.gc.ca.
Questions? Contact the NRC Publications Archive team at
PublicationsArchive-ArchivesPublications@nrc-cnrc.gc.ca. If you wish to email the authors directly, please see the first page of the publication for their contact information.
NRC Publications Archive
Archives des publications du CNRC
This publication could be one of several versions: author’s original, accepted manuscript or the publisher’s version. / La version de cette publication peut être l’une des suivantes : la version prépublication de l’auteur, la version acceptée du manuscrit ou la version de l’éditeur.
For the publisher’s version, please access the DOI link below./ Pour consulter la version de l’éditeur, utilisez le lien DOI ci-dessous.
https://doi.org/10.1177/1042391507080812
Access and use of this website and the material on it are subject to the Terms and Conditions set forth at
Investigation of the performance of emergency ventilation strategies in the event of fires in a road tunnel - a case study
Kashef, A.; Bénichou, N.
https://publications-cnrc.canada.ca/fra/droits
L’accès à ce site Web et l’utilisation de son contenu sont assujettis aux conditions présentées dans le site LISEZ CES CONDITIONS ATTENTIVEMENT AVANT D’UTILISER CE SITE WEB.
NRC Publications Record / Notice d'Archives des publications de CNRC:
https://nrc-publications.canada.ca/eng/view/object/?id=6ef7410f-99ab-458f-84d4-cf791fb8a0bc https://publications-cnrc.canada.ca/fra/voir/objet/?id=6ef7410f-99ab-458f-84d4-cf791fb8a0bc
http://irc.nrc-cnrc.gc.ca
I n v e s t i g a t i o n o f t h e p e r f o r m a n c e o f
e m e r g e n c y v e n t i l a t i o n s t r a t e g i e s i n t h e e v e n t
o f f i r e s i n a r o a d t u n n e l – a c a s e s t u d y
N R C C - 5 0 5 8 8
K a s h e f , A . ; B é n i c h o u , N .
A version of this document is published in / Une version de ce document se trouve dans: Journal of Fire Protection Engineering, v. 18, no. 3, Aug. 2008, pp. 165-198 doi:
10.1177/1042391507080812
The material in this document is covered by the provisions of the Copyright Act, by Canadian laws, policies, regulations and international agreements. Such provisions serve to identify the information source and, in specific instances, to prohibit reproduction of materials without written permission. For more information visit http://laws.justice.gc.ca/en/showtdm/cs/C-42
Les renseignements dans ce document sont protégés par la Loi sur le droit d'auteur, par les lois, les politiques et les règlements du Canada et des accords internationaux. Ces dispositions permettent d'identifier la source de l'information et, dans certains cas, d'interdire la copie de documents sans permission écrite. Pour obtenir de plus amples renseignements : http://lois.justice.gc.ca/fr/showtdm/cs/C-42
Investigation of the Performance of Emergency Ventilation Strategies
in the Event of Fires in a Road Tunnel – A Case Study
Ahmed Kashef1 and Noureddine Bénichou National Research Council of Canada
Building M59, 1200 Montreal Road Ottawa, Ontario
Canada K1A 0R6
ABSTRACT
A research project has been conducted at the National Research Council of Canada (NRC) to evaluate the effectiveness of in-place emergency ventilation strategies to control smoke spread in the event of a fire in the Louis-Hippolyte-La Fontaine road tunnel. Some of these strategies date back to the design of the tunnel (1964). Following a recent fire, the operating instructions were revised. A scientific based evaluation of these operation instructions is the main objective of the current study. The research includes both numerical and experimental studies. The numerical study uses the Fire Dynamic Simulator (FDS) model to investigate smoke ventilation in tunnels. The experimental study is used to provide the necessary initial and boundary conditions for the Computational Fluid Dynamics (CFD) model.
A parametric study is performed, using the FDS model, assuming a heat source of 20 MW in the tunnel. Two fires scenarios, deemed to cover the two main situations probable to occur in the tunnel, are simulated. The parameters examined are the capacity of ventilation fans and the percentage opening of the vents dampers. The results of the numerical analyses indicated that the phenomenon of “backlayering” did not occur in all simulated cases. The backlayering phenomenon is defined as the situation in which the smoke moves against the provided ventilation upstream of the fire creating an environment that poses a danger to both tunnel users and emergency responders.
While the existing ventilation strategies are, in general, deemed acceptable, the current paper proposes recommendations in order to further improve the performance of the ventilation strategies in the tunnel. These recommendations have inspired the tunnel authorities to conduct a series of feasibility studies to re-engineer the ventilation system and refit the service galleries for the improvement of level of safety of means of evacuation of the tunnel.
Key words: emergency ventilation system (EVS), emergency ventilation strategies,
road tunnels fires, smoke movement, backlayering phenomenon, CFD (Computational Fluid Dynamics), FDS (Fire Dynamic Simulator).
INTRODUCTION
Fires in tunnels pose major safety issues and challenges to the designer, especially with the increase in the number of tunnels, their length and number of people using them. The main fire safety issues include [ , ]1 2: safe evacuation of people inside the tunnel, safe rescue operations, minimal effects on the environment due to the release of combustion gases, and a minimal loss of property.
In a tunnel environment, life can be threatened in a number of ways: the inhalation of combustion products such as carbon monoxide and carbon dioxide, and the exposure to high temperatures and heat fluxes. Temperatures up to 1350oC [ ]3 and heat fluxes in excess of 300 kW/m2[ ]4 can be generated within a few minutes of ignition in certain types of fires. Furthermore, evacuation can be significantly hindered by poor visibility, power failure, blocked exits due to traffic jams or crashed vehicles, or obstruction resulting from a collapse or explosion in the tunnel. For safe evacuation, viable temperatures, acceptable visibility, and air quality must be maintained in the tunnel. The provision of a safe egress route that is free of smoke and hot gases is the main objective for an emergency ventilation system (EVS). Methods of controlling contaminants and smoke from a fire in a tunnel using EVS include longitudinal airflow, smoke extraction and smoke dilution. Tunnel operators must implement a strategy of smoke removal, which consists of selecting a sequence of fan operation. When the fire department arrives at the fire scene, the operator must cooperate and modify, as needed, the fan operation in order to facilitate access to the site.
In the event of a fire, the airflow in a tunnel is modified and becomes highly unsteady. The modifications are due to the fire itself, the operation of the EVS, and the change in the traffic flow in the tunnel. The smoke progress and its degree of stratification depend mainly on the airflow in the tunnel. With no airflow in the fire zone, the smoke moves symmetrically on both sides of the fire [ ]5. The combined effects of convective heat exchange with tunnel walls and the mixing between the smoke and the fresh air layer causes the smoke to cool down and lose its stratification. Other parameters that affect
the smoke flow [ ]5 and stratification are: heat release rate, natural ventilation, tunnel slope and traffic flow.
Establishing airflow requirements for roadway tunnels and consequently the capacity of the EVS is a challenging task due to the difficulty of controlling many variables. These include changes in traffic patterns and operations during the lifetime of the facility.
A study has been conducted at the National Research Council of Canada (NRC) to evaluate the performance of the EVS in the event of a fire in the Louis–Hippolyte–La Fountaine road tunnel. The study aims at assessing the ability of in-place emergency ventilation strategies to control smoke spread and minimize its impact on tunnel users. The study also attempts to recommend guidelines for improving the ventilation operation to maximize intervention effectiveness.
Airflow measurements and fire tests were conducted in the tunnel. The initial airflow measurements were used to establish the ventilation scenarios for the fire tests and to provide input data for the Computational Fluid Dynamics (CFD) model. Two fire tests were conducted in the tunnel using a clean-burning propane system that produces minimal visible smoke. Artificial smoke was added for visualization purposes.
All CFD simulations were carried out in the absence of traffic in the tunnel. It is assumed that the traffic downstream of the fire would be cleared shortly after the eruption of the fire. Thus, the postulation of no traffic in the tunnel would not affect the outcome of the CFD simulations with regards to smoke movement and control. However, the existence of traffic upstream of the fire would act as obstacles that may affect the movement of supplied airflow.
The current paper presents the efforts to use the experimental data, generated from onsite flow and fire test measurements, in order provide the necessary initial and boundary conditions for the CFD model. This data is also used to partially validate the CFD model against small fires. The paper, then, presents the parametric study performed using a heat source of 20 MW (equivalent to a bus on fire [ ]1) in the tunnel. With the restriction of carrying hazardous goods into the tunnel, this fire load represents
a rational design fire. Based on this study, the paper suggests recommendations for the improvement of the performance of the ventilation strategies in the tunnel.
Tunnel Ventilation System
The Louis–Hippolyte–La Fountaine Tunnel road tunnel (Figure 1), built in 1964, travels underwater in a north-south direction. The tunnel is 1.8 km long with three lanes in each direction, inside two concrete tubes. Two ventilation towers are located at the ends of the underwater section. A control and monitoring centre for the tunnel is located at the north tower. A central section separates the two tubes. Galleries located in this section are used to supply air along the tunnel length via openings distributed along the walls (Figure 1) and these galleries can also be used as evacuation routes. Doors at various locations along the length of the tunnel provide access to the gallery. There are doors between the galleries providing a route to the other roadway. The wall openings have adjustable dampers to ensure uniform air distribution. The side vents are situated in two rows, upper and lower. The lower and the upper rows are located at heights of 1.0 and 3.9 m above the tunnel floor, respectively, and at intervals of approximately 6 m. The two rows of vents are offset by 3 m.
The tunnel ventilation is provided by a semi-transverse ventilation system with local extraction points (Figure 2). The ventilation system is composed of 8 ceiling exhaust fans (4 fans for each roadway) and 8 fans that supply air through the side vents which are uniformly distributed along one wall for each roadway. All fans can operate in reverse mode. Therefore, fresh air may be supplied at either the ceiling (fans VE151 through VE254), or by fans VA101 through VA204 through the side vents. In the exhaust mode, fans VE151 through VE254 can operate at full or half capacity (60 or 30 Hz), and in the supply mode they can only operate at 60 Hz. In the supply mode, fans VA101 through VA204 can operate at: 30, 40, or 60 Hz. In the exhaust mode, these fans can only operate at 60 Hz.
EXPERIMENTAL WORK
The main objective of the paper is to use FDS to assess the performance of the emergency ventilation systems of the road tunnel. As such, it is necessary to rationalize the use of FDS for this type of application before conducting the numerical parametric study. The need for reliable experimental data is common to validation of all fire models. While there is a significant amount of experimental data available from large-scale fire tests in tunnels, many of those tests were performed for reasons other than validation of fire models. In view of this and due to the fact that the tunnel under investigation is an operating tunnel, it was logical to proceed with conducting full-scale tests using an appropriate fire size to minimize damage to the tunnel structure and its components. Airflow measurements and fire tests were conducted in the North Roadway of the tunnel.
Airflow Measurements
Flow measurements [ ]6 were used to determine the capacity of the current EVS of the tunnel, to establish the boundary conditions for the CFD models, and to establish the ventilation scenarios for the fire tests [ ]7. Airflow temperature and speed were measured using a vane anemometer at selected side vents, ceiling vents and at several tunnel cross-sections. Pressure difference measurements were made using a digital micro manometer (MPTM series 4) at selected side vents. Additional measurements (airflow temperature and speed) were conducted using weather stations at the two portals and within the evacuation passage. These additional measured data were checked against data measured using the vane anemometer. The field airflow measurements led to a better understanding of the EVS and alternative operating scenarios. The gained knowledge assisted in planning the in-situ fire tests.
Fire Tests
Two fire tests were conducted (Figure 3): one close to the exhaust fans at the north end of the tunnel (Test 1) and one in the middle of the tunnel (Test 2). Two different ventilation scenarios were activated for the two tests. For Test 1, the two fans VE151 and VE153 were operated in the exhaust mode and the two fans VA103 and VA201 in the supply mode. In Test 2, a similar ventilation scenario was used except for fan VA103, which was used in the exhaust mode.
To develop the fire source for the in-situ fire tests, several issues were investigated including: fire source alternatives, fire size, test duration, tunnel safety and test logistics. In order to simulate a real fire, the heat source must produce a buoyant airflow. Therefore, the heat source must convert a substantial portion of the energy to heating the air to produce convective airflow. As such, cold smoke systems or electrical systems that produce primarily radiant heat are not applicable. A clean-burning propane burner system that produces minimal smoke is developed for the in-situ fire tests (Figure 4). The burner is about 1.3 m wide and 1.8 m long. This system is a compact, portable and convenient heat source that is capable of producing up to 5 MW of heat output simulating a small car fire [ ]1. Artificial smoke is used for visualization purposes with four smoke bombs added at 1 min intervals.
The fire size is selected so as to minimize damage to the tunnel structure and its components and to produce reliable data for the calibration and validation of the numerical models. Based on preliminary laboratory tests, CFD simulations as well as discussions with the tunnel authority and the local fire services, the heat output for the fire tests was limited to 2 MW. The objective was to limit the temperature at the tunnel ceiling below 100°C.
Other design considerations for the fire tests included: ensuring that the smoke from the smoke bombs was well mixed with the plume from the propane burner so as to produce hot buoyant smoke; ensuring that the smoke was not recycled into the South Roadway that was open to traffic. Initial flow measurement tests indicated that it took longer to clear the smoke with the fire located close to mid-tunnel. Therefore, the fire test with the fire located close to the exhaust fans VE151 and VE153 preceded the second test where the fire was located at the middle of the tunnel.
Temperature and smoke optical density (OD) were measured (Figure 5). A “Pulsed White Light LED” System was used with a wavelength in the range (0.450-0.650 mm). These measurements were taken at sixty locations downstream of the fire (Positions 1 through 3) and twenty locations upstream of the fire (Positions 4 through 8). In addition, air speed was measured at selected lower and upper side vents, the four ceiling exhaust fans (VE fans), the two portals, the middle cross-section of the tunnel, and inside the evacuation paths located between the two roadways. Upstream is defined in the context of this paper as the direction from which the traffic enters the tunnel.
A thermocouple tree was constructed at each fire location to measure the centreline plume and ceiling temperatures (Figure 5e). The thermocouple tree included eleven thermocouples, distributed vertically along the tunnel height and horizontally at the ceiling spanning 6 m upstream and downstream from the fire.
Figure 6 shows the time plots of the vertical and ceiling temperature profiles at the fire location for the tests, respectively. The measurements were recorded for 25 min at each location. The fire grew to the maximum heat release (2 MW) in 5 min and was maintained at that level for about 15 min. The activation of emergency ventilation scenarios modified the flow field in the tunnel. Airflow speeds of 2.5 and 4.6 m/s in the south-north direction were recorded at fire locations for Tests 1 and 2, respectively. As a result, the fire plume was deflected towards the downwind direction. Figure 4 shows a visual angle of deflection of the fire plume of about 25–30o for Test 2. The degree of deflection depends on both the wind speed and plume upward velocity. Raj et al [10] suggested the following relationship to calculate the plume deflection of LNG pool fires:
2 3 1 2 sin − ∞ ∞ ⎥ ⎥ ⎥ ⎥ ⎦ ⎤ ⎢ ⎢ ⎢ ⎢ ⎣ ⎡ ⎟ ⎟ ⎠ ⎞ ⎜ ⎜ ⎝ ⎛ Δ ⎟ ⎠ ⎞ ⎜ ⎝ ⎛ = c p H T c w u f πρ ρ θ 1 − (1)
where ρ∞andρfare densities of ambient air and fuel vapour respectively, ΔH is the heat of combustion, u is the wind speed, and w is the characteristics plume velocity. The angles of deflection of the plume were determined from Eq. 1 to be about 45
c
o and
32o for the two tests 1 and 2, respectively, which compare well with the visual observation shown in Figure 4. This phenomenon was manifested in the vertical and horizontal temperature profiles in Figure 6. The maximum temperature was detected at 0.4 m above the ground at the two fire locations (Figures 6a and 6c). Figures 6b and 6d denoted high fluctuations of temperature measurements of the two thermocouples on the ceiling at 3 and 6 m downstream of the fire implying the flickering of the deflected plume.
Smoke OD indicates the level of smoke obscuration. The higher the value of OD, the higher the smoke obscuration and the lower the visibility are. The visibility, VIS, may be calculated from Smoke OD as follows [11]:
α
VIS = K (2)
where:
α = extinction coefficient, m-1 = 2.303 OD
K = proportionality constant, dimensionless (6 for illuminated signs, 2 for reflected signs and building components in reflected light)
VIS = visibility, m
The NFPA 502 defines the smoke obscuration levels that should be considered to maintain a tenable environment for periods of short duration. Smoke obscuration levels should be continuously maintained below the point at which a sign illuminated at 80 lx (7.5 ft-candles) or equivalent brightness for internally luminated signs, is discernible at 30 m (100 ft), and doors and walls that are discernible at 10 m (33 ft).
Test Results
For both tests, the values of smoke OD were quite low upstream of the fire and the temperatures were at ambient temperature (about 20oC). These observations indicate that the EVS scenarios used in the tests created airflow such that the hot smoke moved in the desired direction. That is, it moved from the South to the North in the traffic direction.
In general, close to the fire location, high OD values were measured and as a result, the visibility was reduced. A few meters from the fire, the OD decreased at the lower tunnel height and the visibility was in the range of 12 m and higher. However, at locations further away from the fire, the OD increased at lower elevations and the visibility was reduced especially during Test 2. Moreover, the reduced level of visibility extended, in the case of Test 2, further downstream of the fire location.
For Test 1, ceiling fans VE151 and VE153 were activated in the exhaust mode causing the smoke to be pulled towards the ceiling and, therefore, lower values of the OD were observed and good visibility was maintained up to the 3.0 m elevation.
From the testing observations, there were differences in the behaviour of cold flow tests conducted in the tunnel [ ]6 and the hot smoke in the current set of tests. During the cold smoke tests, it was noted that when the smoke source was located close to the exhaust fans (similar to Test 1), the rate of smoke removal was higher with almost no side dispersion of smoke. However, with the hot smoke tests, smoke was dispersed laterally and the rate of smoke clearance was lower. This confirms that only hot smoke tests should be used to evaluate the performance of ventilation systems.
It was concluded from the measured values for Test 2 that the ventilation system helped to control the temperatures and produced a high airflow velocity in the middle of the tunnel. However, most of the smoke was extracted through the sidewall vents. The visibility was reduced at a lower elevation downstream of the fire up to a distance of about 300 m. In addition, a dense layer of smoke was observed in the evacuation path limiting its use in this scenario. Moreover, it was observed that the smoke extracted
through the side vents was recirculated into the other evacuation paths downstream of the exhaust fans. The full details of the experimental work of the study are documented in references [ , , , ]6 7 8 9.
NUMERICAL MODELLING
CFD models can be used to provide a two- or three-dimensional representation of the domain. The details of fluid flow and heat transfer provided by CFD models can prove vital in analyzing problems involving far-field smoke flow, complex geometries, and the impact of fixed ventilation flows. As such, CFD techniques can be used to estimate the cost-effectiveness and viability of fire protection strategies against introducing design changes. Effects of ventilation, building type and new materials can be evaluated. Moreover, they can be of great value in providing insight into the dynamics of fire behaviour.
CFD models solve the differential equations describing the conservation of mass, momentum, enthalpy, species, etc. within the physical domain of interest. The space and time dimensions are discretized into finite intervals and fluid variables (such as temperature, velocity, gas composition and pressure) and are computed at a finite number of locations at the grid points as a function of time. These variables are connected with each other through algebraic equations derived from their partial differential counterparts by integration over control volumes using the finite difference technique.
A major difference between CFD models is how the viscosity used in the momentum equation is calculated. The majority of CFD models, e.g. k-ε models [12], use turbulence
models to approximate the turbulent energy and dissipation produced by the fire. This approach results in a solution to an averaged version of the flow equations.
On the other hand, the Large Eddy Simulation (LES) [13] approach solves the large scales of motion and models the small scales that are assumed to be universal. The LES approach results in an unsteady solution to the Navier-Stokes equations. Because
real turbulent flow situations are inherently unsteady, LES methods can have an advantage in modelling turbulent fire-induced flows.
The current research study employs the Fire Dynamic Simulator (FDS) CFD model [13]. FDS is based on the LES approach and solves a form of high-speed filtered Navier-Stokes equations valid for a low-speed buoyancy driven flow. These equations are discretized in space using second order central differences and in time using an explicit, second order, predictor-corrector scheme.
In FDS, fire is represented using the “mixture fraction-based” combustion model. This model directly simulates large-scale convective and radiative transport phenomena. The small length and time scales physical processes are, on the other hand estimated. The actual combustion process in the fire is not simulated. As such, the model inherently assumed that the reaction of fuel and oxygen is infinitely fast (fuel and oxygen cannot co-exist and they will react at any temperature). The local heat release rate is computed from the local oxygen consumption rate at the flame surface.
FDS has been the subject of numerous validations [13]. The validation efforts included: comparison with full-scale tests conducted specifically for code evaluation, comparison with engineering correlations, comparison with previously published full-scale test data, comparison with standard test, and comparison with documented fire experience.
Numerical Modelling of Fire Tests
The two North and South Roadways concrete tubes are completely separated. Therefore, only the North Roadway of the tunnel and its galleries (Figure 7) were simulated with a grid consisting of about 800,000 control volumes. A special refined grid was constructed around the fire source (60 x 162 x 50). Two transient numerical simulations were conducted to represent the ventilation scenarios used for both fire tests (hereinafter referred to as “Scenario 1” and “Scenario 2”). Fans were simulated as mass sources or sinks depending on the ventilation scenario. Free boundaries with the pressure equal to the static ambient pressure were assumed at the North and South Portals.
A propane source, approximately, 1.8 m long, 1.5 m wide and 0.7 m high was used to simulate the experimental fire source. The fire source with a heat output of 2 MW was placed at a distance of 356 m and 689 m from the North Portal for Scenarios 1 and 2, respectively. The fuel was assumed to be propane with modified soot yield to account for the extra smoke produced by the smoke bombs added for visualization during the field measurements. The smoke yield of the smoke bomb was calculated to be 0.663 g/g [14].
Ventilation Scenario 1: fresh air was supplied through the sidewall vents of the
galleries of fans VA103 and V201 and hot smoke and fire products were exhausted through the tunnel ceiling fans VE151 and VE153. Fresh air was also drawn through the North and South Portals.
The behaviour of the airflow in the tunnel plays a major role in determining the longitudinal air velocity and, consequently, the ability of a ventilation configuration to clear the smoke and fire products. Figure 8 represents the general flow pattern in the tunnel for Scenario 1. The airflow pattern is represented by streamlines of the velocity vector field. As depicted in Figure 8, the air supplied through the lower and upper side vents created regions of turbulent flow. Furthermore, the air from the larger upper vents was faster than that from the lower vents, which resulted in more air being injected at the top of the tunnel. The air jets forced airflow downwards and created rotational movement of the air. As a result, only a small portion of the tunnel had a longitudinal airflow, near the two portals. These results are in agreement with the field observations that indicated low longitudinal air velocities in the middle section of the tunnel.
Figure 9 shows the average volumetric flow pattern for cross-sections along the tunnel length. A positive air velocity within the tunnel represents airflow from the North Portal towards the South Portal (against traffic). The predicted and measured volumetric flow are comparable. The results indicated that there was a stagnant flow zone near the middle of the tunnel (at 708 m from the North Portal).
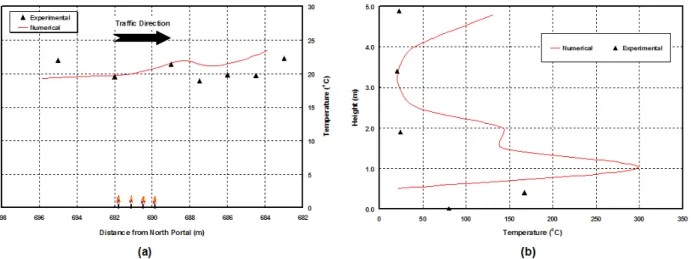
Figure 10 shows the ceiling and vertical temperature profiles above the fire source. Both numerical predictions and experimental measurements of the ceiling temperatures revealed that the highest temperature did not occur directly above the fire source (Figure 10a). Rather it occurred at a distance downstream of the fire. This is due to the tilt of the fire plume caused by airflow in the tunnel. The highest ceiling temperatures, predicted by numerical simulations, were rather higher than the measured values (≈27%) and occurred at a distance downstream of the fire further from the fire source than those measured.
Figure 10b shows the comparison of both the predicted and measured vertical temperature profile above the fire. The two profiles are comparable above the height 2 m (approximately flame height). The two set of values are within 20% range of difference. Below that height there is a discrepancy between the predicted and measured temperatures (≈40%), which may be attributed to the fluctuations of the plume that are not fully reproduced in the numerical model.
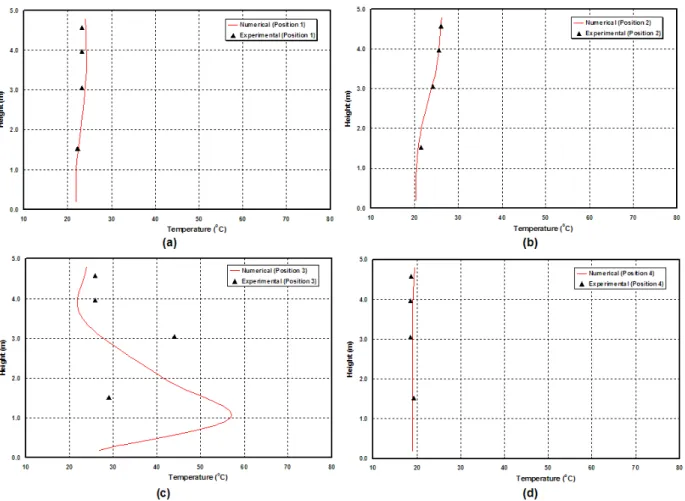
Figure 11 shows the vertical temperature profiles at Positions 1, 2, 3, and 4. The profile at each position is constructed by averaging the values of all measurements or predictions at each height. The numerical predictions and experimental data are comparable (14% range of difference). The prevailing temperature at Position 4 is the ambient temperature.
Figure 12 shows the smoke optical density (OD) Profiles at Positions 1, 2, 3 and 4. In general, the numerical predictions and measured values are comparable especially at Positions 1 and 2 further downstream of the fire (20% range of difference). At Positions 3 and 4, the comparisons show discrepancies between numerical predictions and experimental data (>30% difference) that could be attributed to the highly turbulent flow at these positions as a result of supplying fresh air with high speed from the sidewall vents of fans VA103 and VA201 galleries.
Ventilation Scenario 2: in this scenario, fresh air was supplied through the sidewall
vents of the galleries of fan V201 and hot smoke and fire products were exhausted through the tunnel ceiling fans VE151 and VE153 and the sidewall vents of the galleries of fan VA103.
The volumetric flow shown in Figure 13 indicates a greatly modified flow field where the air speeds at mid-tunnel increased from almost zero (Scenario 1) to about 5.0 m/s providing improved smoke clearance. While the longitudinal air speed increased, the turbulent behaviour of the flow in the middle of the tunnel remains as the dominant mode of transport.
Figure 14 shows the ceiling and vertical temperature profiles above the fire source. Both numerical predictions and experimental measurements of the ceiling and vertical temperature profiles are within 8% range of difference. Figure 15 shows the vertical temperature profiles at Positions 1, 2, 3, and 4. The numerical predictions and measured values are comparable especially at Positions 1, 2, and 4 (5% range of difference). The prevailing temperature at Position 4 (upstream of fire) is ambient temperature.
Figure 16 shows the smoke optical density (OD) Profiles at Positions 1, 2, 3 and 4. The numerical predictions and measured values are comparable especially at Positions 1, 2 and 3 downstream of the fire. At Positions 4 the comparisons show discrepancies between numerical predictions and experimental data.
Numerical Modelling of a 20 MW Fire source
FDS was further used to investigate the performance of the in-place ventilation strategies. To assess the performance, a parametric study was performed assuming a heat source of 20 MW (equivalent to a bus on fire [ ]1) in the tunnel.
The fire was modelled as an equivalent gasoline pool [ ]1. An equivalent gasoline pool with an area of 8 m2 with CO2, CO and smoke flow production rates of 1.5 kg/s,
0.077 kg/s, and 60 m3/s, respectively.
Two fires were simulated: one located at the middle of the tunnel (hereafter called “Mid-Fire” scenario – at a distance in the range of 555 to 615 m from the North Portal) and the other is located near exhaust fans VE151 and VE153 (hereafter called “Exhaust-Fire” scenario – at a distance in the range of 355 to 555 m from the North Portal). These two scenarios are deemed to cover the two main situations probable to occur in
the tunnel corresponding to fire occurring inside or outside the middle region of the tunnel.
Mid-Fire Scenario simulated cases
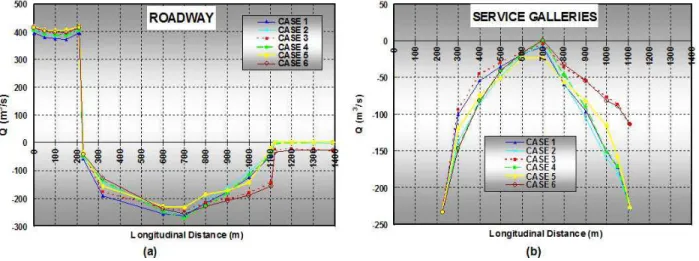
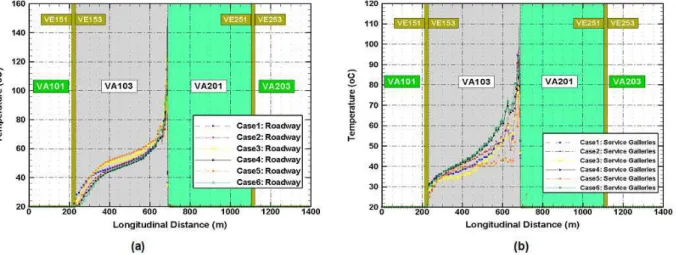
One of the project objectives is to use results from the numerical models to improve the side vents damper settings. Currently all dampers are fully open which requires the tunnel supply systems to operate at full capacity. To explore the effect of damper settings and fan operating capacities on the performance of the EVS, six cases are investigated under this fire scenario. They are described in Table 1. The parameters examined are the capacity of fan VA201 and the percentage opening of the upper and lower side vents dampers. It should be noted that a frequency of 60 Hz indicates that the fan operates in full capacity and 30 Hz implies that the fan runs at half capacity. Thus, in Cases 1, 2, 4, and 5, fan VA201 operates at full capacity and in the other two Cases, 3 and 6, the fan runs with 50% capacity. Three sizes of side vents are considered: 100% (fully-opened), 50% and 0% (fully-closed).
The bulk plots (Figure 17 through Figure 19) show the volumetric flow, temperature and visibility distribution across the tunnel length in the roadway as well as in the service galleries. The bulk values are calculated by averaging the values of an airflow parameter at each cross-section of the tunnel.
Figure 17 shows the bulk volumetric flow in the roadway and service galleries for the six simulated cases. Fresh air was supplied by fan VA201 through the galleries and entered the tunnel roadway through the fully opened side vents. Smoke and hot gases were exhausted through ceiling fans VE151 and VE153 and through the side vents to the galleries of fan VA103. Fresh air was also drawn through the North and South Portals. With fan VA201 operating with 50% capacity (Cases 3 and 6), the major impact on the flow distribution in the roadway occurs at fans VE251 and VE253 (upstream of the fire) and less significant effects took place downstream of the fire.
Figure 18 shows the bulk temperatures in the roadway and service galleries for the six cases for the Mid-Fire scenario. The maximum predicted temperatures at the fire location were 130, 120, 129, 150, 121, and 113oC, for the six cases respectively. Case 4 (with the lower vents closed) resulted in the highest predicted temperature. However, Cases 4 and 6 resulted in a relatively faster dissipation of high temperature due to the greater efficiency of the upper vents in extracting hot gases from the tunnel roadway. The reduced supply capacity of fan VA 201, depicted in Case 6, resulted in more flow directed upstream of the fire towards the South Portal. In doing so, the hot gases from the fire were diluted to nearly the ambient environment resulting in a reduced peak temperature and faster dissipation of the temperature downstream of the fire. Moreover, Case 6 offers a favourable evacuation condition with lower air speed in the service galleries of fan VA 201.
The above-mentioned observations were confirmed in Figure 19, which shows a quick restoration of good visibility (rapid extraction of smoke) downstream of the fire for Cases 4 and 6. The visibility is calculated assuming a value of 2 for the proportionality constant (reflected signs and building components in reflected light [10]). It is important to note that even though Case 4 has a favourable visibility condition, it may present a challenge for the movement of the evacuees by introducing a faster airflow in the service galleries of fan VA201.
Exhaust-Fire Scenario Simulated Cases
Four cases were investigated under this fire scenario. They are described in Table 2. The parameters examined were the capacity of fans VA103 and VA201 and the percentage opening of the upper and lower side vents. In all Cases, except for Case 1, both fans VA103 and VA201 operate with 50% capacity. Two sizes of side vents were considered: 100% (fully-opened) and 0% (fully-closed).
Figure 20 shows the bulk volumetric flow in the roadway and service galleries for the four simulated cases. With fans VA103 and VA201 operating with 50% capacity (Cases 2, 3, and 4), the airflow speeds in the middle region of the tunnel are, in general, higher than those for Case 1 and in the direction of the traffic (South-North). This represents favourable conditions for smoke removal. Also, for the three Cases 2, 3, and 4 more fresh air is withdrawn at the North Portal which helps to trap the smoke close to exhaust fans VE151 and VE153.
Figure 21 shows the centreline temperature profiles for the four cases at different locations across the tunnel. In general, Case 4 (fans VA103 and VA201 operating with 50% capacity and upper side vents are closed) resulted in the lowest predicted temperatures. These predictions are believed to be the result of the fact that the fresh air is supplied at a lower height than the hot layer and thus causes no disturbance to the movement of the smoke and hot gases towards exhaust fans VE151 and VE153.
Figure 22 shows similar visibility conditions in the roadway for all cases. However, the four cases produced different visibility conditions in the service galleries of fan VA103. Case 3 (with lower side vents closed) produced almost 30 m visibility throughout the service galleries. Cases 1 and 4 resulted in 25-27 m visibility. Case 2 created slightly lower visibility conditions that extended upstream of the fire.
CONCLUSIONS
The paper reports the successful in-situ airflow and fire tests that were carried out in the Louis–Hippolyte–La Fountaine Tunnel road tunnel. A fire source of 2 MW was used to conduct the fire tests. Temperature, airflow velocity, pressure and smoke OD values were measured. These data was used to provide the necessary initial and boundary conditions for the CFD model and to partially validate the CFD model against small fires.
CFD simulations, using FDS, were conducted to compare with field data. The comparison studies showed that both numerical predictions and experimental measurements were, in general, comparable. Comparisons were made, at the near and the far field of the fire source, of several parameters included: volumetric airflow, temperature, and OD values. As such, CFD techniques can be used to complement the experiments to analyze different fire and ventilation scenarios. They offer a predictive tool for the situations where the actual fire tests prove to be cumbersome to conduct. The FDS was further used to conduct a parametric study for a fire source of 20 MW and for different ventilation and fire scenarios. Based on the parametric study, the following conclusions and comments can be made:
The in-place ventilation strategies for the two fire scenarios, close to the exhaust fans and at the middle of the tunnel, are efficient in clearing hot smoke and fire products from the tunnel and preventing the phenomenon of “backlayering”.
The airflow velocity in the evacuation passage was estimated to be 14 m/s with VA fans at maximum capacity in supply. It might be difficult to walk against such a high airflow during evacuation. Lower velocities (“motorists under emergency conditions can tolerate velocities as great as 11 m/sec” [ ]1) may be used to facilitate movement in the evacuation passage.
Lowering the capacity of fan VA in the supply mode would, in addition to facilitating movement in the evacuation passage, improve the visibility downstream of the fire. In general, it is recommended that while the VA fans operate in the exhaust mode to have the upper vents fully-opened and the lower vents fully-closed. This configuration would result in a more efficient extraction of smoke and hot gases from the tunnel.
On the other hand, it is favorable to have the upper side vents fully closed and the lower side vents fully-opened while the VA fans operate in the supply mode. This configuration would result in a minimum disruption of the buoyant smoke and hot gases layers.
While indicating earlier that the current procedures are deemed effective in controlling the smoke, in order to further improve the performance of these strategies the following recommendations may be considered:
a. The ideal situation would be to automate the side vent dampers in order to be able to change their configuration according to the fire location and the scenario used. In turn, this will provide the tunnel operator the maximum flexibility in dealing with different fire scenarios.
b. While it is suggested that the damper system be automated, this option could be expensive to implement and maintain operational in Canadian weather. An alternative option can be to optimize side vent configurations (opening/closure state) in accordance with the most critical scenarios used. In this option, it is recommended that the upper vents of fans VA101, VA102, VA104, VA201, VA203 and VA204 be fully closed and the lower vents be fully-opened. For fans VA103 and VA202, it is suggested that the upper vents be fully-opened and the lower vents fully closed.
These recommendations have instigated the tunnel authorities to conduct a series of feasibility studies to re-engineer the ventilation system and refit the galleries of service for the improvement of level of safety of means of evacuation of the tunnel.
NOMENCLATURE
p
c = specific heat of plume gases (kJ/kg°C)
K = proportionality constant
u = wind speed, m/s VIS = visibility, m
w = characteristic plume velocity, m/s Greek α = extinction coefficient, m-1 c H Δ = heat of combustion, J/kg ∞
ρ = density of ambient air, kg/m3
f
θ = angle of deflection of the plume
ACKNOWLEDGEMENTS
The authors acknowledge the NRC’s researchers and technical staff and the staff of the Ministère des Transports du Québec who immensely contributed to conducting the successful in-situ tests.
REFERENCES
1. NFPA 502, Standard for Road Tunnels, Bridges, and Other Limited Access Highways, NFPA, 1 Batterymarch Park, PO Box 9101, Quincy, MA 02269-9101, USA, 2001.
2. Lacroix, D., The New PIARC Report on Fire and Smoke Control in Road Tunnels, Third International Conference on Safety in Road and Rail Tunnels, Nice, France, p. 185-97, 1998.
3. Ingason, H. and Lönnermark, A., Large-scale Fire Tests in the Runehamar tunnel - Heat Release Rate (HRR), International Symposium on Catastrophic Tunnel Fires (CTF), SP Report 2004:05, p.81-92, Borås, Sweden, 20-21 November, 2003.
4. Wighus, R., Fire load - Experimental Data Versus Real Fires, Fabig Technical Meeting, London – Aberdeen, 16-17.June, 2005
5. Heselden, A J M., “Studies of Fire and Smoke Behaviour Relevant to Tunnels”, Proc. Second International Symposium on the Aerodynamics and Ventilation of Vehicle Tunnels, Cambridge, BHRA, paper J1, 1976.
6. Kashef, A.; Bénichou, N.; Lougheed, G.D.; Debs, A., “CFD Simulation of in-situ Airflow Measurements in Road Tunnels”, 5th International Conference Safety in Road and Rail Tunnels (Marseilles, France, 2003-10-06), pp. 609-618, 2003.
7. Kashef, A.; Bénichou, N.; Lougheed, G.D.; Debs, A., “Computational Fluid Dynamics Simulations of in-situ Fire Tests in Road Tunnels”, 5th International Conference - Tunnels Fires (London, United Kingdom, October 25, 2004), pp. 185-196, 2004.
8. Kashef, A.; Lougheed, G.D.; Bénichou, N.; Debs, A., “Investigation of effectiveness of emergency ventilation strategies in the event of fires in road tunnels”, ASHRAE Transactions, 111, pp. 1-14, 2005.
9. Kashef, A.; Bénichou, N.; Lougheed, G.D., “Numerical Modelling of Movement and Behaviour of Smoke Produced from Fires in the Ville-Marie and L.-H.-La Fontaine Tunnels: Literature Review”, Research Report, Institute for Research in Construction, National Research Council Canada, 141, pp. 66, Sep, (IRC-RR-141), 2003.
10. Raj, P., Moussa, A., and Aravamudan, K., “Experiments Involving Pool and Vapour Fires from Spills of Liquefied Natural Gas on Water”, U.S. Coast Guard Report No. CG-D-55-79, 1979.
11. Klote, J., and Milke, J., “Principles of Smoke Management”, ASHRAE, Inc., 1791 Tullie Circle NE, Atlanta, GA 30329, 2002.
12. Wilcox, D.C. 1993. Turbulence Modeling of CFD. DCW Industries, Inc., California 91011.
13. McGrattan, K.B., Fire Dynamics Simulator (Version 4) – Technical Reference Guide, NIST Special Publication 1018, National Institute of Standards and Technology, Gaithersburg, MD, 2005.
14. Newman, J.S. and Steciak, J., “Characterization of Particulates from Diffusion Flames”, Combustion and Flame, Vol. 67, pp. 55-64, 1987.
Investigation of the Performance of Emergency Ventilation Strategies
in the Event of Fires in a Road Tunnel – A Case Study
Ahmed Kashef1 and Noureddine Bénichou National Research Council of Canada
Building M59, 1200 Montreal Road Ottawa, Ontario
Canada K1A 0R6
ABSTRACT
A research project has been conducted at the National Research Council of Canada (NRC) to evaluate the effectiveness of in-place emergency ventilation strategies to control smoke spread in the event of a fire in the Louis-Hippolyte-La Fontaine road tunnel. Some of these strategies date back to the design of the tunnel (1964). Following a recent fire, the operating instructions were revised. A scientific based evaluation of these operation instructions is the main objective of the current study. The research includes both numerical and experimental studies. The numerical study uses the Fire Dynamic Simulator (FDS) model to investigate smoke ventilation in tunnels. The experimental study is used to provide the necessary initial and boundary conditions for the Computational Fluid Dynamics (CFD) model.
A parametric study is performed, using the FDS model, assuming a heat source of 20 MW in the tunnel. Two fires scenarios, deemed to cover the two main situations probable to occur in the tunnel, are simulated. The parameters examined are the capacity of ventilation fans and the percentage opening of the vents dampers. The results of the numerical analyses indicated that the phenomenon of “backlayering” did not occur in all simulated cases. The backlayering phenomenon is defined as the situation in which the smoke moves against the provided ventilation upstream of the fire creating an environment that poses a danger to both tunnel users and emergency responders.
While the existing ventilation strategies are, in general, deemed acceptable, the current paper proposes recommendations in order to further improve the performance of the ventilation strategies in the tunnel. These recommendations have inspired the tunnel authorities to conduct a series of feasibility studies to re-engineer the ventilation system and refit the service galleries for the improvement of level of safety of means of evacuation of the tunnel.
Key words: emergency ventilation system (EVS), emergency ventilation strategies,
road tunnels fires, smoke movement, backlayering phenomenon, CFD (Computational Fluid Dynamics), FDS (Fire Dynamic Simulator).
INTRODUCTION
Fires in tunnels pose major safety issues and challenges to the designer, especially with the increase in the number of tunnels, their length and number of people using them. The main fire safety issues include [ , ]1 2: safe evacuation of people inside the tunnel, safe rescue operations, minimal effects on the environment due to the release of combustion gases, and a minimal loss of property.
In a tunnel environment, life can be threatened in a number of ways: the inhalation of combustion products such as carbon monoxide and carbon dioxide, and the exposure to high temperatures and heat fluxes. Temperatures up to 1350oC [ ]3 and heat fluxes in excess of 300 kW/m2[ ]4 can be generated within a few minutes of ignition in certain types of fires. Furthermore, evacuation can be significantly hindered by poor visibility, power failure, blocked exits due to traffic jams or crashed vehicles, or obstruction resulting from a collapse or explosion in the tunnel. For safe evacuation, viable temperatures, acceptable visibility, and air quality must be maintained in the tunnel. The provision of a safe egress route that is free of smoke and hot gases is the main objective for an emergency ventilation system (EVS). Methods of controlling contaminants and smoke from a fire in a tunnel using EVS include longitudinal airflow, smoke extraction and smoke dilution. Tunnel operators must implement a strategy of smoke removal, which consists of selecting a sequence of fan operation. When the fire department arrives at the fire scene, the operator must cooperate and modify, as needed, the fan operation in order to facilitate access to the site.
In the event of a fire, the airflow in a tunnel is modified and becomes highly unsteady. The modifications are due to the fire itself, the operation of the EVS, and the change in the traffic flow in the tunnel. The smoke progress and its degree of stratification depend mainly on the airflow in the tunnel. With no airflow in the fire zone, the smoke moves symmetrically on both sides of the fire [ ]5. The combined effects of convective heat exchange with tunnel walls and the mixing between the smoke and the fresh air layer causes the smoke to cool down and lose its stratification. Other parameters that affect
the smoke flow [ ]5 and stratification are: heat release rate, natural ventilation, tunnel slope and traffic flow.
Establishing airflow requirements for roadway tunnels and consequently the capacity of the EVS is a challenging task due to the difficulty of controlling many variables. These include changes in traffic patterns and operations during the lifetime of the facility.
A study has been conducted at the National Research Council of Canada (NRC) to evaluate the performance of the EVS in the event of a fire in the Louis–Hippolyte–La Fountaine road tunnel. The study aims at assessing the ability of in-place emergency ventilation strategies to control smoke spread and minimize its impact on tunnel users. The study also attempts to recommend guidelines for improving the ventilation operation to maximize intervention effectiveness.
Airflow measurements and fire tests were conducted in the tunnel. The initial airflow measurements were used to establish the ventilation scenarios for the fire tests and to provide input data for the Computational Fluid Dynamics (CFD) model. Two fire tests were conducted in the tunnel using a clean-burning propane system that produces minimal visible smoke. Artificial smoke was added for visualization purposes.
All CFD simulations were carried out in the absence of traffic in the tunnel. It is assumed that the traffic downstream of the fire would be cleared shortly after the eruption of the fire. Thus, the postulation of no traffic in the tunnel would not affect the outcome of the CFD simulations with regards to smoke movement and control. However, the existence of traffic upstream of the fire would act as obstacles that may affect the movement of supplied airflow.
The current paper presents the efforts to use the experimental data, generated from onsite flow and fire test measurements, in order provide the necessary initial and boundary conditions for the CFD model. This data is also used to partially validate the CFD model against small fires. The paper, then, presents the parametric study performed using a heat source of 20 MW (equivalent to a bus on fire [ ]1) in the tunnel. With the restriction of carrying hazardous goods into the tunnel, this fire load represents
a rational design fire. Based on this study, the paper suggests recommendations for the improvement of the performance of the ventilation strategies in the tunnel.
Tunnel Ventilation System
The Louis–Hippolyte–La Fountaine Tunnel road tunnel (Figure 1), built in 1964, travels underwater in a north-south direction. The tunnel is 1.8 km long with three lanes in each direction, inside two concrete tubes. Two ventilation towers are located at the ends of the underwater section. A control and monitoring centre for the tunnel is located at the north tower. A central section separates the two tubes. Galleries located in this section are used to supply air along the tunnel length via openings distributed along the walls (Figure 1) and these galleries can also be used as evacuation routes. Doors at various locations along the length of the tunnel provide access to the gallery. There are doors between the galleries providing a route to the other roadway. The wall openings have adjustable dampers to ensure uniform air distribution. The side vents are situated in two rows, upper and lower. The lower and the upper rows are located at heights of 1.0 and 3.9 m above the tunnel floor, respectively, and at intervals of approximately 6 m. The two rows of vents are offset by 3 m.
The tunnel ventilation is provided by a semi-transverse ventilation system with local extraction points (Figure 2). The ventilation system is composed of 8 ceiling exhaust fans (4 fans for each roadway) and 8 fans that supply air through the side vents which are uniformly distributed along one wall for each roadway. All fans can operate in reverse mode. Therefore, fresh air may be supplied at either the ceiling (fans VE151 through VE254), or by fans VA101 through VA204 through the side vents. In the exhaust mode, fans VE151 through VE254 can operate at full or half capacity (60 or 30 Hz), and in the supply mode they can only operate at 60 Hz. In the supply mode, fans VA101 through VA204 can operate at: 30, 40, or 60 Hz. In the exhaust mode, these fans can only operate at 60 Hz.
EXPERIMENTAL WORK
The main objective of the paper is to use FDS to assess the performance of the emergency ventilation systems of the road tunnel. As such, it is necessary to rationalize the use of FDS for this type of application before conducting the numerical parametric study. The need for reliable experimental data is common to validation of all fire models. While there is a significant amount of experimental data available from large-scale fire tests in tunnels, many of those tests were performed for reasons other than validation of fire models. In view of this and due to the fact that the tunnel under investigation is an operating tunnel, it was logical to proceed with conducting full-scale tests using an appropriate fire size to minimize damage to the tunnel structure and its components. Airflow measurements and fire tests were conducted in the North Roadway of the tunnel.
Airflow Measurements
Flow measurements [ ]6 were used to determine the capacity of the current EVS of the tunnel, to establish the boundary conditions for the CFD models, and to establish the ventilation scenarios for the fire tests [ ]7. Airflow temperature and speed were measured using a vane anemometer at selected side vents, ceiling vents and at several tunnel cross-sections. Pressure difference measurements were made using a digital micro manometer (MPTM series 4) at selected side vents. Additional measurements (airflow temperature and speed) were conducted using weather stations at the two portals and within the evacuation passage. These additional measured data were checked against data measured using the vane anemometer. The field airflow measurements led to a better understanding of the EVS and alternative operating scenarios. The gained knowledge assisted in planning the in-situ fire tests.
Fire Tests
Two fire tests were conducted (Figure 3): one close to the exhaust fans at the north end of the tunnel (Test 1) and one in the middle of the tunnel (Test 2). Two different ventilation scenarios were activated for the two tests. For Test 1, the two fans VE151 and VE153 were operated in the exhaust mode and the two fans VA103 and VA201 in the supply mode. In Test 2, a similar ventilation scenario was used except for fan VA103, which was used in the exhaust mode.
To develop the fire source for the in-situ fire tests, several issues were investigated including: fire source alternatives, fire size, test duration, tunnel safety and test logistics. In order to simulate a real fire, the heat source must produce a buoyant airflow. Therefore, the heat source must convert a substantial portion of the energy to heating the air to produce convective airflow. As such, cold smoke systems or electrical systems that produce primarily radiant heat are not applicable. A clean-burning propane burner system that produces minimal smoke is developed for the in-situ fire tests (Figure 4). The burner is about 1.3 m wide and 1.8 m long. This system is a compact, portable and convenient heat source that is capable of producing up to 5 MW of heat output simulating a small car fire [ ]1. Artificial smoke is used for visualization purposes with four smoke bombs added at 1 min intervals.
The fire size is selected so as to minimize damage to the tunnel structure and its components and to produce reliable data for the calibration and validation of the numerical models. Based on preliminary laboratory tests, CFD simulations as well as discussions with the tunnel authority and the local fire services, the heat output for the fire tests was limited to 2 MW. The objective was to limit the temperature at the tunnel ceiling below 100°C.
Other design considerations for the fire tests included: ensuring that the smoke from the smoke bombs was well mixed with the plume from the propane burner so as to produce hot buoyant smoke; ensuring that the smoke was not recycled into the South Roadway that was open to traffic. Initial flow measurement tests indicated that it took longer to clear the smoke with the fire located close to mid-tunnel. Therefore, the fire test with the fire located close to the exhaust fans VE151 and VE153 preceded the second test where the fire was located at the middle of the tunnel.
Temperature and smoke optical density (OD) were measured (Figure 5). A “Pulsed White Light LED” System was used with a wavelength in the range (0.450-0.650 mm). These measurements were taken at sixty locations downstream of the fire (Positions 1 through 3) and twenty locations upstream of the fire (Positions 4 through 8). In addition, air speed was measured at selected lower and upper side vents, the four ceiling exhaust fans (VE fans), the two portals, the middle cross-section of the tunnel, and inside the evacuation paths located between the two roadways. Upstream is defined in the context of this paper as the direction from which the traffic enters the tunnel.
A thermocouple tree was constructed at each fire location to measure the centreline plume and ceiling temperatures (Figure 5e). The thermocouple tree included eleven thermocouples, distributed vertically along the tunnel height and horizontally at the ceiling spanning 6 m upstream and downstream from the fire.
Figure 6 shows the time plots of the vertical and ceiling temperature profiles at the fire location for the tests, respectively. The measurements were recorded for 25 min at each location. The fire grew to the maximum heat release (2 MW) in 5 min and was maintained at that level for about 15 min. The activation of emergency ventilation scenarios modified the flow field in the tunnel. Airflow speeds of 2.5 and 4.6 m/s in the south-north direction were recorded at fire locations for Tests 1 and 2, respectively. As a result, the fire plume was deflected towards the downwind direction. Figure 4 shows a visual angle of deflection of the fire plume of about 25–30o for Test 2. The degree of deflection depends on both the wind speed and plume upward velocity. Raj et al [10] suggested the following relationship to calculate the plume deflection of LNG pool fires:
2 3 1 2 sin − ∞ ∞ ⎥ ⎥ ⎥ ⎥ ⎦ ⎤ ⎢ ⎢ ⎢ ⎢ ⎣ ⎡ ⎟ ⎟ ⎠ ⎞ ⎜ ⎜ ⎝ ⎛ Δ ⎟ ⎠ ⎞ ⎜ ⎝ ⎛ = c p H T c w u f πρ ρ θ 1 − (1)
where ρ∞andρfare densities of ambient air and fuel vapour respectively, ΔH is the heat of combustion, u is the wind speed, and w is the characteristics plume velocity. The angles of deflection of the plume were determined from Eq. 1 to be about 45
c
o and
32o for the two tests 1 and 2, respectively, which compare well with the visual observation shown in Figure 4. This phenomenon was manifested in the vertical and horizontal temperature profiles in Figure 6. The maximum temperature was detected at 0.4 m above the ground at the two fire locations (Figures 6a and 6c). Figures 6b and 6d denoted high fluctuations of temperature measurements of the two thermocouples on the ceiling at 3 and 6 m downstream of the fire implying the flickering of the deflected plume.
Smoke OD indicates the level of smoke obscuration. The higher the value of OD, the higher the smoke obscuration and the lower the visibility are. The visibility, VIS, may be calculated from Smoke OD as follows [11]:
α
VIS = K (2)
where:
α = extinction coefficient, m-1 = 2.303 OD
K = proportionality constant, dimensionless (6 for illuminated signs, 2 for reflected signs and building components in reflected light)
VIS = visibility, m
The NFPA 502 defines the smoke obscuration levels that should be considered to maintain a tenable environment for periods of short duration. Smoke obscuration levels should be continuously maintained below the point at which a sign illuminated at 80 lx (7.5 ft-candles) or equivalent brightness for internally luminated signs, is discernible at 30 m (100 ft), and doors and walls that are discernible at 10 m (33 ft).
Test Results
For both tests, the values of smoke OD were quite low upstream of the fire and the temperatures were at ambient temperature (about 20oC). These observations indicate that the EVS scenarios used in the tests created airflow such that the hot smoke moved in the desired direction. That is, it moved from the South to the North in the traffic direction.
In general, close to the fire location, high OD values were measured and as a result, the visibility was reduced. A few meters from the fire, the OD decreased at the lower tunnel height and the visibility was in the range of 12 m and higher. However, at locations further away from the fire, the OD increased at lower elevations and the visibility was reduced especially during Test 2. Moreover, the reduced level of visibility extended, in the case of Test 2, further downstream of the fire location.
For Test 1, ceiling fans VE151 and VE153 were activated in the exhaust mode causing the smoke to be pulled towards the ceiling and, therefore, lower values of the OD were observed and good visibility was maintained up to the 3.0 m elevation.
From the testing observations, there were differences in the behaviour of cold flow tests conducted in the tunnel [ ]6 and the hot smoke in the current set of tests. During the cold smoke tests, it was noted that when the smoke source was located close to the exhaust fans (similar to Test 1), the rate of smoke removal was higher with almost no side dispersion of smoke. However, with the hot smoke tests, smoke was dispersed laterally and the rate of smoke clearance was lower. This confirms that only hot smoke tests should be used to evaluate the performance of ventilation systems.
It was concluded from the measured values for Test 2 that the ventilation system helped to control the temperatures and produced a high airflow velocity in the middle of the tunnel. However, most of the smoke was extracted through the sidewall vents. The visibility was reduced at a lower elevation downstream of the fire up to a distance of about 300 m. In addition, a dense layer of smoke was observed in the evacuation path limiting its use in this scenario. Moreover, it was observed that the smoke extracted
through the side vents was recirculated into the other evacuation paths downstream of the exhaust fans. The full details of the experimental work of the study are documented in references [ , , , ]6 7 8 9.
NUMERICAL MODELLING
CFD models can be used to provide a two- or three-dimensional representation of the domain. The details of fluid flow and heat transfer provided by CFD models can prove vital in analyzing problems involving far-field smoke flow, complex geometries, and the impact of fixed ventilation flows. As such, CFD techniques can be used to estimate the cost-effectiveness and viability of fire protection strategies against introducing design changes. Effects of ventilation, building type and new materials can be evaluated. Moreover, they can be of great value in providing insight into the dynamics of fire behaviour.
CFD models solve the differential equations describing the conservation of mass, momentum, enthalpy, species, etc. within the physical domain of interest. The space and time dimensions are discretized into finite intervals and fluid variables (such as temperature, velocity, gas composition and pressure) and are computed at a finite number of locations at the grid points as a function of time. These variables are connected with each other through algebraic equations derived from their partial differential counterparts by integration over control volumes using the finite difference technique.
A major difference between CFD models is how the viscosity used in the momentum equation is calculated. The majority of CFD models, e.g. k-ε models [12], use turbulence
models to approximate the turbulent energy and dissipation produced by the fire. This approach results in a solution to an averaged version of the flow equations.
On the other hand, the Large Eddy Simulation (LES) [13] approach solves the large scales of motion and models the small scales that are assumed to be universal. The LES approach results in an unsteady solution to the Navier-Stokes equations. Because
real turbulent flow situations are inherently unsteady, LES methods can have an advantage in modelling turbulent fire-induced flows.
The current research study employs the Fire Dynamic Simulator (FDS) CFD model [13]. FDS is based on the LES approach and solves a form of high-speed filtered Navier-Stokes equations valid for a low-speed buoyancy driven flow. These equations are discretized in space using second order central differences and in time using an explicit, second order, predictor-corrector scheme.
In FDS, fire is represented using the “mixture fraction-based” combustion model. This model directly simulates large-scale convective and radiative transport phenomena. The small length and time scales physical processes are, on the other hand estimated. The actual combustion process in the fire is not simulated. As such, the model inherently assumed that the reaction of fuel and oxygen is infinitely fast (fuel and oxygen cannot co-exist and they will react at any temperature). The local heat release rate is computed from the local oxygen consumption rate at the flame surface.
FDS has been the subject of numerous validations [13]. The validation efforts included: comparison with full-scale tests conducted specifically for code evaluation, comparison with engineering correlations, comparison with previously published full-scale test data, comparison with standard test, and comparison with documented fire experience.
Numerical Modelling of Fire Tests
The two North and South Roadways concrete tubes are completely separated. Therefore, only the North Roadway of the tunnel and its galleries (Figure 7) were simulated with a grid consisting of about 800,000 control volumes. A special refined grid was constructed around the fire source (60 x 162 x 50). Two transient numerical simulations were conducted to represent the ventilation scenarios used for both fire tests (hereinafter referred to as “Scenario 1” and “Scenario 2”). Fans were simulated as mass sources or sinks depending on the ventilation scenario. Free boundaries with the pressure equal to the static ambient pressure were assumed at the North and South Portals.
A propane source, approximately, 1.8 m long, 1.5 m wide and 0.7 m high was used to simulate the experimental fire source. The fire source with a heat output of 2 MW was placed at a distance of 356 m and 689 m from the North Portal for Scenarios 1 and 2, respectively. The fuel was assumed to be propane with modified soot yield to account for the extra smoke produced by the smoke bombs added for visualization during the field measurements. The smoke yield of the smoke bomb was calculated to be 0.663 g/g [14].
Ventilation Scenario 1: fresh air was supplied through the sidewall vents of the
galleries of fans VA103 and V201 and hot smoke and fire products were exhausted through the tunnel ceiling fans VE151 and VE153. Fresh air was also drawn through the North and South Portals.