ORIGINAL ARTICLE
Expression of pSTAT5 predicts
FLT3 internal tandem
duplications in acute myeloid leukemia
Ellen Christina Obermann&Caroline Arber&Martine Jotterand&Andre Tichelli&
Petra Hirschmann&Alexandar Tzankov
Received: 2 August 2009 / Accepted: 15 December 2009 / Published online: 12 January 2010 # Springer-Verlag 2010
Abstract Mutations of the Fms-like tyrosine kinase 3 (FLT3) can be detected in a significant number of acute myeloid leukemias (AML). Seventy-five cases of acute myeloid leukemia were evaluated for FLT3-internal tandem duplications (ITD) by polymerase chain reaction. Paraffin-embedded formalin-fixed trephine biopsies of these cases were evaluated for expression of phosphorylated signal transducer and activator of transcription 1 (pSTAT1), pSTAT3, and pSTAT5. Specific expression of pSTAT5 was proven in leukemic blasts in situ by double staining with a blast-specific marker. Expression of pSTAT5 in≥1% of blasts was highly predictive of FLT3-ITD. Neither expression of pSTAT1 nor pSTAT3 were associated with FLT3 mutations. Altogether we conclude that pSTAT5 expression can precisely be assessed by immunohistochemistry in rou-tinely processed bone marrow trephines, STAT5 is highly likely the preferred second messenger of FLT3-mediated signaling in AML, and expression of pSTAT5 is predictive of FLT3-ITD.
Keywords Acute myeloid leukemia . FLT3 . FLT3-ITD . pSTAT5
Introduction
The gene for Fms-like tyrosine kinase 3 (FLT3) encodes a receptor tyrosine kinase that plays an important role in hematopoiesis [1]. FLT3 is recurrently targeted by genetic aberrations in leukemias. FLT3 mutations may be internal tandem duplications (ITD) of the exons encoding for the juxtamembrane domain or point mutations in the tyrosine kinase domain [2]. FLT3 may possibly be activated by translocations as well [3, 4]. FLT3-ITD can be found in 20% to 30% of patients with de novo acute myelogenous leukemia (AML) [5–8]. It leads to the disruption of a repressor sequence in the juxtamembrane domain of the FLT3 gene, which causes a constitutive autophosphoryla-tion of the receptor [9]. This in turn promotes cell proliferation and inhibits apoptosis in leukemic blasts [9,
10]. Alterations of FLT3 seem to be of significant consequence in the clinical behavior of AML [5, 6, 8,
11]. Though the most recent edition of the World Health Organization (WHO)-Classification of Tumours of Haema-topoietic and Lymphoid Tissues introduced the incorpora-tion of genetic abnormalities into diagnostic algorithms for the diagnosis of AML, FLT3 mutations were not included as a defining criterion for any distinct entity since they frequently accompany other well-recognized genetic lesions. However, in cases of cytogenetically normal AML and in AML with myelodysplasia-related changes, assessment of FLT3 mutations is recommended, and, if present, the abnormality should be noted along with the diagnosis [11].
Ellen C. Obermann and Caroline Arber contributed equally to this work E. C. Obermann
:
P. Hirschmann:
A. Tzankov (*)Institute of Pathology, University of Basel, Schönbeinstrasse 40,
4031 Basel, Switzerland e-mail: [email protected] C. Arber
:
A. TichelliHematology Unit, University of Basel, Basel, Switzerland
M. Jotterand
Unité cytogénétique du cancer,
Centre Hospitalier Universitaire Vaudois, Lausanne, Switzerland
The signal transducers and activators of transcription (STAT) gene family consist of seven proteins [12]. STAT-mediated signal transduction pathways influence neoplastic processes on a broad basis by perturbing control over survival, differentiation, proliferation, and apoptosis [13]. Aberrant activation of STAT3 and STAT5 (less often STAT1) has been demonstrated in diverse groups of neoplasms, including AML [14–16]. Activation of STAT is caused by tyrosine phosphorylation followed by the consecutive translocation of pSTAT into the nucleus [17]. In normal hematopoiesis, STAT5 is activated by receptor ligation of FLT3 to its ligand as well as by several other cytokines [18,19], thus STAT5 being the preferred second messenger of FLT3-mediated signaling.
The aim of this study was to assess protein expression of pSTAT1, pSTAT3, and pSTAT5 in a well-defined set of AML with known status of the FLT3 gene, in order to address whether STAT5 is the preferred signal transducer of FLT3 in AML and if presence of FLT3-ITD can be predicted by quantification of pSTAT5 in leukemic blasts.
Materials and methods Patients
A retrospective cohort of 75 patients with AML on first diagnosis was included in this study. All newly diagnosed patients with AML between 2005 and 2007 at the University Hospital Basel, who had been fully evaluated for cytogenetic alterations and molecular markers including presence of FLT3-ITD, were considered if paraffin blocks of bone marrow trephine biopsies were available and adequately preserved for immunohistochemical analyses. All cases were reclassified according to the most recent WHO criteria [11]. Clinical and follow-up data were obtained by reviewing the charts. Retrieval of tissue and clinical data were performed according to data safety laws. Of the 75 patients included in this study, 37 were male (mean age 59; median age 57; range 26–95), and 38 were female (mean age 56; median 59; range 20–89). The average follow-up time was 16.5 months (median 10; range 0–62 range). Within this time, 37 patients passed away. Most of the patients (n = 56) were treated with curative intention (intensive chemotherapy alone, n = 23; intensive chemotherapy followed by autologous hematopoietic stem cell transplantation, n = 5; intensive chemotherapy followed by allogeneic hematopoietic stem cell transplantation, n = 28). Nineteen patients, who did not qualify for intensive treatment, received best supportive care. Five of them were given hydroxyurea. The distribu-tion of cases according to the WHO classificadistribu-tion is presented in Table1.
Immunohistochemistry
Assessment of pSTAT expression profiles
Four-micrometer sections were cut to adhesive-coated slides and stained using standard procedures. The precise percentage of infiltrating blasts was identified by case-specific markers using standard staining procedures. The following antibodies were used: CD34 (M7165, DAKO, final dilution 1:10), CD117 (A4502, DAKO, final dilution 1:80), CD68 (M7165, DAKO, final dilution 1:10), CD14 1080, Neomarkers, final dilution 1:10), CD163 (MS-1103, Neomarkers, final dilution 1:5,000), and myeloper-oxidase (A0398, DAKO, final dilution 1:10). Staining of pSTAT1, pSTAT3, and pSTAT5 was performed as de-scribed previously [4, 16] using commercially available antibodies (pSTAT1: no. 9167; pSTAT3: no. 9145; pSTAT5: no. 9359; all by Cell Signaling). The specificity of the pSTAT3 and pSTAT5 stainings was corroborated by preabsorption experiments with corresponding blocking peptides (no. 1195, Cell Signaling, and no. 06-785-213045, GenWay, respectively). One high-power field containing at least 350 cells was assessed in each case to identify the percentage of positive cells (i.e., cells displaying a distinct nuclear staining). The slides were evaluated without knowledge of clinical data or mutational status. Of the cases, 20% were reassessed by a second observer.
Assessment of coexpression of pSTAT5 and blast-specific markers
Six cases were double stained with the anti-pSTAT5 antibody and a blast-specific marker (either CD34 or CD117) in order to prove that pSTAT5 is expressed in the leukemic population.
For double stains of CD34 and pSTAT5, the antibody for pSTAT5 was applied first and incubated at room temperature overnight. The alkaline-phosphatase (AK-5000, Vector Laboratories) technique was used for developing with Substrat Kit III (SK-5300, Vector Laboratories) as chromogen. The antibody against CD34 was consecu-tively applied for an incubation time of 120 min at 37°C; utilizing the avidin–biotin complex (AK-5100, Vector Laboratories) either Nova-Red (SK-4800, Vector Laborato-ries) or VIP (SK-4600, Vector LaboratoLaborato-ries) served as chromogens. For double stains of CD117 and pSTAT5, antibodies against CD117 were applied first for an incubation time of 120 min at 37°C; the reaction was visualized using the alkaline-phosphatase method with the chromogen Substrat Kit III. Antibodies against pSTAT5 were afterward incubated overnight at room temperature; the labeling was visualized with the aid of the avidin–biotin complex and Nova-Red as chromogen.
Cytogenetic analysis
Cytogenetic analyses were carried out at the Centre Hospitalier Universitaire Vaudois in Lausanne (Unité cytogénétique du cancer). Cell culture and chromosome preparation were performed as reported previously [20]. Chromosomes were stained in G-bands. Karyotypes were described according to the International System for Human Cytogenetic Nomenclature [21].
FLT3-ITD and nucleophosmin (NPM1) mutations detection All samples were analyzed for FLT3-ITD in exons 14 and 15 by reverse transcription-polymerase chain reaction (RT-PCR) and agarose gel electrophoresis as previously described [22]. RNA and cDNA were prepared from bone marrow or from peripheral blood in patients with a dry tap. cDNA (1 μg) was added to a total of 30-μl reaction mix containing nuclease-free water (Catalyse AG), 15 mM magnesium chloride (10× Puffer Qiagen), 10 mM dNTP (Invitrogen), 10μM forward primer, 10 μM reverse primer, and Taq polymerase (Qiagen). The following primers were used: 5′-AGC AAT TTA GGT ATG AAA GCC AG-3′ as forward primer and 5′-CCT TCC CAA ACT CTA AAT TTT CTC T-3′ as reverse primer (Microsynth). Preheating of the samples at 95°C for 5′ was followed by amplification for 35 cycles consisting of 30-s denaturation at 95°C, 30-s annealing at 60°C, and 45-s elongation at 72°C. After completion of these cycles, a final elongation of 5 min at 72°C was performed. Amplified PCR products were
supplemented with 6 μl loading buffer (Catalyse AG). Of the final product, 15 μl were loaded on a 3% agarose gel and analyzed by electrophoresis and ethidium bromide staining. As a control, the cell line MV4-11 (ATCC) known to contain the FLT3-ITD at 171 bp was included in every analysis. The sensitivity of the assay was 10−2. Samples of all AML patients with normal karyotypes, irrespective of the disease subtype according to the WHO classification, were analyzed for NPM1 mutations as described [23]. The following primers were used: 5′-GCG CCA GTG AAG AAA TCT ATA C-3′ as forward primer and 5′GGA CAA CAT TTA TCA AAC ACG G-3′ as reverse primer (Micro-synth). PCR products were analyzed on the ABI3130 Genetic Analyzer (Applied Biosystems). NPM1-positive samples were sequenced to determine the type of mutation. Statistical analysis
Statistical analyses were performed using SPSS version 15.0 (SPSS, Chicago, IL). Incomplete data were not excluded from the tests. The degree of agreement between the quantitative immunohistochemical values by the differ-ent observers was evaluated by intra/interclass correlation coefficients, using reliability Cronbach’s Alpha analysis. The Fisher’s exact test was used to analyze differences in case numbers distribution between groups. Mann–Whitney or Kruskal–Wallis tests were applied as appropriate to assess mean differences between groups. The prognostic performance of the variables and determination of optimal cutoff values was established by receiver Table 1 Patient characteristics and distribution of FLT3-ITD
AML, classified according to WHO [11] Number of cases Cases with FLT3-ITD Casesawith NPM1 mutation AML with recurrent genetic abnormalities
AML with t(8;21); RUNX1-RUNX1T1 4 0
AML with inv(16); CBFB-MYH11 4 0
Acute promyelocytic leukemia with t(15;17); PML-RARA 1 1
AML with myelodysplasia-related changes 21 1 3/4
Therapy-related AMLb 10 0 0/2
AML, not otherwise specified (NOS)
AML, NOS with normal karyotype 19 11 14/17
AML, NOS with single genetic aberrations 7 2
AML, NOS with complex aberrations 5 0
Others
Transformation of myeloproliferative neoplasmc 4 1 0/1
Total 75 16
a
All 26 AML cases with normal karyotypes were tested for NPM1 mutations, irrespective of the disease subtype according to the WHO classification; analysis succeeded in 24 cases; the results represent mutated cases out of all analyzable cases with normal karyotypes within the respective entity
b
There were three additional acute promyelocytic leukemia with t(15;17) cases in this group, but considering the clinical history, these patients had to be properly classified as therapy-related AML
c
operating characteristic (ROC)-curves plotting sensitivity vs 1-specificity with special considerations of the respective area under the ROC (AUROC). The optimal cutoff point was calculated using Youden’s index (Y), denoting Y= sensitivity + specificity–1, since this method can be applied to find the optimal cutoff value with the highest sensitivity and specificity when there is no particular requirement on sensitivity and/or specificity [24]. Disease-specific survival was analyzed by the Kaplan–Meier method and compared by the logrank test in univariable modus and by the Cox regression analysis in multivariable modus. Solely factors, which turned out to be of prognostic significance in the univariable modus, were entered into the multivariable analysis. Statistical significance was defined as p < 0.05 and corrected for multiple testing, when necessary. Two-sided tests were used throughout.
Results
Distribution of FLT3-ITD and NPM1 mutations
Altogether, 16 out of 75 cases (21%) showed FLT3-ITD (males 11/38; females 5/37). The distribution of FLT3-ITD among the different types of AML is displayed in Table1. NPM1 mutations were detected in 17/24 evaluable AML patients with normal karyotypes (Table1); 16 of these were type A mutations, and 8 were observed in FLT3-ITD cases. Immunohistochemistry
Immunohistochemical stainings were evaluable in 65 cases for pSTAT1, 65 cases for pSTAT3, and 60 cases for pSTAT5 (Fig.1a–f). pSTAT3 and pSTAT5 stainings could be fully oppressed by preabsorption with the respective blocking peptides. Blasts were considered to express the respective marker if their nuclear staining was clearly detectable against the background. Positivity in nuclei of lymphocytes, neutrophils, erythroid precursors, and vascu-lar walls served as an internal control (Fig. 1a–f). The interclass correlation for interobserver variability was excellent for pSTAT5 (p=0.002, alpha=0.740), good for pSTAT1 (p = 0.006, alpha = 0.651), and acceptable for pSTAT3 (p=0.05, alpha=0.517).
pSTAT5 was expressed in a mean 11 ± 13% blasts (median 2.5%, range 0.8–39%) in AML with FLT3-ITD as opposed to 0.7±0.9% (median 0.4%, 0–3.7%) in cases without FLT3 abnormalities (pMann–Whitney-U<0.0001), but there were no significant differences for pSTAT1 or pSTAT3, respectively (Fig. 2, Table 2). Importantly, pSTAT5 was expressed in only 0.2±0.3% blasts in the three analyzable AML transformations of
myeloprolifera-tive neoplasm cases; one AML transformation of myelo-proliferative neoplasm case with FLT3-ITD was not analyzable for pSTAT5. Double staining of pSTAT5 and the blast-specific markers CD34 or CD117 showed coex-pression of the two markers, proving the correct labeling of blasts by the antibody against pSTAT5 (Fig.1f).
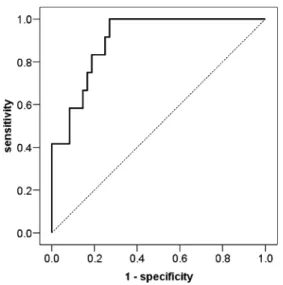
The AUROC of the predictive value of pSTAT5 expression for FLT3-ITD was 0.901 (95% confidence interval 0.822–0.980) with a cutoff with both maximum specificity (73%) and sensitivity (100%) suggested by the Youden’s index of >0.8% (Fig.3). The positive predictive value (PPV) for the presence of FLT3-ITD in AML cases with expression of pSTAT5 in >0.8% of blasts was 57%; the negative predictive value (NPV) was 100%. Applying Fig. 1 a pSTAT1 expression in AML; note scattered positive neutrophils and lymphocytes as well as negative megakaryocytes; immunoperoxidase stain, 200×. b pSTAT3 expression in AML; note scattered positive blasts; immunoperoxidase stain, 200×. c, d pSTAT5 expression in erythroid precursor islet and in microvascular walls of FLT3 wild-type AML; immunoperoxidase stain, 200×. e Abundant pSTAT5 expression in FLT3-ITD AML; immunoperoxidase stain, 200×. f CD117 (blue)/pSTAT5 (red) double stain showing colocaliza-tion of signals; immunoperoxidase stain, 640×
this cutoff, all 12 FLT3-ITD cases were identifiable, while seven out of 48 cases without FLT3-ITD also expressed pSTAT5 in >0.8% of blasts (pFisher’s<0.001). The cutoff with highest specificity was 4.7% with a PPV of 100% (since not a single case without FLT3-ITD expressed pSTAT5 in >4.7% of blasts) and a NPV of 86%.
Clinical outcome
Survival data were available for all patients. Thirty-seven patients died within 16 months with a mean survival of 6.1 months. The univariable analysis of clinical parameters (age below vs equal/above 60 years, sex), disease subtype according to the WHO classification, FLT3 status, NPM1 status, expression of pSTAT1, 3, and 5, and type of therapy, for their prognostic significance showed that the disease subtype according to the WHO classification (p<0.001), age at diagnosis (p<0.001), and therapy type (p<0.001) predicted survival, while the other parameters showed no influence. Only in AML not otherwise specified (NOS) with normal karyotype (n= 19, all but two treated in curative intention) presence of FLT3-ITD but not of NPM1 mutations turned out to be of prognostic signifi-cance (p = 0.033; Fig. 4). Consideration of the NPM1
status in our series of AML, NOS with normal karyotype was of no additional prognostic value neither in all cases nor in cases split according to their FLT3 status. This was also the case for the prognostic significance NPM1 Fig. 3 ROC curve indicating a significant discriminatory potential of the amount of pSTAT5 expressing blasts for predicting FLT3-ITD. Note that the dark ROC curve never crosses the dotted reference line (corresponding to random guess or variable without diagnostic capability) and that the AUROC is 0.901, indicating that consideration of pSTAT5 is as 40% more accurate to predict presence/absence of FLT3-ITD as a random guess (for more details, see [24]). The curve point at a sensitivity of 1 (100%) and specificity of 0.73 (73%; 1-specificity = 0.27) is at greatest distance away from the reference line. Considering increased pSTAT5 expressing blasts, these coordinates correspond to an optimal cutoff for the prediction of FLT3-ITD of >0.8%
Fig. 2 Boxplot of pSTAT5 expression in FLT3 wild type (wt) and mutated (ITD) acute myelogenous leukemia cases; pMann–Whitney-U< 0.0001
Table 2 Expression of pSTAT1, 3, and 5 with respect to FLT3-ITD status
Mean number of positive blasts per HPFa
pSTAT1 pSTAT3 pSTAT5
FLT3 wild type 9±21 (50) 38±39 (45) 21±24 (48) FLT3-ITD 6±8 (15) 46±42 (10) 167±262 (12)
p value ns ns 0.004
a
HPF high-power field, i.e., 0.177 mm2, ns not significant Number of evaluable cases is shown in brackets
Fig. 4 Kaplan–Meier survival curves of AML, not otherwise specified cases with normal karyotype with respect to the FLT3 status; the p value has been calculated by applying the logrank test. Two out of eight AML patients without FLT3-ITD died (mean survival 44 months, median not reached), while seven out of 11 AML patients with FLT3-ITD died (mean survival 16 months, median 6 months; p=0.033)
mutations in AML with myelodysplasia-related changes with normal karyotypes.
When the prognostic parameters were assessed in a multivariable manner, only type of therapy (p=0.03) and age (p<0.001) retained their statistical significance for all AML. In a multivariable model in AML, NOS with normal karyotype FLT3-ITD turned to be an age- and therapy type-independent negative prognostic factor, even after correc-tion for multiple testing (p=0.026, relative risk 7.62, 95% confidence interval 1.28–45.34).
Discussion
Here, we were able to show that assessment of pSTAT1-, 3-, and, particularly, pSTAT5-positive blasts is reproducibly possible in formalin-fixed paraffin-embedded trephine bone marrow biopsies by immunohistochemistry. Of the markers analyzed, assessment of pSTAT3 showed only acceptable interobserver reproducibility, primarily due to the presence of weakly stained blasts, which were variably taken into consideration by the observers. This finding should be considered in future in situ bone marrow studies addressing pSTAT3 expression.
In addition, we demonstrated that pSTAT5 expression is significantly correlated to FLT3-ITD and proved by double labeling that pSTAT5 is specifically expressed in myeloid blasts (Fig. 1f), indicating that, similarly to normal hematopoiesis, STAT5 is highly likely the pre-ferred second messenger of FLT3-mediated cell signaling. The distribution of FLT3-ITD AML cases (21% of the studied samples) and the observed strong prognostic impact of FLT3-ITD in AML with normal karyotypes are in line with the literature, reporting such mutations in approximately 25% of AML and association with an adverse clinical outcome with poor overall survival and a higher risk of relapse, particularly in AML with normal karyotypes [5,6]. These basic characteristics of our cohort additionally point toward its representativeness.
FLT3 and its downstream STAT-related pathways play a fundamental role in AML [14, 15]. Therefore, assessment of FLT3 mutations as well as addressing their functional significance, e.g., by measurement of pSTAT5 might be important. Analysis of pSTAT has been attempted by different methodologies such as flow cytometry [25], electrophoretic mobility shift assays [15,26], and western blot analysis [27,28]. Interestingly, the percentage of cases with pSTAT expression varied between 7% [26] and 95% [28]. Some discrepancies can probably be attributed to the applied methodologies as well as the sensitivity and specificity of the antibodies. However, the specificity of the anti-pSTAT5 antibody applied in this study has been proven previously [4, 16] and additionally in the present
study by preabsorption with a corresponding blocking peptide. Addressing the strengths and drawbacks of western blot analysis, samples may contain other cells, such as vascular structures or erythroid precursors, which can also express pSTAT5, as shown in Fig. 1c, d. Association of pSTAT5 expression and FLT3-ITD in AML is obviously only relevant for pSTAT5 expression in blasts. Identifica-tion of in situ pSTAT5 expression in blasts seems to be possible only when the microtopography of the evaluated tissue sample is preserved, which is the case in our technique, but not in western blot or electrophoretic mobility shift assays. Assessment of STAT5 gene expression by quantitative PCR would not be helpful as well since the phosphorylated (active) protein amount and its microtopographic distribution is of relevance. Importantly, on the functional level, it has been clearly shown that mutations of FLT3 result in the strong activation of STAT5 [2, 29], and vice versa, constitutive phosphorylation of STAT5 can efficiently be downregulated by a FLT3 tyrosine kinase inhibitor [30].
Our findings support the hypothesis that FLT3 mutations lead to an activation of STAT5, which in turn can be assessed in order to predict the FLT3 status. Furthermore, both FLT3 and STAT5 have been identified as potential new therapeutic targets for treatment of patients with AML [31]. In particular, combining FLT3 inhibitors and agents, such as antisense nucleotides, small molecular inhibitors, or shRNA, targeting STAT and STAT-related pathways has been recommended by some authors [32]. Therefore, simultaneous assessment of both FLT3 mutation status and STAT5 expression and phosphorylation status might be required in the future for selecting AML patients for targeted therapies.
References
1. Small D, Levenstein M, Kim E, Carow C, Amin S, Rockwell P et al (1994) STK-1, the human homolog of Flk-2/Flt-3, is selectively expressed in CD34+ human bone marrow cells and is involved in the proliferation of early progenitor/stem cells. Proc Natl Acad Sci USA 91:459–463
2. Choudhary C, Muller-Tidow C, Berdel WE, Serve H (2005) Signal transduction of oncogenic Flt3. Int J Hematol 82:93–99 3. Vu HA, Xinh PT, Masuda M, Motoji T, Toyoda A, Sakaki Y et al
(2006) FLT3 is fused to ETV6 in a myeloproliferative disorder with hypereosinophilia and a t(12;13)(p13;q12) translocation. Leukemia 20:1414–1421
4. Tzankov A, Sotlar K, Muhlematter D, Theocharides A, Went P, Jotterand M et al (2008) Systemic mastocytosis with associated myeloproliferative disease and precursor B lymphoblastic leukaemia with t(13;13)(q12;q22) involving FLT3. J Clin Pathol 61:958–961 5. Kiyoi H, Naoe T, Nakano Y, Yokota S, Minami S, Miyawaki S et
al (1999) Prognostic implication of FLT3 and N-RAS gene mutations in acute myeloid leukemia. Blood 93:3074–3080 6. Kottaridis PD, Gale RE, Frew ME, Harrison G, Langabeer SE,
duplication in patients with acute myeloid leukemia (AML) adds important prognostic information to cytogenetic risk group and response to the first cycle of chemotherapy: analysis of 854 patients from the United Kingdom Medical Research Council AML 10 and 12 trials. Blood 98:1752–1759
7. Yamamoto Y, Kiyoi H, Nakano Y, Suzuki R, Kodera Y, Miyawaki S et al (2001) Activating mutation of D835 within the activation loop of FLT3 in human hematologic malignancies. Blood 97:2434– 2439
8. Ozeki K, Kiyoi H, Hirose Y, Iwai M, Ninomiya M, Kodera Y et al (2004) Biologic and clinical significance of the FLT3 transcript level in acute myeloid leukemia. Blood 103:1901–1908 9. Reilly JT (2003) FLT3 and its role in the pathogenesis of acute
myeloid leukaemia. Leuk Lymphoma 44:1–7
10. Nakao M, Yokota S, Iwai T, Kaneko H, Horiike S, Kashima K et al (1996) Internal tandem duplication of the flt3 gene found in acute myeloid leukemia. Leukemia 10:1911–1918
11. Swerdlow SH, Campo E, Harris NL, Jaffe ES, Pileri SA, Stein H, Thiele J, Vardiman JW (2008) WHO classification of tumours of haematopoietic and lymphoid tissues. IARC, Lyon
12. Krebs DL, Hilton DJ (2001) SOCS proteins: negative regulators of cytokine signaling. Stem Cells 19:378–387
13. Bowman T, Garcia R, Turkson J, Jove R (2000) STATs in oncogenesis. Oncogene 19:2474–2488
14. Gouilleux-Gruart V, Gouilleux F, Desaint C, Claisse JF, Capiod JC, Delobel J et al (1996) STAT-related transcription factors are constitutively activated in peripheral blood cells from acute leukemia patients. Blood 87:1692–1697
15. Xia Z, Baer MR, Block AW, Baumann H, Wetzler M (1998) Expression of signal transducers and activators of transcription proteins in acute myeloid leukemia blasts. Cancer Res 58:3173–3180 16. Meier C, Hoeller S, Bourgau C, Hirschmann P, Schwaller J, Went P et al (2009) Recurrent numerical aberrations of JAK2 and deregulation of the JAK2-STAT cascade in lymphomas. Mod Pathol 22:476–487
17. Coffer PJ, Koenderman L, de Groot RP (2000) The role of STATs in myeloid differentiation and leukemia. Oncogene 19:2511–2522 18. Mui AL, Wakao H, O'Farrell AM, Harada N, Miyajima A (1995) Interleukin-3, granulocyte-macrophage colony stimulating factor and interleukin-5 transduce signals through two STAT5 homologs. EMBO J 14:1166–1175
19. Zhang S, Fukuda S, Lee Y, Hangoc G, Cooper S, Spolski R et al (2000) Essential role of signal transducer and activator of transcription (Stat)5a but not Stat5b for Flt3-dependent signaling. J Exp Med 192:719–728
20. Castagne C, Muhlematter D, van Melle G, Gachoud V, Jotterand Bellomo M (1997) Effect of conditioned media, nutritive elements, and mitotic synchronization on the accuracy of the
cytogenetic analysis in acute nonlymphocytic leukemia patients presenting with inv(16)/t(16;16) or t(15;17). Cancer Genet Cytogenet 94:106–112
21. Mitelman F (1995) An international system for human cytogenetic nomenclature. Karger, Basel
22. Rombouts EJ, Pavic B, Lowenberg B, Ploemacher RE (2004) Relation between CXCR-4 expression, Flt3 mutations, and unfavorable prognosis of adult acute myeloid leukemia. Blood 104:550–557
23. Falini B, Mecucci C, Tiacci E, Alcalay M, Rosati R, Pasqualucci L et al (2005) Cytoplasmic nucleophosmin in acute myelogenous leukemia with a normal karyotype. N Engl J Med 352:254–266 24. Tzankov A, Zlobec I, Went P, Robl H, Hoeller S, Dirnhofer S
(2009) Prognostic immunophenotypic biomarker studies in diffuse large B cell lymphoma with special emphasis on rational determination of cut-off scores. Leuk Lymphoma. doi:10.3109/ 10428190903370338
25. Pallis M, Seedhouse C, Grundy M, Russell N (2003) Flow cytometric measurement of phosphorylated STAT5 in AML: lack of specific association with FLT3 internal tandem duplications. Leuk Res 27:803–805
26. Weber-Nordt RM, Egen C, Wehinger J, Ludwig W, Gouilleux-Gruart V, Mertelsmann R et al (1996) Constitutive activation of STAT proteins in primary lymphoid and myeloid leukemia cells and in Epstein–Barr virus (EBV)-related lymphoma cell lines. Blood 88:809–816
27. Birkenkamp KU, Geugien M, Lemmink HH, Kruijer W, Vellenga E (2001) Regulation of constitutive STAT5 phosphorylation in acute myeloid leukemia blasts. Leukemia 15:1923–1931 28. Spiekermann K, Pau M, Schwab R, Schmieja K, Franzrahe S,
Hiddemann W (2002) Constitutive activation of STAT3 and STAT5 is induced by leukemic fusion proteins with protein tyrosine kinase activity and is sufficient for transformation of hematopoietic precursor cells. Exp Hematol 30:262–271 29. Rocnik JL, Okabe R, Yu JC, Lee BH, Giese N, Schenkein DP et al
(2006) Roles of tyrosine 589 and 591 in STAT5 activation and transformation mediated by FLT3-ITD. Blood 108:1339–1345 30. Spiekermann K, Dirschinger RJ, Schwab R, Bagrintseva K, Faber
F, Buske C et al (2003) The protein tyrosine kinase inhibitor SU5614 inhibits FLT3 and induces growth arrest and apoptosis in AML-derived cell lines expressing a constitutively activated FLT3. Blood 101:1494–1504
31. Stirewalt DL, Meshinchi S, Radich JP (2003) Molecular targets in acute myelogenous leukemia. Blood 17:15–23
32. Zhou J, Bi C, Janakakumara JV, Liu SC, Chng WJ, Tay KG et al (2009) Enhanced activation of STAT pathways and overexpres-sion of survivin confer resistance to FLT3 inhibitors and could be therapeutic targets in AML. Blood 113:4052–4062