Phase coexistence and critical temperatures of the
(Bi, Pb)
2Sr
2Ca
2Cu
3O
xphase under partial pressures of oxygen
between 10
–3and 0.21 bar with and without additions of silver
M. D¨aumling,a) R. Maad, A. Jeremie, and R. Fl¨ukiger
D´epartement de Physique de la Mati`ere Condens´ee, Universit´e de Gen`eve, 24, quai Ernest-Ansermet, CH-1211 Gen`eve 4, Switzerland
(Received 29 July 1995; accepted 4 February 1997)
We have investigated the stability of the (Bi, Pb)2Sr2Ca2Cu3Ox phase for the stoichiometry (Bi : Pb : Sr : Ca : Cu 1.72 : 0.34 : 1.83 : 1.97 : 3.13), subjecting it to temperatures between 700 and 850±C under various oxygen partial pressures. A narrow region was found in which Bi, Pb(2223) was the only superconducting phase. This region follows closely the thermal decomposition line. X-ray pure Bi, Pb(2223) will partially decompose if treated outside of the stability region. For a given oxygen partial pressure, the Bi, Pb(2223) phase tends to coexist with the 2201 phase for temperatures above, and the 2212 phase for temperatures below this region. At even lower temperatures an additional lead-rich phase appears. Critical temperatures Tc vary little with treatment and range between 108.5 K and 110.8 K. If 10% silver is added to the starting powder, the phase coexistence regions shift. Silver does not seem to have a significant effect on the absolute values of the critical temperature. The Bi, Pb(2223) thermal decomposition temperature for a given oxygen pressure is lowered by at least 10 K by the presence of Ag.
I. INTRODUCTION
Since the discovery of the Bi2223 phase, it was found that the phase relationships and formation con-ditions are extremely complex. The stability limits of the already formed Bi2223 phase in a temperature-oxygen pressure phase diagram (Van’t Hoff diagram) were determined1–3 quickly. The work shows that the
decomposition line of the Bi2223 phase is coinciden-tal to the CuO – Cu2O line when the Bi2223 phase is
decomposing in a solid state reaction. As soon as a liquid appears (at higher temperatures), the two phase boundaries separate. However, as this phase cannot be prepared in a pure state other phases are always present during the measurements. Later studies4,5 focused on
the phase formation and phase formation kinetics of, in particular, the lead-doped version of the phase. Very recently the influence of lead on this decomposition line was reported.6 According to these data the
lead-containing phase is stable down to lower oxygen partial pressure than the pure phase, while the lines coincide for temperatures above about 775±C and oxygen pres-sures above about 10–3 bar. In the low temperature-high
oxygen pressure corner of the phase diagram (which always has to be transversed on cooldown when reacting in air, for example), other work7,8 on Pb-doped Bi2223 report the formation of precipitates and thus a partial
a)Currently at Forschungszentrum Karlsruhe, Institut fuer Technische Physik, Postfach 3640, D-76021 Karlsruhe, Germany.
decomposition of the Bi, Pb(2223) phase. Thus, a second decomposition line must be added to the phase diagram. Of interest has also been the influence of the process-ing conditions—in particular the oxygen partial pres-sure —on the critical temperature. For the Bi2212 phase it is well-known9 that the oxygen content in the phase can vary considerably, and with it the critical tempera-ture. For the Bi, Pb(2223) phase the corresponding data do not exist. In fact, it is not even known to what extent the phase can accommodate different oxygen stoi-chiometries. Some processing dependent enhancement of the critical temperature Tc has been reported.10,11 However, no systematic work on phase purity, phase stability, and critical temperature has been performed up to date.
The goal of this work was threefold: to establish a single phase field for the Bi, Pb(2223) phase, to meas-ure the critical temperatmeas-ure for the Bi, Pb(2223) in the different phase fields, and to study the influence of silver on both the critical temperature and the phase diagram. Since this is an enormous task, we have limited ourselves to a fairly coarse matrix of points in the temperature-oxygen pressure plane. The tools used were the measurement of the critical temperature and the x-ray diffraction pattern to qualitatively determine the phases present. Since an exact determination of the content of the light phases (for example the alkaline earth cuprates) is difficult using x-ray methods, alone, we have concentrated on the phases Bi, Pb(2223), Bi(Pb)2212, and Bi(Pb)2201, the lead content of the latter two being
undetermined. Future work should use a finer grid close to the single phase region and also should include metallographic investigations to characterize all phases.
II. EXPERIMENTAL DETAILS
All our samples were synthesized from coprecipi-tated powders of the stoichiometry Bi : Pb : Sr : Ca : Cu 1.72 : 0.34 : 1.83 : 1.97 : 3.13. This composition was chosen because many studies on silver-sheathed Bi, Pb(2223) tapes use this composition.12,13 Organic
components were removed with an anneal at 600±C for 2 h. The powder then was reground and pressed with a pressure of 40 MPa into pellets of 25 mm diameter. These were then calcined twice for 24 h at 820±C in air, with grinding and pressing steps in between. Then the Bi, Pb(2223) phase was formed at 850±C in air, repeating the regrinding and pressing steps after each 30 h until a total heat-treatment time of 150 h at 850±C was reached. In order to investigate the influence of silver on the phase diagram, 10% silver powder (size 5 mm) was mixed with half of the powder. Then the pellets were pressed again, followed by an additional anneal of 30 h at 840±C in air. Thus both the pure and silver-containing specimens have experienced identical preparation conditions. The relative density of the pellets is of the order of 70%. At this point the pellets were cut and small pieces were treated under different oxygen pressures and temperatures for 60 h. This time was considered long enough in order to show decompositions, if they occur. However, thermodynamic equilibrium may not be reached in this time. The furnace was heated up at 150 Kyh. For the cooldown the sample tube was removed from the split hinge furnace, letting it aircool, a process which typically leads to initial cooldown rates of the order of 1000 Kymin. The gas flow (typically 50 to 100 mlymin) was kept constant until the specimen had reached room temperature. The different oxygen atmospheres were generated by mixing (electronically controlled) pure Ar gas with purchased gas mixtures of argon and oxygen, thus permitting a variable gas atmosphere from about 0.001% oxygen to air. The nominally “pure” Ar gas has a rest O partial pressure of about 20 ppm. The oxygen content of the gas and the leak tightness of the furnace were verified with a Centorr oxygen partial pressure analyzer (containing a solid electrolyte yttria stabilized zirconium oxide voltaic cell).
X-ray scattering was performed with a Siemens diffractometer with Cu radiation. Critical temperatures were measured with an ac susceptometer, consisting of a balanced pair of pickup coils inside a primary coil. They are thermally connected to a closed cycle cryocooler, permitting temperatures between 10 and 300 K to be achieved. Differential thermogravimetric analysis (TGA) was performed in a SETARAM TAG 24 instrument.
III. RESULTS
A. Phase coexistence
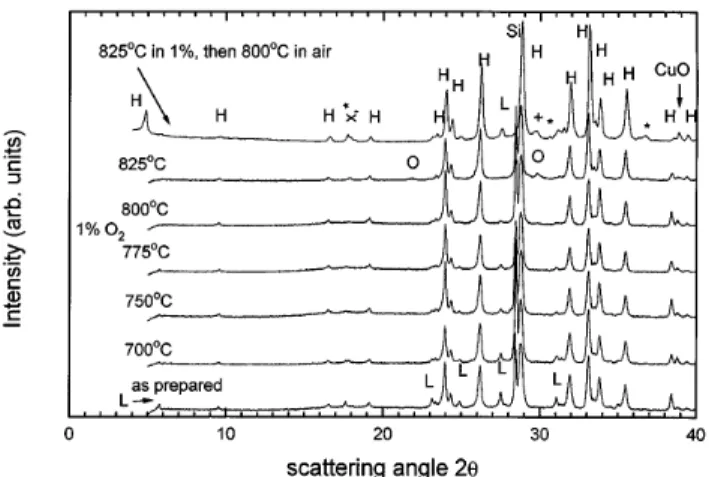
The x-ray diffraction patterns of some specimens (without Ag) treated for 60 h in a constant atmosphere at various temperatures are shown in Fig. 1, together with the spectrum of the specimen as it was prepared. Si powder was added to some specimens for cali-bration purposes. The Bi, Pb(2223) phase that initially formed is not pure, but contains the two-layer phase Bi2Sr2CaCu2Oy(2212) and traces of CuO and Ca2PbO4.
As these specimens are subjected to a 60 h treatment in various atmospheres and temperatures, their second phase content changes. The 2212 content of the specimen decreases as the annealing temperature is increased, keeping the atmosphere constant at 1% oxygen. For the highest annealing temperature (825 ±C), 2212 has disappeared altogether and 2201 has appeared in its place. This implies that there is a region in which the second phase content is minimized, or even zero (see below). If this specimen is reannealed in air at 800 ±C, the 2212 phase reappears, in addition to other phases (see below). As we have limited our heat-treatment time to 60 h, we are unable to state whether the Bi, Pb(2223) content of this specimen would further decrease if the heat-treatment time were increased. The 2212 formation appears to be rather quick as shorter anneals (24 h) have also produced this effect.14
We have had marked difficulties in producing spec-imens that did not show any traces of phases other than Bi, Pb(2223). Our purest specimens contain no longer the 2201 or 2212 phases, but even they show traces of Ca2PbO4 and CuO. For simplicity we have denoted
such specimens as “single phase” in the remainder of the article, even though in a strict metallurgical sense they
FIG. 1. X-ray scattering spectra (taken with Cu radiation) from speci-mens annealed for 60 h. Here the following abbreviations have been used: x Ca2PbO4, L 2212, O 2201, H Bi, Pb(2223),
are not (the same assumption is made in most literature investigations).
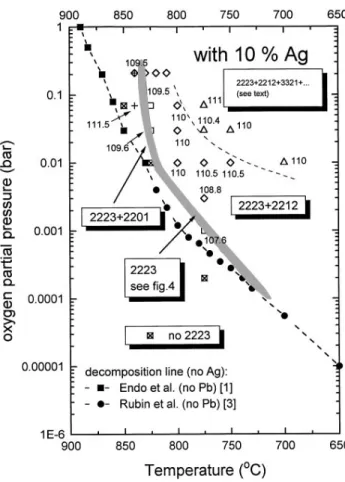
The results of the phase coexistence study are sum-marized for all specimens without silver in Fig. 2, and with silver in Fig. 3, where we have in particular em-phasized the coexistence of the superconducting phases. Also shown are the lines of thermal decomposition for “unleaded” Bi22231,3 as well as Bi, Pb(2223),6 which
roughly coincides with the line for the unleaded phase above about 775±C or 10–3 bar of oxygen pressure.
To make the diagram more readable, we have used a linear temperature axis instead of the more usual 1yT axis. Lattice parameters of the Bi, Pb(2223) phase were determined,15but do not show systematic variations with heat treatment.
There is a narrow phase region approximately fol-lowing the thermal decomposition line1,3,6 in which the
Bi, Pb(2223) phase appears to be single phase. The second phase content, in particular the content of 2212 or 2201 (as judged from the peak height of the corre-sponding x-ray lines), decreases gradually as this region is approached. A single phase specimen does decompose
FIG. 2. Stability diagram for Bi, Pb(2223) pellets. The lines and the shaded area are guides for the eye and reflect approximate boundaries between regions of different phase coexistence. The number beside each point is the critical temperature Tcin K. In addition to the phases
mentioned, all specimens contain traces of CuO and Ca2PbO4.
FIG. 3. Stability diagram for Bi, Pb(2223) pellets containing 10% silver. The lines and the shaded area are guides for the eye and reflect approximate boundaries between regions of different phase coexistence. The number beside each point is the critical temperature
Tc in K. In addition to the phases mentioned, all specimens contain
traces of CuO and Ca2PbO4. The tree points at 810, 820, and 830±C in air were taken from Ref. 14.
if treated outside this region. In some specimens the one-layer phase Bi2Sr2CuOy(2201) phase replaces 2212 as coexisting phase, in particular close to the decomposition line. We have not (one exception: 840 ±C, air, with Ag) observed the 2212 and 2201 phases together in the same specimen also containing Bi, Pb(2223). However, the 2212 phase appears to be present again above the thermal decomposition line of Bi, Pb(2223).5,6
For a given oxygen pressure there exist three dif-ferent possibilities for the annealing temperature depen-dence of the second phase content of the specimens, denoted (a), (b), or (c) in Fig. 4. Possibility (a) allows some width for the Bi, Pb(2223) phase field, while in (b) this width is close to zero. In case (c) Bi, Pb(2223) always coexists with either 2212 or 2201 or both. From the x-ray data we can exclude case (c), although detailed metallography may show otherwise. Our points are not spaced closely enough to distinguish cases (a) and (b). Future more detailed investigations must include metal-lography, and also take more detailed account of other phases like CuO or Ca2PbO4.
(a)
(b)
(c)
FIG. 4. (a – c) Schematic representation of phase coexistence con-cerning the shaded regions of Figs. 2 and 3. See text for explanation. In the upper-right corner of the diagram additional phases appear, tentatively being identified (by the x-ray spectra) as the lead-rich phase Sr2.5Bi0.5Pb3Ca2CuOz7 (3321 phase) and the phase Bi2(Sr, Ca)3O6.16 However,
unlike the report in Ref. 7 we were unable to positively identify the phase in the scanning electron microscope (SEM). In order to form this phase, some lead must leave
Bi, Pb(2223). Thus a low temperature decomposition line for Bi, Pb(2223) is defined by the appearance of the 3321 phase. The field containing the 3321 phase is extended to lower oxygen pressures in the presence of silver.
Silver also appears to shift the thermal decomposi-tion line to lower temperature. Our points are spaced too far apart in order to exactly determine this shift, but for example in 7% oxygen at 850 ±C the Bi, Pb(2223) phase is present in our Ag-free samples, but not in the silver-doped ones. This is also the case at 825±C in 1% oxygen. Thus, Ag lowers the thermal decomposition temperature by at least 10 K. This result is in disagreement with that of Ref. 6, where no difference for thermal decomposition line for pure and silver-containing specimens was found.
B. Weight loss
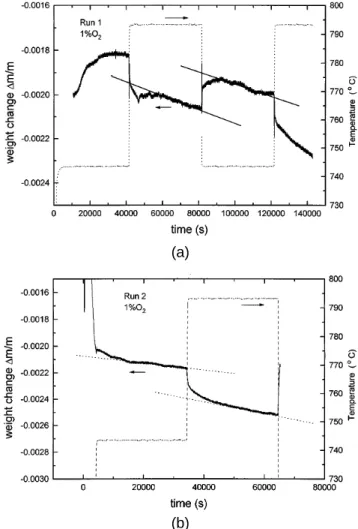
A thermogravimetric analysis was carried out on specimens treated at 790 ±C in 1% of oxygen. The spec-imen was then cycled between 744±C and 794±C in a 1% oxygen atmosphere, while measuring its weight (see Fig. 5). The changes in specimen weight are quite small
(a)
(b)
FIG. 5. (a, b) Weight change as a function of annealing time for Bi, Pb(2223). The right scale indicates the temperature as a function of time. The straight lines are a guide to the eye.
and are near the resolution of our TGA apparatus. Two runs were carried out, and for completeness both runs are shown in the figure. An initial weight loss (upon heating from room temperature) of about 0.2% was observed. This loss is probably due to adsorbed carbon dioxide or water which is driven off upon heating. The first hold at 744±C had the purpose of equilibrating the specimen. When changing the temperature from 744 to 794±C, a fairly rapid weight loss (time constant smaller than 5 h) of order 0.02% was observed. Approximately the same weight is gained upon decreasing the temperature to 744±C. If this change in weight is assigned to a loss or gain of oxygen, then it corresponds to about 0.01 oxygen units in the formula. For longer times there appears to be a continuous loss of weight taking place. This approximately linear loss with time is about 0.00082%yh and 0.0017%yh for temperatures of 744 or 794±C [taken from Fig. 5(b)], respectively. In order to find the cause of this linear loss, a clean quartz slab was placed above the specimen in another furnace under the same conditions. Then the deposit on it after the anneal was analyzed in the SEM using energy dispersive x-ray (EDX) analysis. The depos-it was found to consist of lead. Control slabs placed further away from the specimen did not show any deposit.
C. Critical temperature
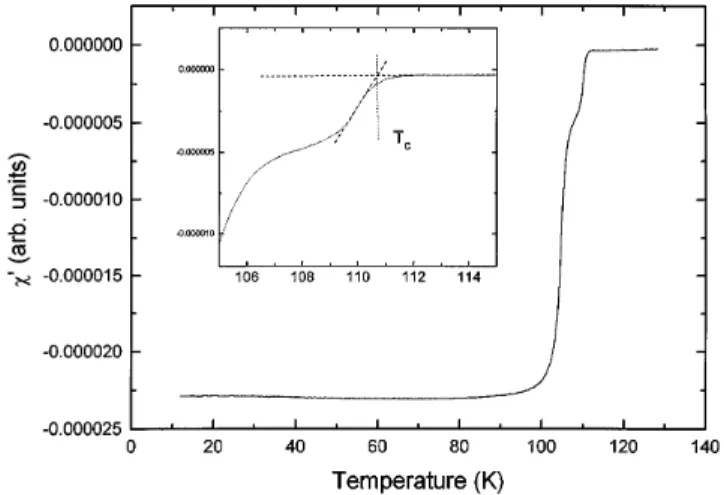
A typical ac susceptibility trace is shown in Fig. 6. The critical temperatures are extrapolated onset Tcvalues of the first transition, as indicated in the figure. For the purpose of this article, we have ignored the second transition at lower temperature which is caused by the coupling of the grains. The critical temperature of our starting material is 108.5 K, and does not change with further heat treatment. Critical temperatures for all spec-imens with and without silver after the post-treatment
FIG. 6. In-phase ac susceptibility signal for Bi, Pb(2223) specimen treated for 60 h at 775±C in 1% oxygen. The inset shows the definition of Tc.
of 60 h are indicated in Figs. 2 and 3, respectively. The maximum Tc value is about 111 K, independent of whether silver is present or not. The location of this Tc maximum in pO2-T space is, however, different. A maximum value of Tc 112.8 K was obtained when the Bi, Pb(2223) phase (without silver) was synthesized directly in 1% oxygen and 775 ±C, never having been exposed to higher temperatures.
The Tc changes observed appear to be reversible. The Tc value of a specimen which has been treated at 790±C in 1% of oxygen for 60 h rises to 110 K, but can be lowered again to 108.5 K (the starting value) by another anneal of 60 h at 840 ±C. This is the case despite the fact that some continuous loss of Pb —and thus a slight change in cation stoichiometry — has occurred.
For some single phase specimens the dependence of Tc on the annealing time at 775 ±C in 1% oxygen was studied. A time dependence similar to the one observed by Wang et al.11 was found: T
c rises from the original value of Tc 108.5 K to 110.8 K in less than 100 h. Further annealing up to another 100 h (or 200 h total) only raises Tcby another 0.5 K. Extending the annealing time to over 200 h seems to have no further effect.
IV. DISCUSSION
The Bi, Pb(2223) phase of our stoichiometry has a quite narrow single phase field, following closely the decomposition line. The TGA measurement showed very little variation in weight upon cycling the temperature, corresponding to a very small change in oxygen stoi-chiometry. In addition, the second phase content changes when cycling. Thus the changes in the Bi(Pb)2223 oxygen content are impossible to determine due to the presence of variable amounts of other phases. In order for the second phases to appear, it must be assumed that the cation stoichiometry of our Bi, Pb(2223) phase also changes. Thus the changes of the critical temperature can be regarded as a consequence of the small variation in the oxygen and cation stoichiometry of the Bi, Pb(2223) phase. In order to isolate the two contributions, com-positional analysis with respect to oxygen would have to be carried out on the specimens inside of the single phase region in order to determine whether the oxygen content of the phase changes at all when the cation concentration stays constant. However, the facts that (a) the annealing time necessary to change the critical temperature is quite long, and (b) the single phase region appears to be so narrow indicating that possibly just the cation stoichiometry determines the Tc.
It is useful to compare the 2223 and 2212 phases. For the 2212 phase the change in weight for the cycling carried out (Fig. 5) would be similar.9 However, the
second phase content of the 2212 phase stays constant, and thus all weight changes can be assigned to a change
in oxygen content, in contrast to the present results on Bi, Pb(2223)!
Wang et al.11 have succeeded in raising the T
cvalue of one of their specimens to 115 K, using a post-annealing treatment under reduced oxygen pressure. We have not been able to produce specimens with a Tcvalue this high in our work. In fact, they did not observed this high value of Tc for all their specimens, but only for a particular cation stoichiometry, which is different from ours. Their maximal Tcvalue for a cation stoichiometry similar to ours is 113 K, very similar to our maximal value of 112.8 K. In order to obtain the maximum Tc it appears to be necessary to change the cation stoichiometry, something which was not attempted in the present work.
More comments on the PbyBi stoichiometry seem necessary as well. If the total Pb loss at 840±C is 0.003%yh (extrapolated loss from the TGA measure-ments), then in the initial heat treatment (200 h) about 0.7% of the total weight or about 0.035 formula units of Pb are lost [if all weight loss is assigned to the Bi, Pb(2223) phase, which need not be necessarily the case]. Thus the post-annealing treatments at tempera-tures below 800±C do not change much the PbyBi stoichiometry, but the initial anneal does. Out highest Tcvalue (112.8 K) was obtained in a specimen in which the Bi, Pb(2223) phase was formed in 1% of oxygen at 790±C. At this reduced temperature the Pb evaporation rate is reduced by about a factor of four in comparison to the standard process. Thus we have another reason to believe that the Pb loss occurring during the anneal and thus the end cation stoichiometry may play the major role in the determination of the critical temperature.
V. SUMMARY
We have investigated the phase stability of the Bi, Pb(2223) phase for temperatures between 700 and 850±C and oxygen partial pressures between 0.001 and 0.21 bar. We find the following conclusions:
(i) The single phase region for our Bi, Pb(2223) is quite narrow. At a lower temperature Bi, Pb(2223) is always in coexistence with the 2212, at higher T typically with the 2201 phases (in addition to CuO and Ca2PbO4).
(ii) A lead-rich phase forms at the low temperature-high oxygen pressure end of the Van’t Hoff diagram,
an indication of at least a partial loss of Pb from the Bi, Pb(2223) or a low temperature decomposition of the phase.
(iii) Silver lowers the thermal decomposition tem-perature for a given oxygen pressure by at least 10 K.
(iv) The variation of the critical temperature of the Bi, Pb(2223) phase is very small. A maximum value of 111 K, and a minimum value of 107.5 K was found (60 h heat treatment). The variation of cation stoichiom-etry (varying with second phase content) is deduced to play a major role in determining Tc.
(v) Different starting cation composition may result in different phase coexistence regions.
ACKNOWLEDGMENT
We acknowledge financial support from the Swiss National Fonds (NFP30).
REFERENCES
1. U. Endo, S. Koyama, and T. Kawai, Jpn. J. Appl. Phys. 27, L1476 (1988).
2. L. M. Rubin, T. P. Orlando, J. B. Vander Sande, G. Gorman, R. Savoy, R. Swope, and R. Beyers, Appl. Phys. Lett. 61, 1977 (1992).
3. L. M. Rubin, T. P. Orlando, J. B. Vander Sande, G. Gorman, R. Savoy, R. Swope, and R. Beyers, Physica C 217, 227 (1993). 4. W. Zhu and P. S. Nicholson, Appl. Phys. Lett. 61, 717 (1992). 5. Y. L. Chen and R. Stevens, J. Am. Ceram. Soc. 75, 1142 (1992). 6. J. MacManus-Driscoll, J. Bravman, R. J. Savoy, G. Gorman, and
R. B. Beyers, J. Am. Ceram. Soc. 77, 2305 (1994).
7. Y. Kusano, T. Nanba, J. Takada, T. Egi, Y. Ikeda, and M. Takano, Physica C 219, 366 (1994).
8. Y. Takeda, R. Kanno, F. Tanigawa, O. Yamamoto, Y. Ikeda, and M. Takanoo, Physica C 159, 789 (1989).
9. G. Triscone, J-Y. Genoud, T. Graf, A. Junod, and J. Muller, Physica C 176, 247 (1991).
10. K. Fisher, A. Rojek, S. Thierfeldt, H. Lippert, and R. R. Arons, Physica C 160, 466 (1989).
11. J. Wang, M. Wakata, T. Kaneko, S. Takano, and H. Yamauchi, Physica C 208, 323 (1993).
12. Y. Yamada, M. Satou, S. Murase, T. Kitamura, and Y. Kamisada,
Fifth Int. Symp. on Superconductivity, Kobe, Japan (1992).
13. G. Grasso, A. Perin, B. Hensel, and R. Fl¨ukiger, Physica C 217, 335 (1993).
14. M. D¨aumling, A. Jeremie, and R. Fl¨ukiger, Supercond. Sci. Technol. 6, 721 (1993).
15. R. Maad, Diploma thesis, University of Geneva (1994). 16. J-C. Grivel and R. Fl¨ukiger, Physica C 235 – 240, 505 (1994).