Thermal properties study of silicon nanostructures by photoacoustic techniques
Texte intégral
Figure
Documents relatifs
the vaporization zone which is lower in our experiments. With some modifications of the small.. 4 Raman spectra: a) porous silicon obtained by vaporization with solar furnace;
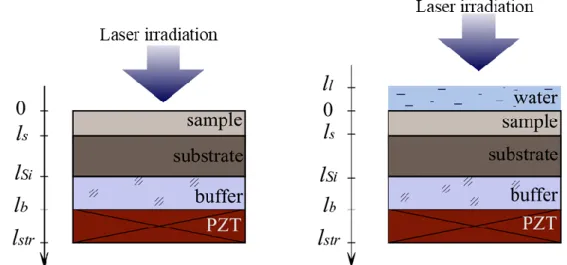
lation ,of gas volume. Idhen a chopped light is irradiated on the specimen, the temperatures of the specimen and also of the ambient gas change periodically with the
138 Figure 5.8: Normalized emission intensity for single hole MDR with 150 µm cavity hole diameter in (a) positive and (b) in negative half cycles for 650 Vpp
For the enriched sample, the specific value of the thermal conductivity at the peak is different, however the thermal conductivity obtained from theory between 3 K and 10 K and
In our study we have developed a calculation model based on the combination of effective media approximations and transfer matrix method, which could precisely predict the
Figure 10: Surface temperature changes for W/macro-Si (sample 3) for a laser uence of 50 mJ · cm −2 Figure 11: Variation of surface temperature of Ti/meso-Si (sample 4) after a
Cross-sectional SEM image of "white" silicon film (lateral view) (a), histogram of pixel intensities of the image (b), three-dimensional Fourier spectrum (c), projection of
In this chapter, the basic principles and considerations regarding thermoelectrics were discussed. Each thermoelectric effect was presented, while the possible
