Cooling Towers among Ivory Towers: A Comparative Analysis of Research
Universities, Electricity Consumption, and Greenhouse Gas Emissions
by
Brian C. Keegan
SUBMITTED TO THE DEPARTMENT OF MECHANICAL ENGINEERING IN PARTIAL FULFULLMENT OF THE REQUIREMENTS FOR THE DEGREE OF
BACHELOR OF SCIENCE AT THE
MASSACHUSTS INS E
MASSACHUSETTS INSTITUTE OF TECHNOLOGY OF TECHNOLOGY
AUG 0 2 2006
JUNE 2006 C2006 Brian Keegan.
The author hereby grants to MIT permission to reproduce and to distribute publicly paper and electronic copies of this thesis document in whole
or in part in any medium now known or hereafter created.
Signature of Author:
'4
IX
N
Certified by:
Department of Mechanical Engineering
May 17, 2006
,r ex
\
\j
II
1W Timothy G. GutowskiProfessor of Mechanical Engineering Thesis Supervisor
Accepted by:
>
John H. Lienhard V
Professor of Mechanical Engineering Chairman, Undergraduate Thesis Committee 1 ARCHIVES ( _ __ _· - -- --Ir (. P. /I .-IN /,\
Cooling Towers among Ivory Towers: A Comparative Analysis of Research
Universities, Electricity Consumption, and Greenhouse Gas Emissions
by
Brian C. Keegan
Submitted to the Department of Mechanical Engineering on May 17, 2006 in partial fulfillment of the requirements for the degree of
Bachelor of Science at the Massachusetts Institute of Technology
Abstract
The rationale for university sustainability and existing international agreements on sustainability in higher education are reviewed in the context of developing a model to determine the linkages between three environmental impacts. It is proposed that larger university facilities draw more
electricity which in turn cause increased greenhouse gas emissions. Using published
environmental performance reports and sustainability audits from private and public research universities, facility size, electricity consumption, and greenhouse gas emissions are shown to
exhibit strong correlations among each other even when normalized by student body, research population, or facility area. Preliminary analysis of secondary variables measuring financial resources and level of prestige display significant correlations suggest endogenous economic and social factors that contribute to micro-model of university greenhouse gas emissions.
Thesis Supervisor: Timothy G. Gutowski Title: Professor of Mechanical Engineering
Table of Contents
Abstract
...
3
Table of Contents ... 4
Introduction ... 6
Background ... 7
Rationale for University Sustainability ...7
Persistence
...
8
Civic Mission ... ... ....8
Economic Role ... 9
Organizational capacity... 10
Prestige
...
11
Definitions & Scope ... 12
Declarations & Consensus ... ... 12
Scope ... 13
Methods ... 15
Environmental Indicators ... 17
Facility Area ... 18
Electric Power Consumption ... 18
Greenhouse (GHG) Emissions ... 19
Financial Resources Variables ... 19
Endowment ... 19... 19
Total research expenditures ... 19
Tuition revenue ... 20
Prestige Variables ... 20
2006 US News & World Report Rank ... 20
Acceptance rate ... 20
National Academy Members ... 21
Normalizations and Controls ... ... ... 21
University Type ... 21
Total students ... 21
Total facility area ... 22
Causal Modelfor University Greenhouse Gas Emissions ... 22
A ssum ptions ... 22
Procedures & Template ... 23
Results & Discussion ... 24
C onclusions... 29
Appendix A: Figures ... 31
Appendix B: Declarations ... ... 39
The Talloires Declarations ... 39
The Halifax Declaration ... 41
Kyoto Declaration on Sustainable Development . ... ... 42
Appendix C: Statistical Analysis Using STATA ... 44
Stata Variables & Data ... 44
Population Variables ... 44
Environm ental Impact Variables ... 44
Financial Resources Variables ... 44
Prestige Variables ... 45
Norm alized Variables ... ... 45
Stata Do-File Generating Charts ... 45
Biographical Note ... 47
Acknowledgm ents ... 47
Introduction
Research universities have emerged in recent years at the forefront of a concerted effort to
improve environmental performance by measuring and auditing their impact on the environment. Given their unique role as a social institution, universities must take the lead and set an example of how to adopt and implement sustainable practices by diminishing their environmental impacts without adversely affecting their important social missions of education and research.
This paper initially explores the background developing a rationale for university sustainability and relevant definitions and preexisting frames to inform this rationale. This background is followed by a causal model of nested environmental impacts among facility size, electricity consumption, and greenhouse gas emissions. The significance of these linkages is important as universities must begin to understand and address their role in contributing to large-scale
phenomena like depletion of nonrenewable resources and global warming. This is followed by a description of the experimental design, the significance of chosen indicators, and governing
assumptions employed in the analysis.
While this study employs causal models to explain the linkages between facility size, electricity consumption, and greenhouse gas emissions, these variables do not exist in a vacuum. The
second half of the analysis explores the contributions of endogenous factors like financial resources and prestige to each of these variables. The results from this comparison may suggest that the "greening" of universities are not entirely egalitarian, but rather more strongly motivated by pressure from economic and social forces.
Background
Sustainability as a concept is fraught with uncertainty because it is defined by and applied to a multitude of disciplines. Its broadest definition involves the overlapping roles of the
environment, the economy, society, and institutions' in "[meeting] the needs of the present without compromising the ability of future generations to meet their own needs."2 The rationale
for sustainability in higher education stems from a confluence of factors, but these alone are not enough to describe why universities do or do not engage in sustainable behavior. Colleges, universities, and other institutions of higher education are unique, however, in that they have
distinguished themselves at a comparatively early stage by committing themselves to supporting sustainable practices on their campuses. One author suggests that "Since universities are
generally long-lived institutions, they should be concerned with the long-term health and livability of their community and region."3
Rationale for University Sustainability
Large research universities are, in many respects, the ideal actors to implement sustainable practices. They are (1) highly persistent and stable organizations, (2) occupy hybrid role between the benefits and liabilities inherent in either purely private or public institutions, (3) have
substantial organizational and technical competence to redress their impacts, and (4) are motivated by a defined social or civic mission. Other institutions of higher learning such as the liberal arts college (generally defined as not granting graduate degrees such as Masters or PhDs) may fulfill these characteristics in varying degrees, but their emphasis is generally on education rather than research and knowledge generation.
Persistence
Research universities are highly persistent institutions; the English universities at Cambridge and Oxford have existed since the 13th century, their American counterparts at Harvard and Yale since the 17thcentury. Although originally conceived of as what would now be called a liberal arts college, these academic institutions expanded their domain to include advanced degrees for graduate study, a faculty whose responsibilities are split between teaching and research, and extensive and specialized research laboratories and programs. Research universities are
capital-1 Choucri, Nazli. North, Robert C. "Growth, Development, and Environmental Sustainability: Profiles and Paradox." GlobalAccord. (1995)
2 1987 Brundtland Report. <http://www.are.admin.ch/are/en/nachhaltig/inteationaluno/unterseiteO2330/>
3 Creighton, Sarah Hammond. Greening the Ivory Tower. (1998) p.6
intensive entities requiring large lecture halls, expensive research laboratories, housing complexes for students, and offices for faculty. Their perception as highly stable institutions attracts both government and private philanthropic investments which feed back into the university's capital stock and ensures their continued stability. However, this intergenerational stability requires an institutional culture of substantial restraint and discourages entrepreneurial risk-taking. This restraint often leads universities to be disparagingly labeled as being "ivory towers" filled with academic elitists removed from contemporary problems. This perception stands in strong contrast to their original mission as being civic institutions emphasizing education, research, and service.4
Civic Mission
Universities mission statements have similar themes of providing quality education, ensuring academic freedom and integrity, as well as implicit or explicit references to a larger social or civic mission.
· MIT: "to advance knowledge and educate students in science, technology, and other areas of scholarship that will best serve the nation and the world."5
· The University of North Carolina: "to serve all the people of the State, and indeed the nation, as a center for scholarship and creative endeavor."6
* The University of Tennessee: "to improving the quality of life, increasing agricultural productivity, protecting the environment, promoting the well-being of families, and conserving natural resources" and "to partner with communities to provide educational, technical and cultural support to increase the livability of those communities."7
* Duke University: "to help those who suffer, cure disease, and promote health...; to provide wide ranging educational opportunities, on and beyond our campuses,...; and to promote a deep appreciation for the range of human difference and potential, a sense of the obligations and rewards of citizenship, and a commitment to learning, freedom and
4 Checkoway, Barry. "Renewing the Civic Mission of the American Research University." The Journal of Higher Education. Vol. 72, No.2 (March 2001). p.127
5 "Mission and Origins." MIT. <http://web.mit.edu/facts/mission.shtml>
6 "University Mission." University of North Carolina. <http://www.unc.edu/about/mission.html> 7 "Vision and Mission Statements." The University of Tennessee. <http://www.utk.edu/mission/>
truth."8
Due in part to this larger social mission, universities have also historically been a locus for social
change or reform. Student and faculty protests in the 1960s and 1970s on many college campuses raised awareness of gender and racial inequality, environmental degradation, and anti-war
protests. In response, universities have often been trend setters in addressing contentious social issues because they are institutions that promote and support problem solving through knowledge generation.
Economic Role
Universities likewise fulfill a unique economic role as both public and private entities. Research universities can broadly be categorized into two types as a function of their primary source of operation funding: public universities rely upon government (state) allotments while private universities carry substantial endowments and rely to a greater degree on tuition to cover expenses. Research universities are supported to a large extent by government research grants, scholarships, or tax considerations. Owing to this established stability and social mission, both public and private universities have well-established constituencies (alumni and trustees) or lobbies that are generally able to resist the drastic changes in political support. This political legitimacy is in no small derived from the substantial economic benefits conferred by a research university's student body, faculty activities, and research on the local economy as a major
employer and consumer of local goods and services. However, this economic activity is likewise a significant locus for environmental impacts. Because research universities fulfill different roles for different constituencies (students, faculty, staff, administration), core activities such as supporting research, housing, dining, transportations, grounds, electricity generation, and waste management each fall under different regulatory regimes at the federal, state, and municipal
levels.9
8 "The Mission of Duke University." Duke University. <http://www.planning.duke.edu/mission.html> 9 Environmental Virtual Campus. <http://www.c2e2.org/evc/home.html>
Organizational capacity
A research university, like any social organization, has a heterogeneous constituency of actors and interests. The research university itself is generally an incorporated legal entity that serves three broad missions: educating and granting degrees to post-secondary school students,
supporting a faculty who teach and research, and fulfilling a larger civic or social responsibility. American research universities are like corporations in that they possesses a governing body such as a Corporation or Board of Trustees that chooses and delegates authority to administrators to manage the university's affairs. Unlike businesses, universities have highly diffuse power structures spread amongst the central administration (Board, President, Provost, Chancellor), faculty, student constituencies, and philanthropic/government foundations or other financially-vested third-parties.
However, senior positions within a university (president, provost, dean, department chair) are largely symbolic and not authoritatively dominant as they are in corporations or some
governments. They must use gestures like policy statements to win over well-entrenched constituencies like the tenured faculty without exerting direct control.'0A research university's
administration also includes other functions like research administration or facilities maintenance whose responsibilities and scope are relatively constant and are characterized by low levels of accountability given the diffuse power structure.l Velazquez et al (2005) describe how
institutional factors and values develop friction and conflict with the principles of sustainability contribute to deterring sustainability in higher education12. These factors include a lack of
awareness, interest, and involvement; a non-functionally-integrative structure; a deficiency of funding, time, training, data access, communication; resistance to change, more rigorous regulations, or interdisciplinary research; insufficient standard definitions, policies, and indicators; and profit-minded mentality all deter sustainability in higher education. However "budgetary constraints" consistently emerges as the leading barrier to any sustainability
10 Shriberg, Michael P. Sustainability in US Higher Education: Organizational Factors Influencing Campus
Environmental Performance and Leadership. (2002) p.2 6
11 Shriberg 27
12 Velazquez, L. Munguia, N. Sanchez, M. "Deterring sustainability in higher education institutions."
International Journal of Sustainability in Higher Education. (2005).
framework. 13
Despite these organizational challenges, universities nevertheless retain an enviable pool of interdisciplinary talent in its faculty and students. Most research universities have programs, students, and faculty in technical fields of science and engineering as well as more qualitative fields in the social sciences and economics from which they can draw experts in the sundry domains that comprise sustainability. Moreover, while the power within the university may not be concentrated in any one office, these constituencies can collaborate on problems and
contribute to a shared solution. While command and control policies may be ineffective in
altering unsustainable practices, cases of universities taking the lead to address large social issues (described in Civic Mission above) demonstrate the ability for these various stakeholders to act collectively. If the significance of the problems facing a university can be properly constructed and framed, a university's students, faculty, and administration may focus their shared powers towards promoting sustainability.
Prestige
The activities of research universities are not entirely egalitarian. Universities compete over limited pools of talented potential faculty and qualified students to attract them to their
institutions. Government grants and philanthropic donations are highly valuable to a university's three missions, thus highly competitive.14 The scale of a university's impact may also be
disruptive to the surrounding non-affiliated population (town-gown relations) which can create social and political tensions.'5A university's prestige, or perceived importance, is essential to
promoting its mission in each of these domains. Some universities are well-recognized by the success of the alumni, others by the awards won by faculty, and others by their practical
contributions, but these variables alone do not determine prestige. An institution's age, selectivity in admissions, student body, faculty backgrounds and scholarship also contribute to prestige.
13 Shriberg 70
14 Leslie, Larry L., Ronald L. Oaxaca and Gary Rhoades. Effects of Changing Revenue Patterns on Public
Research Universities. A Report to the National Science Foundation, Grant Number 9628325. The University of
Arizona, October 1999.
However, a hyper-emphasis on selectivity, specific types of scholars and scholarship, and promotion of certain values can pass a threshold where a university is derogatorily regarded as elite. These perceptions are completely socially constructed and are not always good predictors of the quality of an institution's education or scholarship.16
Definitions & Scope
Sustainability is a concept that is broadly supported and poorly understood. Most definitions have been criticized as suffering from substantial ambiguity and imprecision as to what
constitutes sustainability among ecology, economics, and social factors so that sustainability as a concept has become a "moving target." At least thirteen international declarations govern the issue of sustainability in higher education alone.'7Wright (2002) describes common themes in both international declarations and policies of universities as centering on sustainable physical operations, sustainability-related research, public outreach, inter-university cooperation, partnerships with government, NGOs, and industry, ecological literacy, interdisciplinary curricula, and moral obligations.
Declarations & Consensus
The 1990 Talloires Declaration is perhaps the most well-known pronouncement committing universities to "creating an equitable and sustainable future for all humankind in harmony with nature."'1'19 The signatories to this declaration pledged themselves to 10 actions:
[increasing] awareness of environmentally sustainable development; [creating] an institutional culture of sustainability; [educating] for environmentally responsible citizenship;[fostering] environmental literacy for all; [practicing] institutional ecology; [involving] all stake holders; [collaborating] for interdisciplinary approaches; [enhancing]
16 Lombardi, J. et al. "The Myth of Number One: Indicators of Research University Performance." TheCenter. <http ://thecenter.ufl.edu/MythNumberOne.pdf>
17 1972 Stockholm Declaration, 1990 Talloires Declaration, 1991 Halifax Declaration, 1992 Rio Declaration, 1992 Agenda 21, 1993 Swansea Declaration, 1994 CRE-Copernicus Charter, 1994 Barbados Declaration, 1997 Earth Charter Benchmark Draft, 1997 Thessaloniki Declaration, 2000 Earth Charter, 2001 GHESP Luneburg
Declaration, 2002 Ubuntu Declaration
18 "Talloires Declaration." University Leaders for a Sustainable Future. (1990) <http://www.ulsf.org/programs_talloires.html>
capacity of primary and secondary schools; [broadening] service and outreach nationally and internationally; and [maintaining]the movement
Because the declaration was borne out of a recognition that "universities educate the people who develop and manage society's institutions "this declaration emphasizes a university's obvious strength - educating students to assume responsibilities in the world at large - as a means of addressing its responsibilities. However, this declaration proscribes no means of making
university as an entity more sustainable beyond Action 5 "Practice Institutional Ecology" defined as "Set an example of environmental responsibility by establishing institutional ecology policies and practices of resource conservation, recycling, waste reduction, and environmentally sound operations.'20
The 1991 Halifax Declaration followed the Talloires declaration by appealing to universities' social responsibility to "help societies shape their present and future development policies and actions into the sustainable and equitable forms necessary for an environmentally secure and civilized world."21'2 2The 1993 Kyoto Declaration on Sustainable Development achieves
significantly more clarity in both admitting the lack of a "clear understanding of sustainability."2 3
The Kyoto Declaration invokes a university's ethical obligation to "over those practices of resource utilization and those widespread disparities which lie at the root of environmental unsustainability. More significantly, the declaration directs universities to review their operations
to reflect best practices.2 4
Scope
Most of the literature on campus sustainability argues that conducting a survey or audit of a university's impact. Shriberg suggests that this audit should cast a wide net to include mission statements, sustainability education, endowment spending, and other measures that extend
20 ibid
21 "Halifax Declaration." (1992) <http://www.iisd.org/educate/declarat/halifax.htm> 22 See Appendix B: Declarations
23 See Appendix B: Declarations
beyond traditional environmental audits.2 Shriberg's survey of best practices concludes that cross-institutional sustainability assessment tools should be constructed to include: identification of important issues, calculable and comparable metrics, move from eco-efficiency to
sustainability, measure processes and motivations, and stress comprehensibility.26
Although this paper concerns itself with greenhouse gas emissions, the difficulties in systematic auditing extend to other types of environmental impacts. Some environmental audits are more explicit than others describing the sources or methods by which the data are obtained. Although substantial uncertainty exists about the scope of modeling the university within a larger social-economic-ecological-institutional system, a more immediate problem exists whereby there are no common standards or definitions for conducting an audit or defining the scope or extent of the system. Some greenhouse gas inventories only account for stationary point source emissions, such as those by power plants.27Even this simple audit must control for the different emission
intensities caused by various fuel types (natural gas, coal, oil), efficiency of the generation process (cogeneration vs. conventional electricity generation), and losses that occur in
distribution over the grid. Others transform financial expenditures on energy into greenhouse gas emissions by way of abstracted conversion constants.2 8 Some audits include contributions of
campus vehicle fleet based on miles driven as well as commuting to campus.29Others extend the model so far as to account for the emissions produced by generating food and paper or disposing of solid waste.3 0Defining and constraining the system boundaries of an organization as complex as a research university remains a substantial hurdle in comparing emission levels. Several sustainability/environmental reports cited in this paper did not explicitly state the extend and methodology for determining C02 emissions despite publishing "campus-wide" data.
25 Shriberg 63
26 Shriberg 73-75
27 FY03 University Energy Consumption Data. Carnegie Mellon Green Practices. <http://www.cmu.edu/greenpractices/facts_figures/energy_consumption.htm>
28 Gloria, Thomas. Tufts University's Greenhouse Gas Emissions Inventory for 1990 and 1998 (January 2001).
<http://www.tufts.edu/tie/tci/pdf/Tufts%20Emissions%20inventory.pdf>. p.5
29 Sustainability Assessment and Reporting for the University of Michigan's Ann Arbor Campus (2002) 30 Groode, Tiffany. Heywood, John B. A Methodology for Assessing MIT's Energy Use and Greenhouse Gas
Emissions. <http://lfee.mit.edu/public/LFEE 2004-002 RP.pdf> May 2004. 13
Several standards exist today for defining and measuring environmental impacts for private companies, government agencies, academic institutions, and other organizations. ISO 14000 is a collection of generic environmental management standards structured to setting environmental
objectives to reduce environmental impact, monitoring and assessment methods, and methods for continued reductions and improvements.31 The Global Reporting Initiative is an official
collaborating center of the UN Environment Program (UNEP) developing Sustainability Reporting Guidelines that integrate definitions, sector-specific supplements, and technical protocols as inputs into a final, public sustainability report.3 2Other organizations like the
Leadership in Energy and Environmental Design grant recognition to buildings that reduce their impact through greater water efficiency, decreased energy & material consumption, and indoor environmental quality.33 These standards attempt to measure vastly different institutional,
ecological, and social characteristics and are generally tailored to businesses and governments rather than research universities. A cursory review of the university sustainability/environmental reports suggests that universities develop their own native sets of methodologies and boundaries rather than employing these international standards.
Methods
Eighteen research universities were included in this study based upon (1) the availability of data on their environmental impacts, (2) the reliability or legitimacy of the sources, (3) public or private status, (4) relevancy, and (5) size as measured by both total enrolled students and research expenditures. Most of the data was collected from environmental performance audits published by the universities in the last five years:
* UNC Chapel Hill: Campus Sustainability Report 2003
· Sustainability Assessment and Reporting for the University of Michigan's Ann Arbor Campus (2002)
· University of Florida Report to President & Faculty Senate by Committee on
31 ISO 14000. <http://www.iso.org/iso/en/iso9000-14000/understand/basics/basics 14000basicsl4asics 14000_3.html>
32 GSI Reporting Framework. <http://www.globalreporting.org/guidelines/framework.asp> 33 LEED: Leadership in Energy and Environmental Design. <http://www.usgbc.org/LEED/>
Sustainability
* Pennsylvania State Indicators Report 2000: Steps Toward a Sustainable University * UC Berkeley Campus Sustainability Assessment 2005
* Environmental Indicators for Carnegie Mellon University: Baseline Assessment 2004 * University of Washington Facilities Services: Focus on Environmental Sustainability * University of Tennessee 2005 Environmental Progress Report
The data set in this study was not constrained by a limited by an avoidance of neglect of a university's impact as almost every preliminary university had information on campus policies, commitments, and programs. Rather, these websites and brochures lacked any quantifiable measurements of the extent and type of impacts. Although many universities in espouse a commitment to broad themes of environmental stewardship and responsibility in their
publications and policies, little quantitative and qualitative information is provided to back these claims. The schools publishing these reports are at the forefront of a growing trend to
systematically examine and quantify their environmental impacts and disseminate this information over the internet. However, many environmental websites are either perpetually under construction, have broken links, or have not been updated in years at many universities. The author attempted to contact offices of Environmental, Health, and Safety, Environmental Programs, and Facilities/Maintenance at the 25 largest American research universities (as measured by research expenditures) and received only 8 responses in five weeks. However, correspondence and feedback from this limited group provided a wealth of relevant and authoritative data on emissions that was not publicly available in web pages or literature.34
There are a total of 18 institutions represented in the data. The seven private research universities are Yale University (New Haven, Connecticut), Massachusetts Institute of Technology
34 Emily C. Smith, EMS Program Coordinator, Duke University. Ramsay Huntley, Climate Entrepreneurship Specialist, Tufts University. Ed Becker, Executive Director Environmental Health & Safety, University of Southern California.
(Cambridge, Massachusetts), Harvard University (Cambridge, Massachusetts), Tufts University (Medford/Somerville, Massachusetts), Cornell University (Ithaca, New York), Carnegie Mellon University (Pittsburgh, Pennsylvania), and the University of Southern California (Los Angeles, California). The eleven public research universities are the University of North Carolina at Chapel Hill, Pennsylvania State University at University Park, University of California at Berkeley, University of Michigan at Ann Arbor, University of Florida at Gainesville, Michigan State University at East Lansing, University of Illinois at Urbana-Champaign, University of Washington at Seattle, University of Texas at Austin, University of Oregon at Eugene, and University of Tennessee at Knoxville.
The data compromising the financial resources, Academy membership, and student bodies is derived from the Lombardi Program on Measuring University Performance "TheCenter" at the University of Florida. The 2006 U.S. News and World Report was used for its rankings of undergraduate programs and acceptance rate. Some institutions did not report data used in this analysis, their contribution is dropped.
Environmental Indicators
This study employs six environmental indicators to measure the extent and magnitude of a research universities impact. This data is not available for every university, nor do they represent the same "snapshot" in time as reports were published between 2000 and 2005. However, they are chosen to represent environmental impacts that extend beyond any one type of activity. The discussion below attempts to extract a general meaning encompassing the definition of the indicator, its significant, its scope, the actors contributing to it, and areas of uncertainty.
Facility Area
The total area of the campus buildings is measured in square feet. Campuses occupying more land necessarily destroy natural habitants and ecosystems. A developed university campus has numerous structures whose size alone changes runoff patterns causing erosion, increasing the risk of flooding, lowering water tables, and introducing artificial chemicals into the
environment.3 5 Implicit in this measure is that the square footage of a university reflects its actual physical footprint. An artifact arising from this assumption is that campuses with substantial square-footage may be measuring high-density (high-rise) facilities that have a smaller surface coverage than lower-density facilities. Some indicators measure "impervious surface coverage" such as rooftops, sidewalks, pavement, and some soil types which may be a more effective measure of environmental impact.
Electric Power Consumption
Total annual electricity consumed by campus facilities such as labs, classrooms, and housing is measured in megawatt-hours. Electricity generation is one of the primary contributors to greenhouse gas emission.3 6 This is by no means a measure of total energy consumption, as heating energy also contributes significantly to total energy consumption separate from electrical
consumption.3 7Many universities have their own co-generation plants that generate electricity by burning natural gas, coal, or oil and distributing waste steam for heating and cooling. Differences
in load are either bought or sold to the local power grid. Electricity consumption is generally extractable from budget items and is thus readily available for almost every institute. However, as with other indicators defining or constraining the extent of the system is difficult as there are third-party contractors and businesses who can contribute significantly to university operations but whose impact is not fully accounted.
Greenhouse (GHG) Emissions
Total annual emission of carbon dioxide (CO2) and other greenhouse gases is measured in short tons. This data is increasingly available as more educational, corporate, and governmental actors undertake greenhouse gas inventories to evaluate their impact in the context of climate change.38
35 Arnold Jr., Chester L. Impervious Surface Coverage. Journal of the American Planning Association. March 1,
1996. Vol 62, Issue 2.
36 "Table 1L US Greenhouse Gas Emissions Allocated to Economic Sectors." Greenhouse Gas Emissions and Sink: 1990-2000. Annex to the 1990-2000 US Inventory. April 2002.
<http://yosemite.epa.gov/oar/globalwarming.nsf/UniqueKeyLookup/SHSU5BVQEA/$File/sector-emissions_90-00O.pdf>
37 Table C1. Total Energy Consumption by Major Fuel. 1999 Commercial Buildings Energy Consumption Survey: Consumption and Expenditures Tables. 1999. <http://www.eia.doe.gov/emeu/cbecs/pdf/c .pdf>
38 "Drivers". Sustainability in US Higher Education - Organization Factors Influencing Campus Environmental 17
As every inventory measures different phenomena and systems, some accounts may be far more exhaustive of total impact (including transportation and miscellaneous contributions) than others (conversions from total energy consumption).
Financial Resources Variables
Four variables measuring the extent and magnitude of a universities economic or financial status are used to test the relationship with environmental impact.
Endowment
This is the market value of a university's total net endowed assets derived from the National Association of College and University Business Officers Endowment Study. These data, while independently audited, are difficult to distill for public universities with multiple campuses. Similarly, some universities report gross (before deductions) assets rather than net (after deductions) assets. Likewise, this is not the sum of a university's total investments as these include programs like employee/faculty pensions which are not disbursed for educational or research purposes. Nevertheless, institutions with larger endowments have correspondingly
larger budgets to finance research and educational projects which in turn attracts students and
faculty.
Total research expenditures
Total research expenditures are a measure of government or foundation organized/sponsored research as well as university research while excluding Federally Funded Research Laboratories (i.e., Jet Propulsion Laboratory, Los Alamos, Lawrence Livermore, Lincoln Laboratory),
teaching and instruction funding, or service projects.39Differences in accounting standards, institutional policies, and definitions of university boundaries may result in disparate totals, but these are believed to be orders of magnitude smaller than the total expenditures.
Performance and Leadership. p.60 <
Prestige Variables
Marginal changes in these variables should not alter university sustainability as they are subjective abstractions rather than a direct measure of a university's activities.
2006 US News & World Report Rank
This is a highly controversial indicator within academic administrations, but its influence has permeated a generation of college students. It attempts to measure a combination of aggrandized perceptions, student accomplishment, and university resources to derive a normative
representation of educational quality. These factors and the methodological weights attached to them are vary from year to year, but the relative rankings between universities is generally
stable.
National Academy Members
Membership in one of the three United States National Academies (National Academy of Sciences, the National Academy of Engineering, the Institute of Medicine) is one of the highest honors that can be awarded to faculty members40. There are approximately 2,000 current life members in each of the academies. Universities with a large number of academy members would likely have substantial means of supporting and retaining this type of talent that would attract other students and researchers to work there as well.
Normalizations and Controls
Because looking at the data in the abstract obscures factors of scale that substantially contribute to environmental degradation, the data is normalized on four bases to provide per-capita
assessments of effectiveness.
University Type
The most obvious identifier among research universities is the primary source of their funding.
40 The National Research Council is also a US Academy, but it does not grant membership. 19
Private universities derive the majority of their operational budget from tuition revenue or endowment returns while public universities receive funding from their individual state
legislatures. The effect is that private universities charge substantially higher tuitions than public universities, but public universities are beholden to political forces and rules that determine how their funds are allocated.
Total students
Total students is the the total full-time headcount of the student body including undergraduate, graduate (masters and PhD), and professional (JD, MD, DDS, etc) students. Students are given equal weight although they certainly have highly divergent impacts (undergraduate emphasis on housing vs. graduate emphasis on research). Part-time students are not included either, but these
are generally a small portion of the total student body.
Total facility area
Total facility area is a control for an institution's physical size. Larger institutions inevitably have a far larger impact owing to the magnitude of their operations than smaller-sized institutions, but this does not reveal how efficient or effective these institutions on a per-capita basis.
Causal Model for University Greenhouse Gas Emissions
Research universities have many environmental impacts owing to their multifaceted mission, but most obviously a they have a physical presence which displaces existing natural ecologies and prevents other possible uses of the land. Universities provide many different services tied to physical locations: laboratories for research, classrooms for teaching, office space for faculty, student housing, dining facilities, and athletic complexes. This study proposes that the physical size of a university is the strongest determinant of its greenhouse gas emissions. Large
universities necessarily consume more energy because they have more demands for heating, cooling, and operation of office and lab equipment. In more concrete terms, this study proposes that increasing facility size causes increased electricity consumption which in turn causes increased greenhouse gas emissions. This study does not attempt to revisit models of emissions
factors for electricity generation and greenhouse gas emissions as these are already
well-modeled41 but rather seeks to demonstrate that a focus on shifting energy generation or reducing consumption alone ignores the dominant role of university size in determining greenhouse gas
emissions.
Assumptions
Several assumptions are built into the selection of data, methods, and analysis.
* Research universities selected all reside within the United States. International research universities have published relevant data on environmental impacts, but including this data would admit a host of extraneous variables like differences in regulation, funding, social perceptions.
* The data represents a single, integrated campus assessment representing a coherent time-frame, rather than overlapping campus boundaries and differential time-scales. Public universities often have a central campus and several satellite campuses throughout the state while private universities often have research labs and affiliated programs off campus. These are assumed to be properly and consistently accounted for, but failing that, orders of magnitude smaller than the audited values.
* Universities used comparable standards and definitions for point sources, units conversions, and system boundaries. The indicators were not arbitrarily weighted, discounted, or otherwise revised from raw data.
* Values in each report are assumed to be comparable to other universities and indicators in other years. The indicators on environmental indicators were gleaned from reports
published over a 5-year period as assessments or audits often require significant lead time and not all impacts are available on a time-series basis. Marginal variability is expected between years, but the data represents a snap-shot of impacts during the 5 year period. * Relationships between variables are assumed to be linear. Studies in system dynamics reveal higher-order output behavior depending upon initial conditions, feedback, and
41 EPA Clearinghouse for Inventories and Emissions Factors. <http://www.epa.gov/ttn/chief/ap42/index.html> 21
other interactions, but modeling the university system is highly complex and beyond the scope of this paper.
Procedures & Template
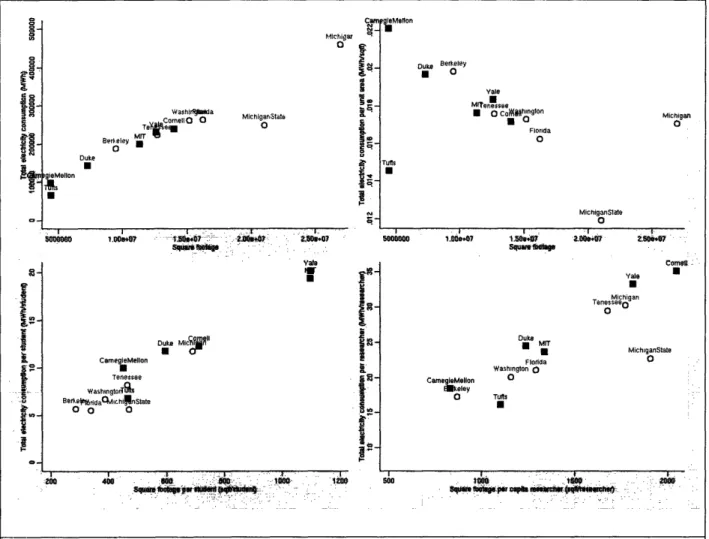
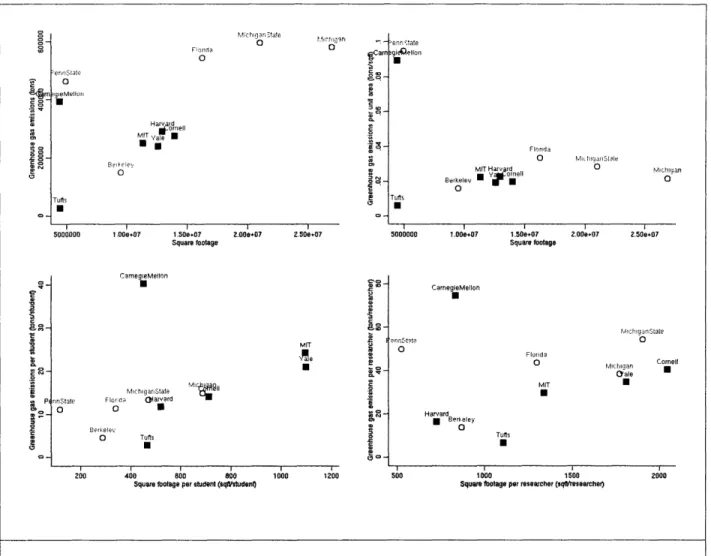
The resulting scatter-plots follow one of two templates for representing the relationships between variables. The first template has four charts per page and each chart is measuring the same relationship between variables with different normalizations. These charts plot electricity consumption as a function of square footage (Figure 1), greenhouse gas emissions as a function of electricity consumption (Figure 2), and greenhouse gas emissions as a function of square footage (Figure 3). The left quadrant shows the both variables in the aggregate, the upper-right quadrant is normalized by square footage (except when the independent variable is square footage), the lower left quadrant is normalized by student body, and the lower right quadrant is normalized by research population.
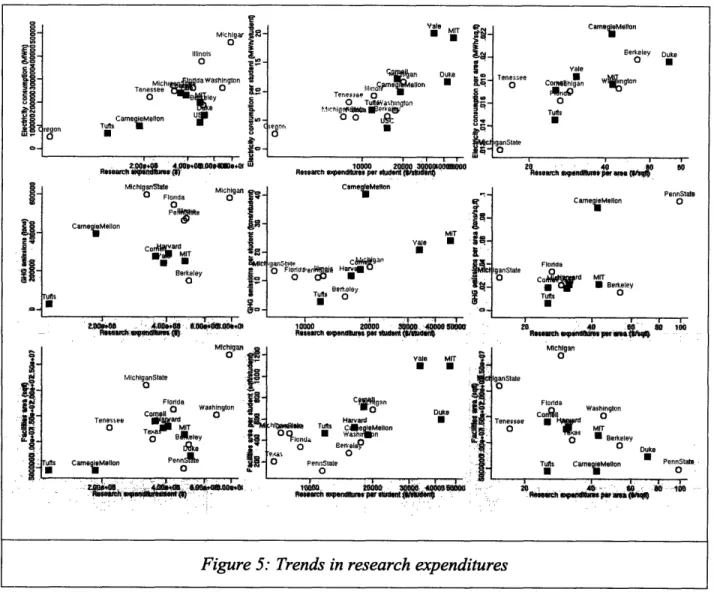
The second template has nine charts per page arranged in three rows and three columns. These charts plot electricity consumption, greenhouse gas emissions, and facilities area as dependent variables (y-axis) against four secondary independent variables (x-axis): US News Rank, National Academy membership, endowment, and research expenditures. Each page shows the same independent variable against three separate dependent variables. Each row, in turn, shows the same dependent and independent variables but with different normalizations in each column. The first chart in every row shows the aggregate data, the second chart in the row shows the data normalized by student body size, and the third chart in the row shows data normalized by facility
size.
Private universities are represented as solid red boxes and public universities are shown as hollow blue circles. The graphs are plotted on log-log basis to make the data points more legible.
Results & Discussion
The primary variables of facility area, electricity consumption, and greenhouse gas emissions all exhibited strong correlations between each other for public and private universities alike.
Normalization to account for scale effects diminished the significance of the results, but the overall trends remain clear.
Figure 1 shows the relationship between electricity consumption (MWh) and facility area (sqft). The majority of both public and private institutions fall between 100,000 and 300,000 MWh with Carnegie Mellon, Tufts, and University of Michigan falling outside this range. This could be attributed to differences in auditing methodologies, but it may stem from endogenous factors such as a greater amount of electricity-intensive facilities like computer laboratories. There is an unmistakable linear relationship between these variables for both public and private universities. The slope of the line indicates a rate of consumption of approximately 0.018 MWh/sqft, or 18 kWh/sqft. Because this data is taken in the aggregate, it does provide the resolution for electricity intensity for laboratories, offices, student housing, and classrooms. Nevertheless, 18 KWh/sqft for universities suggests that in the aggregation more intensive electricity consumers like
research laboratories and food sales are balanced out by lower intensity lodging and educational spaces as shown in Department of Energy data on building activity, which is summarized in the
table below.4 2
Education 8.7 KWh/sqft
Food sales 48.7 KWh/sqft
Lodging 12.7 KWh/sqft
Office 18.7 KWh/sqft
Table 1: Electricity Intensity by Building Activity
Normalizing per unit area reveals a strong trend of decreasing consumption intensity with increasing facility size. DoE data corroborates the result that larger facilities have lower energy
42 Electricity Consumption and Expenditure Intensities, 1999. < http://www.eia.doe.gov/emeu/cbecs/pdf/c IO.pdf> 23
consumption per unit area than small facilities.43 Student body and research population decrease
the significance of the results somewhat, but the overall increasing trend between square footage and electricity consumption remains clear. Although public universities are larger in area also support a higher density of students, substantially decreasing their per-student contribution relative to private universities.
Figure 2 shows greenhouse gas emissions as a function of electricity consumption. The relationship between these variables is still highly significant, but not nearly so much as those shown in Figure 1. Omitting Carnegie Mellon, Michigan State, and University of Florida, the slope of the line fitted to these points is approximately 1.1 tons/MWh or 2.2 lbs/KWh.
Normalizing by area and omitting Carnegie Mellon gives a constant greenhouse gas emission intensity of approximately 0.02 tons/sqft, or 40 lbs/sqft. Based on the previously established electricity intensity data of 19 KWh/sqft and the DoE National average electricity emissions factor 44of 1.64 lbs/KWh gives a predicted greenhouse gas emission intensity of 31.2 lbs/sqft. This increased intensity can be explicated as different regions have different energy generation methods and each fuel source has different emissions factors.4 5Combustion of coal and oil
produce more greenhouse gas emissions than for combustion of natural gas.4 6Exogenous factors
such as differences in emissions regulations from state to state may also explain the variation between universities
Although electricity generation is one of the primary emitters of greenhouse gases, vehicle transportation also contributes a significant amount to total emissions in addition to being more emission intensive than power generation.47 Because both power generation and, to some extent,
43 ibid
44 Global Warming Resource Center. US Environmental Protection Agency.
<http ://yosemite.epa.gov/oar/globalwarming.nsf/content/ResourceCenterToolsCalculatorAssumptions.html> 45 EPA Clearinghouse for Inventories and Emissions Factors. <http://www.epa.gov/ttn/chief/ap42/index.html> 46 "Table 1. Summary of Carbon Dioxide Emissions and Net Generation in the United States, 1998 and 1999."
Carbon Dioxide Emissions from the Generation of Electric Power in the United States. Department of Energy. July 2000.
<http://yosemite.epa.gov/oar/globalwarming.nsf/UniqueKeyLookup/SHSU5BPKWX/$File/co2emissOO.pdf> 47 "Table Al: US Number of Vehicles, Vehicle-MIles, Motor Fuel Consumption and Expenditures" Energy
Information Administration. <http://www.eia.doe.gov/emeu/rtecs/nhts_survey/2001/tablefiles/table-aO1 .pdf>
transportation emissions are included in these data it is understandable that total university greenhouse gas emissions are more intense than power generation alone. Moreover, the variability in the aggregate amount reflects the fact that Carnegie Mellon, Michigan State, and the University of Florida had a substantially larger scope in their greenhouse gas audit which causes them to perform more poorly relative to other universities, despite the fact that this performance is more indicative of their total environmental footprint.
Figure 2 also shows normalizing by student body collapses the outliers back into a very linear relationship, although Carnegie Mellon continues to remain an outlier. This demonstrates that the size of the student body is likewise a strong determinant of greenhouse gas consumption. Larger universities, although supporting higher densities, simply have more greenhouse gas-producing activities. Removing this scalar effect shows substantially better environmental performance among public universities (all five measured public universities clustered in the third quadrant) than among private universities. Normalizing by research population decreases the significance and correlation of the trend line.
Figure 3 shows greenhouse gas emissions as a function of square footage. A linear fit to the data points excluding outliers like Penn State and Carnegie Mellon has a slope of approximately 0.021 tons/sqft as was predicted above from Figure 2. Private universities like Harvard, Yale, MIT, and Cornell exhibit a tight cluster in the aggregate and per unit area normalization, but become more skewed when normalized by student body and research population. The strong linear correlation for both public and private schools is again more evident among normalization by student body rather than research population. This can be explicated by the fact that the greenhouse gas emissions is likely more contingent upon the type of research being conducted rather than the number of researchers (full-time faculty, graduate students, research staff). Private universities may well conduct more energy intensive research projects requiring a small number of staff (computer labs, electronics fabrication) than public universities having lower-intensity agricultural programs, for example. Because student bodies across universities are generally uniform their use of classrooms, offices, and lodging, removing the magnitude of a
student body shows much better correlated relationships with greenhouse gas emissions or electricity, although private universities consistently have higher per student capita intensities.
Next, secondary variables are employed to explore possible linkages between the micro-causal model of university greenhouse gas emissions and larger economic and social factors.
Endowment and research expenditures are plotted against the three impact variables to determine the extent to which financial development is related to greenhouse gas emissions. National Academy membership and U.S. News and World Report undergraduate ranking are also used to measure the perceived quality or prestige of the university and its effect on the three impacts. These graphs employ the 9 chart template of each of the three rows containing the same set of variables with different normalizations in every column.
Figure 4 shows electricity consumption, greenhouse gas emissions, and facilities area as
fiunctions of endowment. There generally is a distinct separation in the behavior between public and private schools. Both types of institutions show increasing levels of electricity consumption with increasing endowment, particularly on a per student basis. The relationship between
endowment and greenhouse gas emissions is much less significant with poorly correlated clusters of both private and public universities, although emissions intensity appears highly stable at the previously established 0.02 tons/sqft despite CMU and PennState. Facilities area exhibits a decreasing trend among public universities and an increasing trend among private universities, but when normalized by student body, there is a more compelling increasing trend for all universities.
Figure 5 shows the three environmental impacts as functions of research expenditures. Aggregate relationships exhibit generally poor correlations for private, public, and all universities.
Normalizing by student body results in more linear plots, although with poor significance among private and public institutions. Calculating the slope of the student normalized greenhouse gas emissions results in a relatively stable 0.7-0.9 lbs /$1000 for most schools.
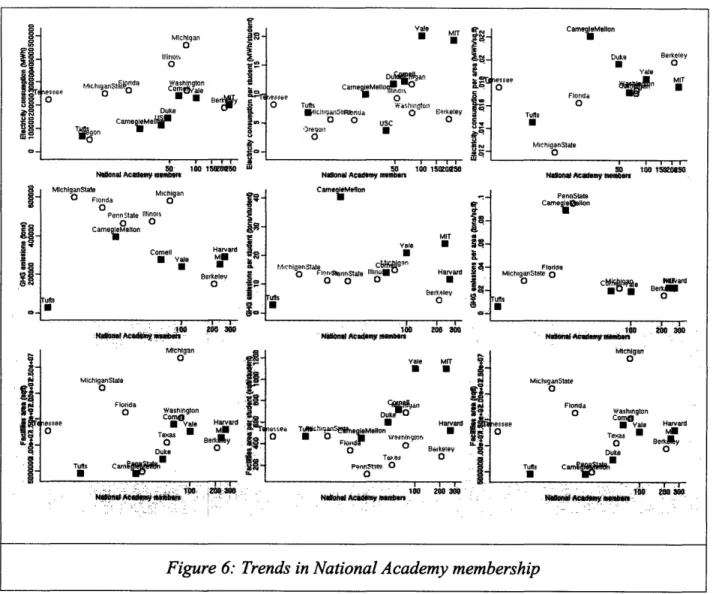
Figure 6 shows the three impacts as functions of National Academy membership. Because Academy members are distinct people rather than scalable quantities, it is meaningless to
normalize this variable by student body or unit area. Rather, Academy membership is a measure of absolute prestige and the charts explore how this perception correlates with environmental performance. Among both public and private universities, increase number of Academy members leads to increasing electricity consumption until a fall-off around 100 members. Normalizing the impact by student body and facility size does not improve the significance of
the results. Among all research universities, increasing Academy membership is correlated to declining levels of greenhouse gas emissions but this appears to be more strongly determined by student body and facility size than by actual diminished emissions as a result of having more Academy faculty members.
Figure 7 shows electricity consumption, greenhouse gas emissions, and facilities area as functions of US News Rank with a reversed axis. As was the case with Academy membership, these rankings are quantized and meaningless if normalized per student or per area. Excluding Berkeley, electricity consumption exhibits a strong positive correlation with increasing rank for public institutions. A similar, but less significant trend is apparent in private universities. Normalizing by student population reveals an moderately well-correlated positive trend for all universities, although each type of university distinctively set apart from each other. Greenhouse gas emissions show no significant relationships among either set besides the expected inelasticity when normalized by area.
Conclusions
The goal of this study was to determine the validity of a causal model linking facilities area, electricity consumption, and greenhouse gas emissions and explore the social and economic factors that possibly interact with the model. If research universities are to be sustainable enterprises, then they must identify those activities and practices which diminish their
environmental viability. While research universities have substantial organizational capacity and
technical expertise to address their environmental impacts, substantial uncertainty exists about the scope of the university as a system as well as the methods by which to develop and assess
their impacts.
The analysis of the data strongly supports the causal theory that increased facility size is linked to increased greenhouse gas emissions by way of electricity consumption. This suggests if universities are to take significant steps towards reducing their contribution to increasing global greenhouse emissions, then they must address their facility size first and foremost. While pursuing alternative means of generating electricity to meet this demand would reduce greenhouse gas emissions, shifting energy production does not address the root problem. In addition to causing increased greenhouse gas consumption, taken alone, larger facility sizes have larger impacts on the natural environment because of their displaced flora and fauna, altered erosion and runoff patterns, and consumption of resources in construction. Similarly, increased electricity consumption (generated by traditional fossil fuel combustion) not only creates more greenhouse gases and other toxic effluents, it is also a proxy for increased levels of consumption for other resources.
The secondary variables of economic and social indicators showed some linkages to the causal model, but not nearly as significant or well-correlated. Endowment appears to be a strong driver
of electricity consumption, but the same relation does not hold as expected for greenhouse gas emissions. Research expenditures show well-correlated increases in electricity consumption and greenhouse gas emissions, suggesting that increased research activity inevitably demands more electricity. Although this exploration of economic and social contributions to the model of university greenhouse gas emissions did reveal some outwardly valid trends, they would require
substantially better controls to be found significant.
Much work remains to be done for environmental reporting among research universities. This study was limited by a lack of available data from many leading universities. Moving towards standardized definitions and methods coupled with the emergence of a body of expert knowledge
and best practices specific to universities should increase the availability of this data in the future. Moreover, studies like this are important tools for universities to be able to understand and address their impacts on the way towards realizing their mission as sustainable enterprises.
ApPendix
A: Figures
Duke igieleonlo tisN Berl.ley 0 Washirjida CornellO 0 MITe MichigarSta, 0 o -ra- V-a . I-, ,. , . t . ' ' 5 0 1.007 -- 7 . . .. t'. . 7 5swau§,,h_, - , , -, ... . : ~..:"'~~~~~~~.' - M CamegiMellon Tenessee Washmgtortls Bere6riduaQhIIcShinSState 0 0 Duke Mic. III
.-t
N 15. II (Cv2 '-I-I . a' w ' ' gMelon Duke Berkeley 0 Yale Menessee UO comoho"g9lo · Florida 0 Michigan 0 Tus U MichiganState 0 · · O · 00I . .7 500M0 1.s49-7 Squaefdtag Duke Florida Washington o CarnegieMellon 0 ESkeley 0 Tufts U . -.W47 2.506i+" . a .o0.*t .n. Comelt .: Yale TenesseeO 0 MichiganState 0 0 SooFigure 1: Electricity Consumption vs. Facilities area (aggregate, per area, per student, per researcher) 30 I aI fl 5-U: r I O 'a It- 8-S .I
F
g E.V
.A :00 - . . . . ... . . .. . : . .. . . . vYal o_ 4;0 Ai6~ ·-.t~ . -· r df( . sisn3afiiiipo°ahmMichigsnS:ate Florida 0 Illinoi, o CarnegieMellon U Cornell MIT Ya E a Berkeley 0 Tuts U 1 O8M00O r" -7 . .- -.. I4 axotsss 3r~olErwB 480(t 0Mc!:.gar O B-a I jm , I~ 00= CamegeMelon MIT MiC~l 1e Yale l| FfrQa Illinols U 0 0 o Berkele
j
o Tuft EUeefly _ .' -CarnegieMfIn IgnSiae 0 Florida FIO a 0 ~ Tuts I t : I -.012 .014 .016 .t ' 'aEc_ pa'(~ =~'j.r · . CarnegieMellon U MlchiganState O Florida 0 MIT N Berkeley 0 .02 0.. tsrBan Comell; a -BPana)~~~~~~~~ . 9 -. , . - , . .. . . . . .Greenhouse gas emissions vs. Electricity consumption (aggregate, per area, per
student, per researcher)
31
i
ii-
#I i! E . . c f..
.I .I IV-.I. Figure 2: I . . o SI I :1 :.t -to, a .ri q~owpn~rrrug~tit00e07 I
Zooe+07 2.50e-07 5000000 1t.0e07 1.50e+07 Square footage 20ea7I 2dc07I Z.00e+07 2.50e+07 0 U F;,,ri da erlStaI O j yeMrIur, Harvardrnell MIT 'ale 0 0 0 Barkeley 0 Tuts E I 1 I 5000000 1,00e+07 1.0ae+07 Square footage CamegleMellon * I' r- CarneieDe ,_1 Mr a E CarnegieMellon Harvard · Bereley 0 Berkeloe 0 200 400 800 eo0
Square footage pr studlen (qDshudentQ
Figure 3: Greenhouse gas emissions vs. Facilities area (aggregate, per area, per student, per researcher) 32 0nn?-A O 1000 1200 1000 1200 500 TutsT.1 Florida MIT . 1 000 1500
Square fotage per researcher (qltresearche0
McligrState 0 M chlijan Oale N Cornell N 2000 Tuts N I 99-c a P Se V 2I I El rniState O M c hganState Flr:,d (,arvard O · Tuts U if., S . g-I P;q I I -i 28 . R E II 17 r ie:ellon Ni
se-;-
f
m r: Florida o M lh libamS[ale o MPAclgar oa le
Michigan a. O I I O Corell Yal Serkele1 MIT E a Duke L Usc 0o ., MIT Uiii..,is Cameg Nhor
Te. 'sIe
Or~ ''ads~ h ngori; Tufts
ia n EerrelI ®~jA~ Duke U Yale U -a I Nw Endowme nt prstudent ttd ... ... CarnegMtlon -MIT e * Yale * .
|1 55Fer tM!=U6 Harvard
Endowment per AtuetWM" - .
Caneg Mellon
Berieley Duke
O *
'eeson.,.~,ee Wasin9 %i~r iell Fioida O a Tufts iganSt t e MIT U ValeY. I I r I , uddenepfftMtaJ OO B ee au PennState CarnMellon Florida " Igate
_ Mic MIT Ye Harvard
TUts . . . .. hindlwnwe pe t W1 I I 'l Mlcigan MichnganState Florida t f Washington ;
ne Eee M;T Yale Harvan;
aT MIT
.
a
Duke l!CaVifIon
;I-. s et , ·a i.. I .
-
e.lm..,.
%~.~9
Harvard 5 . 4!idM ° ierYaley L.nflow nt m tm de m .l o . .. Mictgan gnState Florda 0 Washirigton enessee a CorneU Texas BeIley CaeRlellon MIT Duke U Vale Harvard U UFigure 4: Trends in endowment
33 Illinots f en r eelas CarngMell rgon · I-U 23 SI toII 9 r. 'N it-I I I .2 040 1. 000 4te e 1w Endowment( ). igStLe Michigan .ale e hMellon i Cornell Harvare .l Berkle y Tufts a I m' , -I ,- ~~I. I I I
.EntM ... per pm rear58 l '( o 1e: I
h~~~r~~~lnnmlprrenr( L~~~~~~~~~~~~4rp ·~~~~ w
Michlgar aR 0 3 0 i- -Mic hlaWaShlngton i Tenessee 0 Camegi Mellon U I 1 U S rgton Tut a I, r r Tenresse O O Tuftdasi!iton .. . . .r . . -Duke I 0 i-.I LA 10000 2000oo ooM8o o
Research esendilners per letSudt '
CsmeMellon U s MIT C Yale * *59-U I b Ovir Huev; O Qt O T eley.s TOUB' 09 I . . . I I
Resea Speediuesr t etrch sleest
Yale MIT
lo ", Duke '
Harvad U
$
Tus C mlSle Melia.
0 Benrsie>O: Penr S!ae · N '.t . . '"' <" ' -. 1 .w.-...' ' :
--.0--
Relnerci'pei'seit:ree..
e d '.e ' '.s Tenesee 0 Yale CorMlllUhlgan TUr CamegMellon Berkeley Duke 0 * wlngton ganState 0 I I . I 2011 40 .OResearch PWsflePWWre
"or
CameglMellon IganState 0 Fliorda Co!ilZrd Tus eo PennStale 0 Mrr U Berkeley O 20 40 SO so t Michigan Florida *7 rd MIT O * Berkley 0 Tuts CarnegeMellon Duke * PennStae
Figure 5: Trends in research expenditures
34 I P-11-.9 E g , r I..
0-jI-s
i
V-W i i IF i_ I-~ e .I h fm I Researni~;~o~~a&HI2.We w+wMirlgri 0 Florda Plrlte Michigan
O e , 0 PF2ifte L Carneg;Mellon a -CJr s MIT } Berkeley Tufts I U0 9--MichiganState -j -Florda - il Foe ds Washington Tenessee coropll O ° -o Texa MIT g. O Beley - jf ake uTs CameegMellon P $1 i _ - - -... v .I.-: AM,: 19
9 I ,
-.o xr MlchiganSlale 0 Florda 0 PennState Illi CaregieMellon rufts U Michigan -O a, inols a E Comell Harvard f U Vale M U -Berkelev LI
'' U fff Vale ,.MT i0 - TeS' ah n Ekeley t ici lu.' ! -; n a 0 F d .'e ley O O USC ° S w 0 0 5o0 100 1520S50Nalonat Academy rebers
ruS U CarnmeMelon Y8l1 Mi.-os.n:Staa C6i .Jkllr.S: I- o ' 0' -a' MIT S 'a-Ise Harvard - ° 9erkeley o~ Yale MIT U U U Halrvard tB O 0 Borkeley 0>.aS 00 PenSr..te 0 CamegMellon essee 0 Florida 0 Tols o MlchiganState a Duke Berkeley a 0 Yale V&nr n MIT U 100 1t050
NdosshASt amy members
PennState Cameglllon Florida MichlganState 0 CM a
Crse
ru't. O ,. 'a '5 . .-0 MichlganState Flondas 0 Washsngtn orne U Tufts TUr -Bc am T 0 .. xsg .. M·~~~~~"0
*010Figure 6: Trends in National Academy membership
35 a I o-isr
il
I * o- S IA-Ow rniii
S; 12roo. r 20 N A. f .. A.lIW %tOW-AC&Perrift-Wwixlr · Florida 0 Washington Cormersee * Yale Harvard
0 Texas mBerl l Due Tufts Csne-Toss cobocre~~~~i'" . .6 . i.1
FI, l¢ igan O , Brli 1 'Ve- re Cornell ev MIT Duke Ca []ftUeMellon U U rel r3 3 t.?: :>l9_~~,,.. ,. ·, Cor Yale l lo rn°- Tenes-egC O o O V:3uierutrrTufts 1 ',1l~-. .S:k~L "<rr.i 0 0z_ USC °0 °3~u O P MIT Yale 4p" ,. · 0 Duke ;T6 -I G u-CarneiMellon e elev; F iorli ri O
0
Tns
Duke [] Yale [] chirqari Stt 0 t0 60 40 20 US News Rank PennState CarltetMellon Florlda i':anStt Mn0_ MucriunC1ornellMiIT Yale Harvar skelev Tufts 0
r
[ 80 60 40 20 US News Rank 9AI H IgnState Harvar . 'i .T. pI O Te^us .B + 0 Berel 1 0 ;t Ca~ 8060I I I 80 60 40 20 US News Rank Cornell Yale Harvard MIT a S ey H Duke telon US News RaekFigure 7: Trends in U.S. News & World Report Undergraduate Ranking
36 Orn a0ir iic o g o-.e ZDO I o C3 lo 100o s'o US News Rank hirtuflStdte ,I ltgaCPn "Fh-da 0 V -llnrenn 'tate 0
Co•nell * MIT Yl H.arour
- ~~55-1US 100 50 Rank US Nes Rank 8 9. MIT* Yale 1 °-OI.. :h Cor nell
00 0 U' TuQ~~~i~~eiei0' Uik";- 11 80 60 40 20 US News Rank Mlichigan o ° IIT
'?on
Bese Yale Harvar rc
0 MIT *
0eO Bereley Duke X
st I Z° . EVgm~~" f m 9 0060 40 20 US News Rank MIT Yale n Cornell °a Duke tlasersua ? Cae 8eMello n
O P:.?;S.?; O I I I 2 80 0 40 20 80 60 40 20 US News Rank .. rne.t'nurn I I I I g.' V. SI