Context Identification in Electronic Medical Records
By Reejis Stephen
M.B.B.S
Saint Johns National Academy of Health Sciences, 2001
Submitted to the Department of Health Sciences and Technology in Partial Fulfillment of the Requirement for the Degree of
Masters of Science in Medical Informatics
At the
Massachusetts Institute of Technology
August 2004 . .. © 2004 Massachusetts Institute of Technology
All rights reserved.
ARCHIVES
Signature of Author:
Certified By:
~,1
Department of Health Sciences and Technology August 31, 2004
Aziz Boxwala Clinical Assistant Professor of Radiology, HMS Affiliated Faculty, Division of Health Sciences and Technology Thesis Supervisor
Accepted By:
Martha L. Gray Director, HST Edward Hood Taplin Professor of Medical and Elqctrical Engineering, MIT
MASSACHUSETTS NSTITUE OF TECHNOLOGY LOV ± 4 2004
LIBRARIES
j.. , r .\~ 1.Context Identification in Electronic Medical Records
By Reejis Stephen
Submitted to the Department of Health Sciences and Technology On August 31, 2004 in Partial Fulfillment of the
Requirements for the Degree of Masters of Science in Medical Informatics
ABSTRACT
In order to automate data extraction from electronic medical documents, it is important to identify the correct context of the extracted information. Context in medical documents is provided by the layout of documents, which are partitioned into sections by virtue of a medical culture instilled through common practice and the training of physicians.
Unfortunately, formatting and labeling is inconsistently adhered to in practice and human experts are usually required to identify sections in medical documents. A series of experiments tested the hypothesis that section identification independent of the label on sections could be achieved by using a neural network to elucidate relationships between features of sections (like size, position from start of the document) and the content characteristic of certain sections (subject-specific strings). Results showed that certain sections can be reliably identified using two different methods, and described the costs involved. The stratification of documents by document type (such as History and Physical Examination Documents or Discharge Summaries), patient diagnoses and department influenced the accuracy of identification. Future improvements suggested by the results in order to fully outline the approach were described.
Thesis Supervisor: Aziz Boxwala, M.B.B.S., Ph.D. Title: Clinical Assistant Professor of Radiology, HMS
Acknowledgments
I would like to thank my advisor Dr. Aziz Boxwala for providing insightful feedback, criticism and direction to the work. This would not be possible without his support, guidance and patience.
None of this would have been possible without access to the database and text parsing tools provided by the Eclipsys Corporation. Thanks to Paul Gertman and Lynn Martin for their mentorship, encouragement and provision of these resources.
Thanks also to Dion Harmon who lent his ear to the ideas as they evolved and his skilled editing of my bulky code. Thanks to Vishwanath for his enthusiasm constant interest with such ideas, and for his help with using the documentation-free linguistic software and to Joyce who provided all her help and computation hardware when my system crashed. Thanks also to Anoop for his invaluable help with formatting. And thanks to Wai Ling and Ed for keeping my spirits high throughout.
Of course, none of this would have been possible without my family, so thank you Mom and Dad, Reena, Kumar, Keets and Rony.
TABLE OF CONTENTS
CHAPTER 1 ... 6
INTRODUCTION ... 6
1.1 BACKGROUND ... 6
The Nature and Use of Medical Information ...6
Extraction of Information from Text Documents ...8
Natural Language Processing ... 10
1.2 PROBLEM STATEMENT ... 13
Document Types and the Content of Sections ... 13
Identifying Sections within Electronic Medical Text Documents ... 16
Prior Work in this Domain: ... 17
Approaching a Solution using Artificial Neural Networks ... ... 18
1.3 STUDY APPROACH ... 19
Topological Features ... 20
Qualitative Features (Content Variables): ... 20
CHAPTER 2 ... ... 24
MATERIALS AND METHODS... 24
2.1 DATA SOURCE AND INITIAL PROCESSING ... 24
2.2 DESCRIPTION OF DOCUMENTS AND SECTIONS ... ... 25
2.3 GROUPING OF SECTIONS ... 29
2.4 PREPARATION OF DATASETS ... 31
2.5 TRAINING OF NEURAL NETWORK ... 31
2.6 CONTEXT ASSIGNMENT METHODS ... 32
2.7 EVALUATION METRICS ... 34
For the Type I Method: ... 34
For the Type 2 Method: ... 35
2.8 METHOD COMPARISONS ... 37
CHAPTER 3 ... 38
RESULTS ... 38
3.1 INPUT VARIABLE RELEVANCE ... 38
3.2 TYPE I METHOD ... 39
3.3 TYPE 2 METHOD ... 40
3.4 COMPARISON OF METHOD 1 AND METHOD 2 WITH ACTUAL LABELS . ... 40
CHAPTER 4 ... 41
DISCUSSION ... 41
4.1 DESCRIPTION OF THE INPUT VARIABLE STATISTICS ... 41
4.2 HISTORY AND PHYSICAL EXAMINATION DOCUMENTS ... 41
4.3 DISCHARGE SUMMARY DOCUMENTS ... 43
4.4 EVALUATION OF THE TYPE I METHOD ... 45
History and Physical Examination Documents ... 45
Discharge Summary Documents ... 49
4.5 EVALUATION OF THE TYPE 2 METHOD ... 52
History and Physical Examination Documents ... 52
CHAPTER 5 ... 58
5.1 IMPLICATIONS OF RESULTS AND CURRENT UTILITY ... 58 5.2 FUTURE DIRECTIONS ... 63 R EFER EN C ES ... 66 A PPEN D IC ES ... 68 APPENDIX 1 A ... 68 APPENDIX I B ... 68
History Document Descriptive Statistics ... 69
Discharge Summary Descriptive Statistics ... ... 74
APPENDIX 2: ... 78
APPENDIX 3 ... 80
APPENDIX 4 ... 98
History and Physical Examination ... ... 98
Discharge Summary Documents ... 117
APPENDIX 5 ... 128
Discharge Summary Documents ... 128
Chapter 1
Introduction
1.1 Background
The Nature and Use of Medical Information
Clinical encounters such as hospital stays or outpatient visits generate a large amount of
information. This comprises demographic data, like age, gender, race, contact
information, address, payer information and clinical data such as laboratory test results or reports, clinical history that is obtained from the patient or a proxy, findings from the
physical examination, and treatment given to the patient. This information is highly useful to the patient care provider, and institution for several utilities:
· For reimbursement to the provider by the payers [1-3]. * For grouping into research cohorts.
* For measuring the quality of care meted out in a visit and whether it conformed
to the standard practice guidelines.
* For measuring operational performance of an institution and planning of resources
* For determining whether established guidelines yield desired outcomes.
* For implementing clinical decision-support for the providers and patients. * For longitudinal care of the patient
Many of the discrete data items such as visit outcomes, diagnoses, cost of items and services and diagnoses, needed for the above applications, are often abstracted from the documentation generated by health care delivery personnel. Hence, there is a large
potential to extract this information from both perspectives of a cost of care and quality improvements in health care delivery.
Much of the information is available only as a narrative text and it needs to be converted into a codified standard form. Numerous schemes for codifying medical data exist- such
as SNOMED (Systemized Nomenclature of Medical and Surgical concepts) and ICD-10 (International Statistical Classification of Diseases - tenth revision), all of which arose
for the express need of standardizing the meaning of what is usually captured in natural language. The problem remains processing the data from narrative text into these codified forms. Except in a few situations, human abstractors currently do this, and the volume of
work involved poses a significant cost to hospitals. Thus, a very small portion of the possibilities for utilizing these data has been realized.
Currently medical information is available in several hospitals through the Electronic Medical Record (EMR) systems. These are also known as Computer-based Patient Records (CPR). EMRs are a "repositories of electronically maintained information about
an individual's lifetime health status and health care, stored such that it can serve the multiple legitimate users of the record" [4]. In its current form even though electronically
available, much of the useful clinical data is still in pre-processed textual form in medical databases. A very small part of the information such as laboratory test results and
demographic details are captured directly as granular elements by the system. Much of
the rest remains locked in the natural language of clinical documents in EMRs.
To obtain discrete data instead of natural language text, several attempts have been made earlier [2]. One approach is to captured codified data during clinical data entry using the
above mentioned and similar coding schemes [5]. But such methods have been difficult to implement in clinical practice except in very limited domains as they prove to be time
consuming and disruptive of the clinical workflow [6-8]. This produces a resistance
towards the implementation of codified data entry in clinical environments. This is because it takes sufficient effort to make representation systems that capture all the
clinical nuances, and these are very likely to be incomplete requiring additions that may be overlooked given the detail of what can be said using natural language. There is the
added step of training users to pick the right codes for the intended meaning of terms, as the terms may not be obvious to them. This is an intensive task and if the users are not
properly trained, there is potential for errors in data entry. Hence text-based electronic
records are likely to persist in use long enough to warrant automated information-extraction techniques to be developed if the utilities mentioned earlier are to be realized.
Extraction of Information from Text Documents
There are several approaches to extracting granular information from documents. The most commonly used is by employing human abstractors to manually go through
of granular data elements they are interested in. This process is time consuming and
tedious. Abstraction by humans is also costly and error prone. Hence, human abstractors are typically employed to extract only the most essential information- typically diagnoses entries for the purposes of payer reimbursement.
This limited usage does not allow for the bulk of information in medical documents that may be used for various purposes such as the aforementioned benchmarking initiatives,
cohort selection, physician profiling and the like to be captured in reasonable time as it
takes the average coder time to go through a record for the most granular information such as diagnoses or specific quality control data like the JCAHO (Joint Commission for
the Accreditation of Health Organizations) core measures [5, 9]. Hence, this does not
scale to the extraction of all the potentially useful information from documents, which is subsequently lost.
Another method of extracting information from free text is by using Natural Language Processing (NLP). These techniques enable the rapid extraction of information from
electronic text documents with an accuracy that is only limited by the ambiguity and form of the syntax employed in the documents. The technique promises to realize the range of
possibilities that medical information may serve, as it allows automated extraction in
bulk, across a variety of purposes at relatively low human effort. Much of the human effort is in the initial investment and subsequently allows rich yields.
Natural Language Processing
Natural language processing is done by either of two methods or a combination of both. These are linguistic-based parsing and statistical techniques. Linguistic parsers take the
syntactic form of sentences into consideration. Every input sentence is broken into components and an attempt is made to match each part with a known database of words
or groups of words that correspond to clear parts of speech- like the subject or object of a
sentence. Meaning is inferred based on the known form of the syntax represented. The power of such tools increases with the number of syntactic sentential forms incorporated
into the model. Statistical techniques on the other hand attempt to capture meaning by looking at the frequency of the association between words and a particular concept of
interest. For example if the word pattern "heart attack" is preceded within some defined length of characters by the word pattern "not a", the inference might be made that a heart
attack is not present. Other methods are used for statistical parsing such as Hidden Markov Models [9] and the application of more qualifier patterns to subjects, but the
number of things that may be tried are open ended and beyond the scope of this
discussion. The validation of the data extracted by this technique is intractable especially when more complex meanings than the simplest facts are desired. In several cases, the subject of pronouns is only attributable based on the context, and that level of
establishing context from text is impossible to achieve in its entirety.
Both methods attempt to extract a value for concepts represented in documents. Concepts are concisely captured meanings which are the basis of reasoning [2]. They form the
elements whose values are granular data needed for the purposes mentioned above. For example, "aspirin" is a concept. It has synonyms like "acetyl salicylate" that map to the
same concept. NLP parsers treat all synonym instances of a concept as the same element. Concepts are available readily from ontological hierarchies of concepts like from
SNOMED-CT and the International Classification of Diseases (ICD) systems among
others, and have found wide utilization in the standardization of medical data through codification [2, 10-12]. The system chosen depends on the specific use of the elements
the parser is trying to capture. A typical example of a SNOMED concept hierarchy
includes child concepts and how they relate to parent concepts. For example, "Aspirin" is a concept that is a child of the concept "medication" which in turn is a child of the
concept "substance". Concepts may also belong to different trees- i.e. multiple inheritances are possible and a concept can be the child of more than one parent.
Before either method of NLP extraction may be applied, in medical documents, errors are reduced if the context in which the information was obtained from is first identified. For
example, the term diabetes might have different implications in the context of a section
on family history than in a section of history of present illness. Medical documents have a structure comprised of context-specific sections of text by virtue of the methodical
approach health care professionals have towards patients that is usually consistent. As an illustration, the prominent clinical text book on the approach to a patient, the Hutchison's
Clinical Methods, twentieth edition suggests the following sub headings for sections of a History and Physical Examination document [13]:
The history of presenting illness. The history of previous illness. The menstrual history.
The obstetric history.
The treatment history. The family history.
The social history.
The occupational history. Review of systems.
These sections are followed by the Physical Examination. The physician will typically
conclude with a conclusion or impression of the case and a plan for care. The structure of such a document is generally the same for all physicians who practice the allopathic system of medicine with some variations based on local formats or physicians' personal
preferences. For instance, a few of the sections might be left out - such as obstetric
history or treatment history. There is usually a "presenting complaint" section followed by a "history of presenting complaint" section and always a "physical examination" section.
Thus, there are two clear steps to the process of NLP-based extraction. Identifying the context, and then parsing the context for the concepts of interest. This work attempts to
make progress on automating the problem of context identification. The next section discusses in detail the sections involved in different kinds of clinical text documents.
1.2 Problem Statement
Document Types and the Content of Sections
Two types of documents of interest for clinical information are the History and Physical
Examination and the Discharge Summary documents. The first is generated during the
initial assessment of the patient and the latter is a summary of that episode of care at the end of the visit. There are other kinds of text documents such are progress notes,
consultation reports, clinical or laboratory test reports, and nursing notes, but the focus of this research is on History and Physical Examination and Discharge Summary
documents. Both these are divided into sections. A History and Physical Examination document has the following sections:
1. The presenting complaint.
This contains an explicit set of problems stated by the patient in his or her own words as to the reasons for the visit.
2. The history of presenting illness.
This section goes into each of the complaints enumerated in the presenting
complaints section and attempts to elucidate associations and distinctions that further help in identifying the causes for each.
Any chronic illnesses or past illnesses that might change the approach to the patient are described in this section.
4. The menstrual history.
This section is not always present, but identifies the details of the menstrual cycle,
that may be pertinent and affect any kind of care, but tend to be overlooked.
5. The obstetric history.
This section is usually very relevant in Obstetrics and Gynecology cases and
affects decisions made about the patient in this context. 6. The treatment history.
This section goes into details about the current illness and what treatment has
already been received or self-administered.
7. The family history.
Relevant illnesses in the family are obtained in this section as well as details
necessary to decide whether intervention on the family level is necessary or if there are aspects of the illness complicated by association with the family.
8. The social history.
In several instances, social circumstances complicate a case or offer insights into
understanding the origination of the illness. These are recorded here. 9. The occupational history.
Many diseases are consequential of certain occupations and these occupations can complicate some diseases.
The purpose of this section is to identify history related to every other system than the ones that are complained about to ensure that nothing is missed.
11. Physical examination.
In this section, the physician objectively examines the patient and records findings.
12. Conclusion or impression and plan.
Here the physician's interpretation of the case, as it appears is summarized along
with a plan for care.
A Discharge Summary document summarizes the initial visit and subsequent
assessments. Hence, it has many sections in common with the History and Physical Examination document. This document type also has other sections.
These are: 1. Hospital course.
This comprises details of the stay and interventions carried out during this episode of care.
2. Discharge diagnoses
This is a list of the diagnoses the patient has- both past chronic diagnoses and the
ones identified during the visit. 3. Discharge plan.
This section explains the next steps to be taken with regard to that episode of care, such as when a follow up visit is needed, medications that are prescribed, or what
Several sections are not described in the traditional books, but health care personnel have found them convenient to record and these are consistently found within both kinds of documents mentioned above. Two good examples of these are:
1. Allergies
It is sometimes grouped under personal history, but at other times independently noted and is where allergies particularly to medications are noted.
2. Medications.
The medications the patient is on at the time of admission are noted here. The best index for the structure of a document is the local practice at a place. The
structure drifts over long periods but is quite consistent in the short term and adapted to the needs of the environment in which it develops.
Identifying Sections within Electronic Medical Text Documents
As illustrated above in section 1.1, ascertaining context in medical documents prior to parsing the text for data mining purposes greatly increases the accuracy of the data
captured. Electronic medical texts are handwritten by physicians or transcribed from
audio files. Rarely are they typed in directly as separate documents in the database. In most cases, they usually have section headings in them, and context identification is
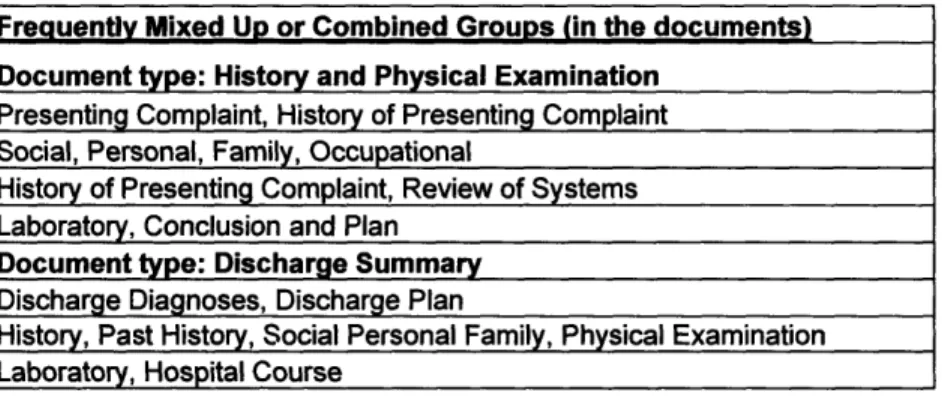
usually possible using simple rules. However, sometimes section headings are left out altogether; sometimes, wrong section headings are given and even non-standard section headings might be used. Sections may also seem to blend into each other without any clear-cut distinction. For these reasons, a simple parsing of section names is not sufficient
for labeling sections (assigning a fixed context marker to the section) prior to data mining efforts. This makes any attempt to parse out sections unreliable by itself at best and
potentially misleading at worst.
Attempting to identify sections without relying on explicit headings given to them must
then be based on other generalized features that can be consistently identified. These would have to range from the topological properties (see below) to the content within
sections. This work explores the feasibility of an approach to identifying sections based on easily extractable content and topological features.
Prior Work in this Domain:
Prior work by Hahn et al addresses the problem of identifying section with a complex approach via linguistic methods which was implemented in a software tool [14]. There
also have been attempts to solve the section identification problem in the commercial sector such as the Flemish company, Language and Computing, NV. These solutions are
proprietary. The only other academic work that attempted to address this problem was
communicated via a poster presentation at the AMIA 2001 [15] conference that promised a solution to the section-identification problem, but no approach has been published since. While other information extraction approaches have been successful, these usually
circumnavigated the problem of section identification, by confining NLP-based data mining efforts to relatively single-context documents like test or laboratory reports [16].
Approaching a Solution using Artificial Neural Networks
Identifying sections based on the content and position of sections may be possible using a
supervised learning approach when no rigid rule exists a priori, by which to determine a section. This allows for an overall pattern or regularity to be discerned and classification
of sections done based on the characteristics of sections. One of the best pattern
recognition techniques is the Artificial Neural Network (ANN) or Neural Network (NN)
for short.
A neural network is a mathematical model for information processing based on a connectionist approach to computation. In a neural network model, simple nodes (or
"neurons", or "units") are connected together to form a network of nodes - hence the term "neural network"[ 17].
A typical feedforward neural network is designated by a set of input nodes and output nodes connected by a set of hidden nodes in between. These nodes are processing units.
Each layer of nodes may be connected to the subsequent layer in arbitrary ways under
control by the user. Nodes pass on their outputs to the nodes they are connected to. Each node takes an input and adjusts it by a weight before producing an output with a function, typically a sigmoid function. The final output is compared against the true output for the
case and the degree of difference or error is used to modify the weights by a feedback process such that the modification of the weights is proportional to the amount each
With an adequate number of training cases, a suitable pattern of weights can be obtained provided the model is complex enough, to ensure a good characterization of output
predictions that match or are close to the true values for the cases. This network can then be applied to unknown cases to classify them according to the experience gained during
the learning process.
1.3 Study approach
It is possible to apply neural networks to solving the problem of section identification, provided suitable section characteristics can be identified in a quantifiable manner.
A manual review of the documents was done during this study to identify a set of such features. These were of two kinds:
1. Topological or surface features: Broad descriptives of a section, such as the distance from the start of the document or the size of the section.
2. Qualitative features: A metric of partially quantifying characteristic content
within a section.
These two groups of features for each section together constituted the input set of variables to the neural network.
Topological Features
The surface features that enable identifying sections were obtained by inspection of electronic text documents used as the experimental data in this study. Sections were
grouped physically into paragraphs, or groups of paragraphs. The size of the section was significant as some sections like Presenting Complaints are much smaller than Physical
Examination section for instance. The distance from the beginning of the document was also found to be important (sections like Presenting Complaints are always first while
Conclusion or Plan sections are usually the last in the document). When the content of adjacent sections are clubbed together, a single section in the document would present a
larger size than its component sections individually. This can confound prediction. The
start position and the size of a section, are not sufficient by themselves to differentiate such a variant from the standard cases. To allow a flexibility in recognizing such variants,
a third surface feature variable representing the distance of the end of the section from the end of the document was added.
Hence the three surface features selected were:
1. The section size (Size).
2. The distance from the start of the document (Start).
3. The distance from the end of the document (End).
To control for the difference in style of the language used in the document, an attempt was made to distinguish between identifiable medical concepts within text versus the size
of the text - a ratio which would decrease with the increasing use of non-concept words. The SNOMED-CT vocabulary was used as a universal set of concepts. The number of concepts from the SNOMED-CT in a section were identified using a parsing tool, that
identified synonyms of these from a vocabulary of concept synonyms. Concepts from each section that were characteristic of the subjects of particular sections were used to
test if sections could be differentiated on the basis of this. The counts of concepts that
were felt to capture the characteristics differentiating between sections constituted the remaining qualitative input variables listed below. Synonyms of SNOMED-CT concepts
were used as it was felt that this hierarchy had sufficient detail to enable sets of concepts that distinguished between types of sections. As SNOMED-CT allows multiple
inheritance, whenever concepts belonged to two groups, they were excluded from one of the groups as specified below, inorder to preserve the distinctness in the content
represented by each of the qualitative variables.
The final set of qualitative feature variables were: 1. Medication concept count (Med)
A count of all children of the SNOMED concept "drug, medicament or biological substance" - concept ID 311980000.
2. Procedure concept count (Proc)
A count of all children of the SNOMED concept "procedures" concept ID
-71388002)
A count of all children of the SNOMED concept "laboratory procedures general" -concept ID 269814003.
4. Diagnoses-related concept count (Diag)
A count of all children of the SNOMED concept "disease" - concept ID 64572001.
5. Findings-related concept load (Finding)
A combined count of all the children of the SNOMED concepts "Clinical history and
Observation findings" concept ID 250171008, "findings by method" concept ID
118240005, "finding by site" concept ID 118234003, "clinical history/examination observable" concept ID 363788007, excluding all the children of "symptom"
-concept ID 19019007.
6. Symptom-related concept count (Sympt)
A count of all the children of the SNOMED concept "symptom" - concept ID 19019007.
7. Family concept count (Fam)
A count of all the children of the concept "person in the family" - concept ID
303071001
Each section was evaluated with respect to these ten dimensions and a NN was used to predict test cases based on learning done on a training set.
The format of sections and the content changes with the cultural effects of local practice. Hence, the rules for characterizing sections are likely to vary with the
department, kind of document and type of diagnoses under evaluation. Thus, it is not
goal of this project was to attempt identifying sections at the absolute granularity of labeled sections, a lesser granularity where certain sections would be considered
together, and to estimate how accuracy varied across departments, diagnoses groups, and type of documents.
Chapter 2
Materials and Methods
2.1
Data Source and Initial Processing
This study was performed on the electronic text documents that are part of a
large-scale data warehouse, developed by the Eclipsys Corporation, a company that makes EMR systems. A number of History and Physical Examination and Discharge
Summary documents were randomly selected and analyzed. There were 109 History and Physical Examination documents and 79 Discharge Summary documents, from a 500 bed hospital used in the analysis. The data warehouse is implemented on a
Microsoft SQL Server database management system. The documents in the database were accessed using SQL queries.
The documents were manually inspected to determine the beginning and ending locations of sections. Each section was identified manually by expert review (by the author, who is a physician) and section label assigned regardless of the actual labels
in the document. During this process, the clinical department where the document originated and the principal diagnostic group of the case were also noted. A large text file of the documents with this additional information tagged on to each section in
A Perl script using Regular Expressions (Regex) was then used to parse out the sections from the documents and the information tagged with the identity of each section was used as the "gold standard". The set of Regex expressions that partition
the documents into relevant sections was ascertained by inspection. The expression
patterns varied for Discharge Summary and History and Physical Examination documents and the sets are displayed in Appendix I a.
2.2
Description of Documents and Sections
All the 109 History and Physical Examination documents were from the Emergency
Medicine department. The documents were categorized by the diagnosis group of case being evaluated. The number of sections that this yielded for each group is
Table 1. Number of documents and number of sections within diagnoses groups for
History and Physical Examination documents
History and Physical Examination
Number of Number of Diagnosis qrouD documents sections
General Medicine 33 522 Respiratory medicine 15 262 Neurology 12 217 Cardiology 16 282 Surgery 9 123 Gastroenterology 7 134 Oncology 4 49 Psychiatry 3 58 Endocrinology 3 30 Gynecology 2 36 Orthopedics 2 37 Obstetrics 1 15 Urology 1 16 ENT 1 18 Total 109 1799
The Discharge Summary documents were grouped by the department in which they were created. The numbers of documents for each department are shown in Table 2.
The medical subspecialties were grouped together to give one group called "Other Medical Specialties".
Table 2 Number of documents and number of sections within departmental groups for Discharge Summary documents
Discharge Summary
Department Number of documents Number of sections
General Medicine 22 189
Other medical Specialties 28 189
Obstetrics and Gynecology 16 113
Surgery 13 107
Total 79 598
For the History and Physical Examination documents, there was a slight difference between the expected format and the kind of sections available in this set, but the
differences were found to be remarkably consistent across the whole set, possibly because they were all from the same department. The sections identified for this set of
documents were:
I. Presenting Complaints (PC).
2. History of Presenting Complaints (HOPC). 3. Past Medical or Past Surgical History (PH).
4. Medications (M).
5. Allergies (A).
6. Family History (FH).
7. Personal History (PerH). 8. Social History (SH).
9. Occupational History (OH). 10. Review of Systems (RS).
11. Physical Examination (PE).
12. Laboratory Investigations (L). 13. Conclusion or Plan (P).
For the Discharge Summary documents, the sections obtained were generally a
similar set across departments. These were:
1. History (H)
2. Past Medical or Surgical History (PH).
3. Social History (SH). 4. Personal History (PerH).
5. Family History (FH).
6. Medications (M) 7. Laboratory data (L). 8. Physical Examination (PE).
9. Allergies (A).
10. Hospital Course (HC). 11. Discharge Diagnoses (DD). 12. Discharge Plan (DP).
The accuracy of the section- identification method was evaluated on five groupings of the documents:
1. The group of Discharge Summary documents as a whole (at a granularity
2. The group of History and Physical Examination documents as a whole at low granularity (as described below in the next section).
3. The group of History and Physical Examination documents at highest granularity. In this grouping, every kind of section as seen in the original files was
represented.
4. Grouping the Discharge Summary documents by the department the documents
originated.
5. Grouping the History and Physical Examination documents by the principal
diagnosis.
2.3
Grouping of sections
For group 3 above, the entire set of thirteen sections as described above was chosen for each History and Physical Examination document (high granularity grouping).
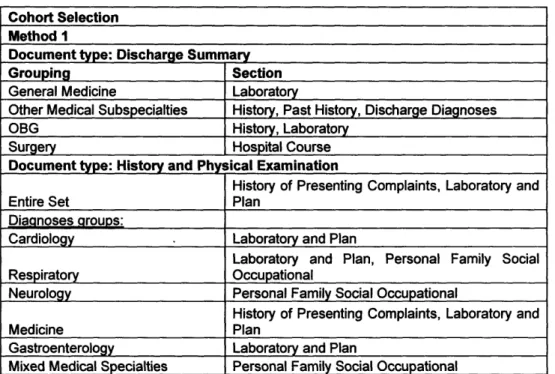
The remaining groups using the History and Physical Examination documents (groups 2 and 5) were evaluated on the low granularity grouping defined below as this was felt to
capture context optimally: 1. Presenting Complaint.
2. History of Presenting Complaint.
3. Past History, Medications, Allergies (PhMdAg)
In location, these three sections were in roughly the same region of the document
but inconsistently present.
These were also in a similar region of the documents and present to different
degrees.
5. Review of Systems.
6. Physical Examination. 7. Laboratory and Plan (LP).
These were usually together and of similar contextual significance.
The groups based on the Discharge Summaries (I and 4) were also considered at a lower granularity than the granularity in the documents as defined below:
1. History (H).
2. Past Medical or Surgical History.
3. Social, Personal or Family History (SPFH).
These three sections were variably present in the same location.
4. Medications (M).
5. Allergies (A).
6. Physical Examination (PE). 7. Laboratory Data (L). 8. Hospital course (HC). 9. Discharge diagnoses (DD).
2.4 Preparation of Datasets
A prior set of concepts extracted by string-parsing using a commercial tool developed by
the NLP company Language and Computing was already available for use with the
Eclipsys database. These previously extracted concepts formed the input data for the qualitative feature variables. Seven feature variables, databases for each feature were
implemented with Microsoft SQL Server database management system, based on groups
of SNOMED-CT concept hierarchies described in section 1.3 above, to enable counts of the number of concepts within each variable-type for each section. This process was
effected by running SQL scripts to count the number of parsed concepts in each section. The three surface feature variables were extracted using Perl scripts. The descriptive statistics of the input variables of both types of documents are in Appendix I b.
For each grouping studied, the sections were randomly partitioned into three sets. Two
sets were used for training and the third was a holdout set used for evaluation.
2.5 Training of Neural Network
Training was done using the NevProp (Nevada University Back-Propagation) version 3
software. The model generated was then used to produce predictions that were tested using other methods. The Neural Network parameters for the training and prediction are in Appendix 2. Details of each are available from the NevProp3 user's manual [19] .
The training was performed well past the best epoch, using a heuristic that optimized for both discrimination and calibration (details in Appendix 2). The best model learnt was
used to predict the unseen cases in a holdout set.
Perl scripts were used to parse the result files and evaluation of the output was done
according to the various metrics described using both Perl and R scripts. Predictions for
each of the available section-types in each of the five document groupings were made. The results were then evaluated according to metrics described in the next section.
2.6 Context Assignment Methods
Contexts are embodied in the partitioning of the document into well-defined regions or sections. Labels or section-types are the markers that identify the sections parsed from the
documents (PE, A, PhMdAg etc). The neural network assigns predictive scores to each input section for each section label. Context identification can be done in two ways using
the NN predictions:
Type Method: In this method, scores are compared across all input sections in a
document for every label. The label is assigned to the input section that receives the
highest score for that label.
For example if a section had the prediction outputs 0.2, 0.3, 0.4, 0.1 for the labels PE, PC, HOPC and A respectively, then the label assigned by the method would be HOPC.
Rationale: With this kind of prediction, a document is partitioned into its
constituent contexts, which can be stored in a database and based on which filtered extraction of concepts by NLP parsing can be done.
Type 2 Method: In this method, scores are compared within an input section for every label. The section is assigned a label that exceeds a predefined threshold. In this way, a section can be assigned more than one label.
For example, if all the predictions for the section PC are in the range 0.2 to 0.9 and if the chosen threshold is 0.8, then only sections with predictions between 0.8 and 0.9 are
assigned the label PC. No sections with predictions below 0.8 would be considered PC
sections. The same section might also be labeled HOPC if it crosses the threshold
necessary to label it as an HOPC section.
Rationale: It is possible that a particular kind of section the user is interested in
and which the NN predicts well, is mislabeled because another section-type has yielded a higher prediction value. When a user is interested in only one kind of section for extraction, such as only Discharge Diagnoses, for example, and
chooses to ignore all other kinds of sections in the document, it is useful to see how the tool predicts the Discharge Diagnoses section to the exclusion of all other
sections. This gives the user higher yields of correct context even when the
section is mislabeled as per method 1 described above, but this approach cannot
be used when the user is interested in more than one section-type for a given set of documents.
2.7 Evaluation Metrics
For the Type 1 Method:
Choosing an appropriate label for a section from a list of valid section labels is a task of discrimination. Hence the metrics used to evaluate the performance of the type 1 method
were the measures of discrimination [20]:
Sensitivity (Sen):
It is the probability that the tool will recognize a section of a given type. With respect to a particular type of section, a True Positive (TP) is a correctly identified section of that type
and a False Negative (FN) is a section of that type that the tool misclassified as a different kind of section.
Sen = TP -- (TP + FN)
Specificity (Spec):
It is the probability that the tool will correctly rule out sections when they are not of a given type under consideration. With respect to a particular section type, a True Negative (TN) is a section that is not of that type and that the tool did not misclassify as that type
and a False Positive (FP) is a section misclassified as that type.
Positive Predictive Value (PPV):
It is the probability that a section labeled as a particular type is actually a section of that
type.
PPV = TP - (TP + FP)
Negative Predictive Value (NPV):
It is the probability that a section not labeled as a particular type, in actuality is not one of that type.
NP V =
Ti
- (TN + FN)
Accuracy (Acc):
It is the number of sections that the tool correctly classified. It is the number of true
positives fir the number of sections in the set.
Acc = TP -' SC
These metrics were evaluated for each type of section when the sections were labeled based on the highest prediction value. The average value for each grouping of documents
was also computed.
For the Type 2 Method:
Within a given section type, the tool can predict a section variably, depending on what prediction threshold is chosen. Hence, the four discrimination indices can change with the
threshold chosen. However as each prediction tries to mirror the actual value, a calibration of performance is possible.
For each section-type in each of the five document groupings, the discrimination across
all valid thresholds was measured using the Receiver Operator Curve (ROC), where the area under the curve, which is equivalent to the c-index, is an indication of how good the
discrimination is.
The Calibration indices used were The Brier Score (BS) and the Hosmer Lemeshow (HL) statistic.
The Brier score is calculated as follows:
BS:
5
(P7-
A
) 2n
Where P is the prediction and A is the actual value (1 or 0) for a given section and n is the number of sections in the set.
The Hosmer Lemeshow goodness of fit statistic (C) was the Pearson's Chi-Square
statistic (with g-2 degrees of freedom) from the table of observed and predicted output
frequencies:
g (Ok -nP,,)
2k=l nPLv (1 - na1,,)
where there are g = 10 bins with n predictions in each bin and Pr is the average of the predictions in the kth bin and O is the observed sum for the kth bin [21]. Both the Brier
score and the C test were implemented using scripts in R on the output generated by the Neural Network.
2.8 Method comparisons
The two methods were compared in performance against the actual label values for each
section and against each other. For method 2, the choice of a best threshold had to be
made for a single model to use for the comparison. This was done by computing every possible specificity and sensitivity for all thresholds and then picking the model with a
threshold that maximized the vector of Sensitivity and Specificity. The discriminatory statistics for this model were then calculated.
Chapter 3
Results
3.1 Input Variable Relevance
For each grouping of variables, the NN utilized the input variables to different degrees. A
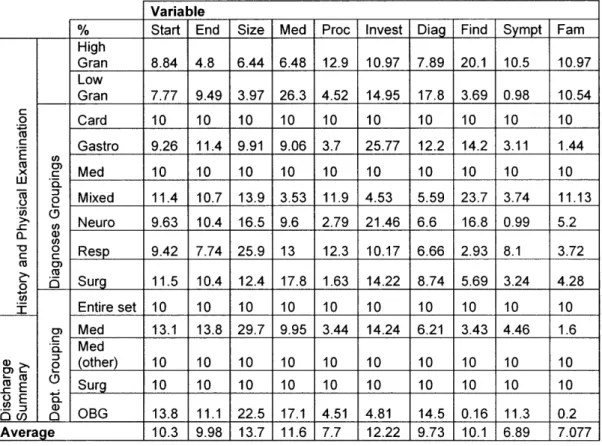
statistic built into the NevProp software computed how much each variable contributed to the prediction. This is called the Automatic Relevance Determination (ARD) statistic and each variable's contribution to the model given in terms of the ARD Relevance statistic is
in Table 3 below. The numbers are a percentage of the total contribution by the variables. Each row sums to 100 percent. Details of the statistic are in the NevProp user's manual
Table 3. ARD relevance statistic for each of the topological and qualitative variables
across all groupings of documents
Variable Sympt End Start High Gran Low Gran c 0 c E x w LU o) c o o I Med Med (other) Surg OBG a)-L Ms . E .0 c en- ; Average 10.97 10.54 10 1.44 10 11.13 5.2 3.72 4.28 10 1.6 10 10 0.2 7.077 .. 0 CD O a) co 0 co
0
c 0 § o (9 0. U) 0 Card Gastro Med Mixed Neuro Resp Surg Entire set 8.84 7.77 10 9.26 10 11.4 9.63 9.42 11.5 10 13.1 10 10 13.8 10.3 4.8 9.49 10 11.4 10 10.7 10.4 7.74 10.4 10 13.8 10 10 11.1 9.98 Size 6.44 3.97 10 9.91 10 13.9 16.5 25.9 12.4 10 29.7 10 10 22.5 13.7 Med 6.48 26.3 10 9.06 10 3.53 9.6 13 17.8 10 9.95 10 10 17.1 11.6 Proc 12.9 4.52 10 3.7 10 11.9 2.79 12.3 1.63 10 3.44 10 10 4.51 7.7 10.97 14.95 10 25.77 10 4.53 21.46 10.17 14.22 10 14.24 10 10 4.81 12.22 7.89 17.8 10 12.2 10 5.59 6.6 6.66 8.74 10 6.21 10 10 14.5 9.73 20.1 3.69 10 14.2 10 23.7 16.8 2.93 5.69 10 3.43 10 10 0.16 10.1 10.5 0.98 10 3.11 10 3.74 0.99 8.1 3.24 10 4.46 10 10 11.3 6.893.2 Type 1 method
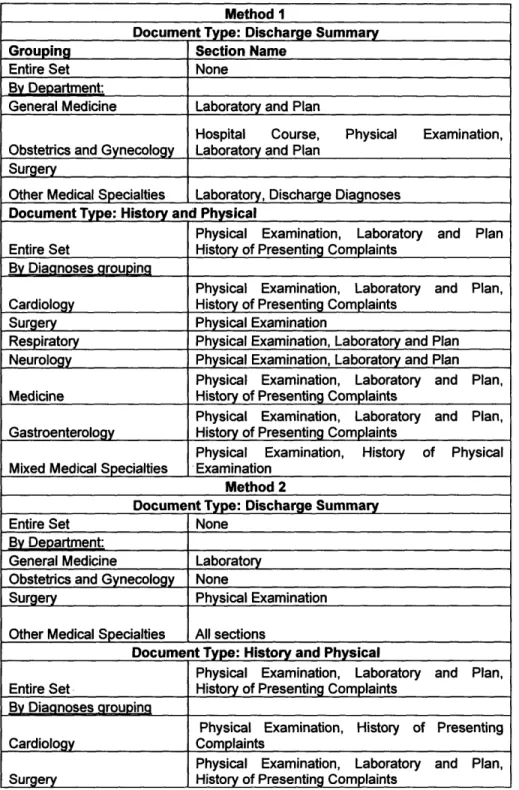
The Type method labels every section in the file in favor of the section type with the
highest value of the NN's predictions. It is useful when the documents need to be partitioned into sections when no specific data mining utility has yet been conceived and
no section is preferred over the others. The results for the evaluation of this method showed it to be mediocre in its present form.
.- . .-
--- 1 . . . , .
--- --- . . .
The discriminatory statistics across the different model groupings are presented in
Appendix 3.
3.3 Type 2 method
This method is useful only when the data mining is going to be from a single kind of
section and provided that other sections which might contain the same subject information do not get mistaken for the given section. The discrimination of this method
was very good.
The discrimination statistics across the different groupings are in Appendix 4.
3.4 Comparison of method 1 and method 2 with actual labels
The comparison of the two methods against the actual labels was plotted as a series of
cross tabulation matrices for easy elucidation of the common misclassifications made and to determine in what regions would one method be superior to the other. This was done
for all document groupings. The results are presented in Appendix 5. For each grouping, the performance of method 2 is based on the best threshold selected. The discriminatory
Chapter 4
Discussion
4.1 Description of the input variable statistics
The ARD score on the input variables showed a roughly equal relevance on average
across the document groups for the ten input variables. Although for a few groupings, there was equal relevance for all the variables, the pattern of variable-relevance was
different across the other groups, and no general trend is defined. The section size appeared relatively more useful in several groupings and the symptom variable was least useful as indicated by the ARD score.
4.2 History and Physical Examination Documents
The History and Physical Examination documents were all generated by the Emergency Medicine department and as expected, a common structure prevailed in the document
formatting on manual review of the documents and on inspecting the description statistics of the sections.
These statistics are given in Appendix I a. For History and Physical Examination
documents the following findings are noteworthy:
1. The mean positioning and size of the sections is consistent with expectations. The section-types are arranged in the classical order expected in History and Physical
Examination documents. However, the middle sections of A, S, F and PerH sections
are not ordered well among themselves and they are present inconsistently. The largest sections were PH and PE and this was consistently reflected in the statistics. 2. In the PC section, the most prominently represented content-related variable was the
Finding input variable, which is expected as the SNOMED classes of symptoms and findings are similar, and this section is meant to capture the symptoms.
3. In the H-OPC section none of the qualitative-feature variables have been parsed, and this is desirable as each of the content-related variables have been designed with a
view to capture specific aspects of other sections.
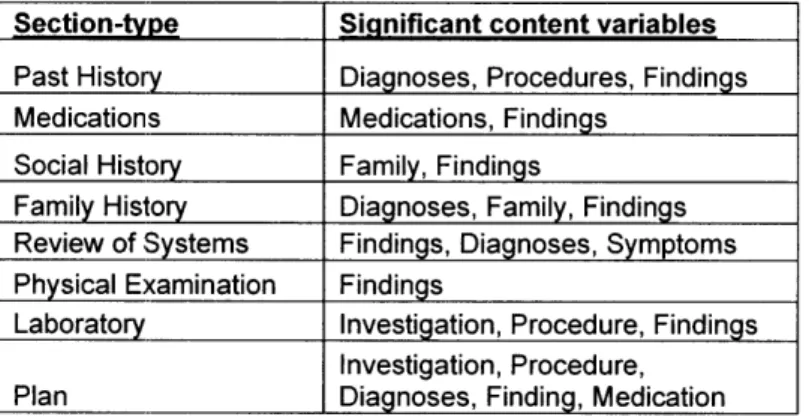
4. The most represented qualitative variables for each section that were successfully
parsed out are in the Table 4 below.
Table 4. Expected significant content variables for different sections in History and Physical Examination documents
The findings variable is present in almost all the sections to variable degrees and has
Section-type Significant content variables
Past History Diagnoses, Procedures, Findings Medications Medications, Findings
Social History Family, Findings
Family History Diagnoses, Family, Findings Review of Systems Findings, Diagnoses, Symptoms Physical Examination Findings
Laboratory Investigation, Procedure, Findings Investigation, Procedure,
5. The variables that were prominently represented, but might not be of obvious
significance are the following in Table 5 below.
6.
Table 5. Unexpected significant content variables for History and Physical Examination documents
Significant content Section-type variables
Allergies Diagnoses
Personal History Diagnoses
Occupational History Family
These can be explained since the diagnoses of hives, urticaria and allergic rhinitis are prominently featured in the A section, the family history is frequently included under the
O section and negative histories of diseases featured in the PerH section instead of PH where they should have been if the traditional format was strictly adhered to.
4.3 Discharge Summary Documents
The DD sections were not as consistently formatted as in the History and Physical
Examination documents. This is in part due to them being from different departments across which practiced methods can vary. The positioning of sections within documents was consistent, except for the DD section, which had a low start position, though not at
the beginning of the documents, and a very high standard deviation. The high standard deviation was because some documents had this section at the beginning and some at the
The expected content variables of prominence for each of the sections are in Table 6 below.
Table 6. Expected significant content variables in Discharge Summary documents
Section-type Significant content variables History Finding, Diagnoses, Procedure Past History Diagnoses
Social Personal and
Family History Finding, Family, Invest Medications Medications
Investigation, Procedure,
Laboratory Medication, Diagnoses, Findin Hospital Course Investigation, Diagnoses Physical Examination Findings
Discharge Diagnoses Diagnoses
Some sections had unexpected yields of qualitative variables that were not obvious (Table 7 below). The DP section contained frequent references to counseling involving the family members, which explains this case.
Table 7. Unexpected significant content variables in Discharge Summary documents
Significant content Section-type variables
Discharge Plan Family
Physical Examination Procedure
Allergies Diagnoses
Several documents from specialty departments contained diagnostic investigations that were part of the initial examination and were labeled under PE. This is a deviation from
recommended practice but is common in specialty routine. The A sections had high yields of diagnoses for similar reasons as in the History and Physical Examination
4.4 Evaluation of the Type 1 Method
History and Physical Examination Documents
High Granularity Grouping
The average sensitivity (0.63) of the method for this group of documents was not
sufficient to make the approach universally useful across all sections. The average PPV was even lower (0.58) as there were disproportionately greater number of false positives
among the predictions.
The accuracy of predictions ranged from 0 to 95 percent. The most accurately predicted
sections which are also the sections with the highest sensitivity were the PE section (0.95) followed by HOPC (0.91). These values are sufficiently high for practical utility. However, the PPV for these were significantly lower (0.72 and 0.52 respectively). It had
zero success with PerH, L, F and S, probably due to the relatively small prevalence of these sections (2-5%) among the documents. The remaining sections were predicted with
poor accuracy, though notably each of these also had a low prevalence in the set (<7%). The NPV was significantly higher than the sensitivity, indicating that the false positives
were proportionately more than the false negatives.
A large number of sections were misclassified as PE sections, which also happened to be the most predominant section in the set. These misclassified sections were typically those
Low Granularity Grouping
The overall accuracy as expected goes up when the granularity of section-labeling is reduced. This is because the binned groups of sections are inconsistently present, but when present show surface features with the same surface characteristics, (they are
located in the same approximate region and are of comparable size to each other). The sensitivity goes up from 0.63 to 0.68, and the positive predictive value from 0.58 to 0.65,
which is when compared to the high granularity grouping, proportional to the
corresponding decrease in false positive predictions. The observations for the NPV verses the specificity remained similar to the values of these indices with the high granularity
grouping.
An unfortunate side effect of decreasing the granularity is the complete misclassification of PC sections as PhMdAg sections or PE sections. The misclassification of many
different sections as PE sections is still prominent here as it was in the high granularity grouping.
Within Diagnostic Groups
The accuracy within the diagnostic divisions keeping the department constant
(Emergency Medicine) was much higher. The average sensitivity across the seven groups (Cardiology, Surgery, Respiratory, Neurology, Medicine, Gastroenterology and Mixed Medical Specialties) ranged from 0.63 to 0.86, and the specificity from 0.79 to 0.93. The
PPV ranged from 0.70 to 0.85, closely mirroring the sensitivity, which indicates that both
the false positives and the false negatives were low. As observed for the undifferentiated grouping, there was a significantly higher NPV than sensitivity, consistently across the
sections with the same implication that the false positive rate is higher than the false negative rate for this group.
The LP section showed high variability from group to group, being completely
misclassified in the mixed medical specialties and in surgery where in both cases it was misclassified as PE. Only the PE section was consistently retrieved across the groups.
Cardiology
The high average indices are due in a large part to the more than 50 percent prevalence of PE sections and high accuracy in the HOPC section. The system performed very poorly in the PhMdAg, PFSO, LP, RS and PC sections, many of which are very useful, so the
average performance statistics are too optimistic for this group.
Surgery
When restricted to this grouping, the model still performed best with only two sections-the PE and sections-the PhMdAg sections. Since PE sections constituted 65 percent of sections-the
documents, this appeared to boost the overall performance on this set. The sensitivity was
relatively low for this group (0.67), suggesting a high false negative rate. The performance on the remaining sections was poor.
Respiratory
The PE, PFSO, LP and RS sections had significantly high specificity and sensitivity. The
remaining sections amounted to about 22 percent of the sections within this group, and did not yield good results.
Neurology
The successful sections were PhMdAg, PE and LP. For the PhMdAg section, the PPV
was significantly lower than the sensitivity, suggesting that the false positive rate is high. The RS, HOPC, PFSO and PC sections showed poor results.
Medicine
In this group, the PhMdAg, PE and HOPC were the highest scoring sections. The RS, PFSO and PC scored low.
Gastroenterology
The most successful sections were PhMdAg, PE, LP, and HOPC. The remaining sections
comprised 14 percent of the documentation and did not contribute much to the overall
Other Medical Specialties
The PE section and HOPC were the only sections identified with reasonable accuracy. As expected, because this grouping does not differentiate within diagnoses groups, the
performance here is lower than in the other sets.
Discharge Summary Documents
Entire Set
The sensitivity and PPV for the entire set were very low (0.49 and 0.49). The NPV and the specificity were low compared to the History and Physical Examination documents.
The sections with a good sensitivity and specificity were DP, H and HC. L, DD, PE, PH, A, M and SPF sections had poor sensitivities ranging from zero to 0.52 but high
specificities from 0.93 to 0.97.
The most consistently identified section was the H section. L, HC and DP sections were also obtained with high accuracy. The DD section was frequently misclassified as DP.
The misclassification of DP as DD also occurred significantly, although not as frequently. Unlike in the History and Physical Examination documents, the PE section could only be successfully extracted half the time.
The overall performance of these groups did not differ much from the undifferentiated group of Discharge Summary documents above. The unexpected best performer was the
mixed group of Other Medical Specialties which of the lot is expected to have the worst performance if the hypothesis is true that departmental practices cause variations on the form of documents.
In the General Medicine group, the HC section was always confused with the DP section. A large proportion of the DP sections were misclassified as PE. Most DD sections were classified as H sections. For the grouped medical specialty departments, there was a
consistent misclassification of HC as DP. For the most part, the other sections were
properly classified except when the testing sample size of sections in the group was small, when a tendency to misclassify as the more prevalent DP section was noted. The performance for the Obstetrics and Gynecology group was generally good.
Misclassifications there tended to be more frequently as DP or DD, which is acceptable. In the surgical group, confusion between DP and DD was also prominent. Many of the other sections were confused as DD or DP. PE, L and PH were often mislabeled as H
sections.
General Medicine
The overall performance for this group was lower than that for the entire group. The sensitivity was only 0.29 and the PPV was 0.41, with a high false negative rate. The two
sections with high sensitivity and specificity pairs were the PE and SPF sections.
However, these had very low PPV values of about 10 percent. Hence, the method has not worked for any sections in this group.
Surgery
The H and DP section had high specificity and sensitivity. Both had low PPV values of around 0.5 but were still good enough for use. These two groups accounted for around
half of the sections available.
Obstetrics and Gynecology
The average sensitivity and specificity were similar to the whole group, but three sections
provided useful results-DD, HC and PE. DD had a relatively low PPV, because of a high
false positive rate.
Other Medical Specialty Departments
The sections that were predicted well for this group included L, DP and DD. The DP section had a low PPV of around 0.5.
4.5 Evaluation of the Type 2 Method
History and Physical Examination Documents
High Granularity Grouping
The sections with high c-indices were PC, HOPC, PH and PE. The sections M, A, PerH,
P and RS had moderately high c-indices. It did not perform well on L, S, O and F
sections. The calibration scores were excellent, indicating that the tool was definitely sensitive to the nature of the sections.
With this group, there was a tendency to classify the same section as different types of sections when each of those are looked for. No sections were identified as a particular
label exclusively. There was a tendency for a large proportion of PC sections to be classified as PH, A, PerH and O sections. HOPC sections were equally likely to be picked
up as PerH or O and to a lesser extent as M sections. PH sections were mistaken as A, PerH, PC and O sections. PE sections were often identified as OH. LP sections were
consistently misclassified as PerH. The worst selectivity was for F, S and PerH. Almost all sections ran a high risk of being identified as PerH sections.
Low Granularity Grouping
Compared to the high granularity grouping, the PE and HOPC sections remained at the
same accuracy. The c-index on the PC and RS sections dropped significantly. The PhMdAg, PFSO and LP sections improved in c-indices significantly. The calibration
indices were very good for this grouping.
Only HOPC and PE sections had a high PPV.
HOPC sections were consistently picked up as PC sections. However, the rest were often picked up as two or more other kinds of sections.
Within Diagnostic Sub Groups
The PPV was consistently high for PE and HOPC sections. The remaining sections showed variation in the PPV. Performance for the Obstetrics and
Gynecology group was good in this regard.
Cardiology
In this grouping, the tool performed well on all sections except on the PFSO section and with excellent calibration indices throughout.
Gastroenterology
In this group, the performance across all sections was excellent. However, the calibration indices for all except the PE section were unsatisfactory, possibly due to the small
number of document samples available.
General Medicine
In this grouping, the performances were excellent in both discrimination and calibration
except for the RS section. Here, discrimination ability was non-existent (c-index was only 0.52), but the calibration was outstanding. This can only mean that as far as this section is
concerned, there is too much variability even though the input variables are sensitive to the section type.
Surgery
The discrimination indices were good, but the poor calibration was probably due to the
low number of cases. The only section in which the discrimination was poor was the PFSO history section.
Neurology
In this group, the discrimination performance across all section types was impressive
except for the PFSO section, where both discrimination and calibration were not
satisfactory.
Mixed Medical Specialties
For this grouping, the RS section showed poor discrimination even though the calibration
was satisfactory. The remaining sections were satisfactorily identified.
Discharge Summary Documents
Entire set
The discrimination across the entire set was very satisfactory. The c-indices ranged from
0.75 to 0.96. Except for the H section, where the calibration was poor, the remaining ones showed excellent calibration.
However, there was a strong tendency to mislabel sections across all section types. Consequently, the positive predictive value of HC was the only sufficiently high one.
Department groupings
When grouped by department types, the Discharge Summary documents had better results. Unfortunately, the false positive rate remained high.
Surgery
For the sections H, PH, HC, DP, PE, the discrimination indices were excellent. However,
the calibration indices for DP were not satisfactory. The performance on DD and L sections were poor.
The sections with high PPV were H, PH, HC and PE sections.
General Medicine
The discrimination statistics for the H, PH, SPF, L, HC, PE and A sections were
satisfactory. However, the calibration statistics for HC were poor. The method failed to be useful on the sections DD and DP.
Obstetrics and Gynecology
The sections L, HC, PE and A had excellent discrimination and calibration indices. The sections H, DD and DP had good discrimination indices but poor calibration indices. The
performance was poor on PH sections.
HC was the only section with a high PPV value.
Grouped Medicine Specialties
The discrimination statistics across all sections were excellent. The calibration for H, DP
and DD were low.