Publisher’s version / Version de l'éditeur:
International Association of Scientific Hydrology, 61, pp. 82-91, 1963-11
READ THESE TERMS AND CONDITIONS CAREFULLY BEFORE USING THIS WEBSITE. https://nrc-publications.canada.ca/eng/copyright
Vous avez des questions? Nous pouvons vous aider. Pour communiquer directement avec un auteur, consultez la
première page de la revue dans laquelle son article a été publié afin de trouver ses coordonnées. Si vous n’arrivez pas à les repérer, communiquez avec nous à PublicationsArchive-ArchivesPublications@nrc-cnrc.gc.ca.
Questions? Contact the NRC Publications Archive team at
PublicationsArchive-ArchivesPublications@nrc-cnrc.gc.ca. If you wish to email the authors directly, please see the first page of the publication for their contact information.
NRC Publications Archive
Archives des publications du CNRC
This publication could be one of several versions: author’s original, accepted manuscript or the publisher’s version. / La version de cette publication peut être l’une des suivantes : la version prépublication de l’auteur, la version acceptée du manuscrit ou la version de l’éditeur.
Access and use of this website and the material on it are subject to the Terms and Conditions set forth at
Influence of the snow cover on the average annual ground temperature
at Ottawa, Canada
Gold, L. W.
https://publications-cnrc.canada.ca/fra/droits
L’accès à ce site Web et l’utilisation de son contenu sont assujettis aux conditions présentées dans le site LISEZ CES CONDITIONS ATTENTIVEMENT AVANT D’UTILISER CE SITE WEB.
NRC Publications Record / Notice d'Archives des publications de CNRC:
https://nrc-publications.canada.ca/eng/view/object/?id=33c175d5-384e-4dfd-8129-26479e157ab5
https://publications-cnrc.canada.ca/fra/voir/objet/?id=33c175d5-384e-4dfd-8129-26479e157ab5
d
S e r
TH1
N21r2
no. 203
c
.
2
2
,, V > ~ Z ~ # V - ~ Y
ANALYZED
r n G
NATIONAL
RESEARCH
COUNCIL
CANADA
DIVISION O F BUILDING RESEARCH
INFLUENCE OF THE SNOW COVER ON THE
AVERAGE ANNUAL GROUND TEMPERATURE AT
L.
W. GOLDR E P R I N T E D FROM
INTERNATIONAL ASSOCIATION O F SCIENTIFIC HYDROLOGY PUBLICATION N O . 61, P. 82
-
9 1 R E S E A R C H P A P E R N O . 2 0 3 O F T H EDIVISION O F BUILDING R E S E A R C H
OTTAWA
NOVEMBER
1963 N R C 7505 P R I C E 2 5 C E N T ST h i s publication i s being d i s t r i b u t e d by the Division of Building R e s e a r c h of the National R e s e a r c h Council. It should not be reproduced in whole o r in p a r t , without p e r m i s - sion of t h e o r i g i n a l p u b l i s h e r . The Division would be glad to be of a s s i s t a n c e in obtaining such p e r m i s s i o n .
Publications of the Division of Building R e s e a r c h may be obtained by mailing the appropriate r e m i t t a n c e , ( a Bank, E x p r e s s , o r P o s t Office M ~ n e y O r d e r o r a cheque m a d e pay- able a t p a r in Ottawa, to the R e c e i v e r General of Canada, c r e d i t National R e s e a r c h Council) to the National R e s e a r c h Council, Ottawa. Stamps a r e not acceptable.
A coupon s y s t e m has been introduced to m a k e pay- ments for publications r e l a t i v e l y s i m p l e . C3upons a r e avail- able in denominations of 5, 2 5 and 50 c e n t s , and m a y be ob- tained by making a r e m i t t a n c e a s indicated above. These coupons m a y be used for the p u r c h a s e of a l l National R e s e a r c h Council publications including specifications of the Canadian Government Specifications Board.
Extract oj' p~rblictrtion no. 6 1 of the I.A.S. H . Corwnission qf S I I O V I J ntld Ire, pp. 81-91
INFLUENCE OF THE SNOW COVER
O N THE AVERAGE ANNUAL GROUND TEMPERATURE
AT OTTAWA, CANADA
L.W. GOLD(*)
National Research Council, Canada, Division of Building Research
Observations were made on the mean daily air temperature and on soil temper- ature a t depths 5 and 10 cm below the surface during the period 23 December 1956 to 31 October 1962. Average annual temperatures were calculated for the observation levels at intervals of one-seventh of a year. The average annual air temperature was observed to vary between 4.90 and 7.37OC; the average annual 10-cm soil temperature between 7.86 and 9.000C; and the difference between them between 1.27 and 3.25 C degrees. The analysis indicated that the silow cover was the principal reason for the difference between average ann~lal air and soil temperatures a t the Ottawa site. T h e partitioning of surface heat between convection and evaporation or evapotranspir- ation, and the variation with time of the surface heat transfer coefficients probably contributed between 0 and 1 C degree to the difference.
R ~ S U M B
Des observations ont Bte faites sur la temperature journalikre moyenne de I'air et sur la tempCrat~~re du sol a des profondeurs de 5 et 10 cm sous la s~lrface durant la periode allant du 23 decembre 1956 au 3 1 octobre 1962. Les temperatures annuelles moyennes ont etB calculees pour les niveaux d'observation h des intervalles d'un septikme d'annie. On a constate que la temperature moyenne annucllc de I'air varie entre 4.90 et 7.37OC; que la temperature moyenne annuelle du sol a 10 cm varie entre 7.86 et 9.00°C et que la difference entre elles varie entre 1.27 et 3.25oC. L'analyse a montre que la couvcrture de ncige a ete la principale raison de la diference existant entre les temperatures moyennes annuclles de I'air et du sol i la station d'ottawa. Le cloisonnement de la chaleur de surface entre la convection et I'evaporation o u l'evapotranspiration ct la variation selon le tcmps des coefficients de transfert de la chaleur de surface ont probablement ajoute jusqu'h 1°C h la difference.
At the General Assembly of the International Union of Geodesy and Geophysics held in Toronto in 1958, information was presented on the influence of snow cover on heat flow from the g r o ~ ~ n d at a n a t ~ ~ r a l grass-covered site a t Ottawa(1) (latitude 45024'N, longitude 75043'W). At the same site, continuous measurements were made, as well, of ground temperature from the surface to depths of about 600 cm. Some of these observations have been reported by Pearce(3. In 1959 observations on heat flow and ground temperature were combined to determine the thermal properties of the soil(3). During the winter of 1958-59 the heat meters became inoperative a n d were not replaced, but the observations on ground temperature were continued. These have now been analysed. Attention has been given to the difference that exists at Ottawa between the average annual air and ground temperatures, and to possible factors that could be responsible for this difference. This paper presents the conclusions related to this part of the analysis.
DESCRIPTION OF THE OBSERVATIONS A N D THEIR ANALYSIS
In this report on factors affecting the average annual ground temperature, only those temperatures measured 5 and 10 cm below the surface will bc presented. Temp-
(*) Head, Snow and Ice Section, Division of Building Research, National Re- search Council, Ottawa, Canada.
eratilres were measured with thermocouples installed in a sensitive marine-deposited clay, at least 10 metres deep, overlying limestone formations. T h e average thermal properties of this clay for depths greater than 25 cm from the surface a r e given in Reference (13). Observations s h o w that the upper 20 t o 25 CIII of t h e soil, the zone
containing t h e root systems of the grass, has a thermal cond~ictivity a b o u t one half to one third that of the clay below. T h e surface cover in summer is a natural grass that was allowed to grow to a height of between 15 a n d 20 cm before cutting.
Air temperatures were measured in a Stevenson screen with a ventilated thermo- couple mounted about 1.20 m above the ground surface. Snow cover depth was observed a t stakes located near the ground temperature installation. G r o u n d ternpe- ratures were recorded three times per hour. It was observed that a t 5 a n d 10 crn t h e average daily temperature,
T(l,
was approximately e q u a l to the mean o f t h e daily maximum a n d minimum. A study of t h e shielded air temperature also showed t h a t t h e daily average coitld bc assumed equal to t h e mean of t h e daily m a x i n l t ~ m and minimum.T h e tenlperati~re records for o n e ycar were divided into seven consecutive periods containing 50 days each; records for 15 days distributed uniformly throughout the year (i.e. spaced a t about 24-day intervals) were rejected. T h e average temperature
Ti
for a period is given byFor the period of observation, 23 December 1956, t o 3 1 October 1962, 35 sets of these 50-day averages were obtained. T h e average annual ground temperature was calcul- ated from t h e 50-day averages a t intervals of one-seventh of a year. T h e observations on air temperatitre were analysed itsing t h e samc teclinique.
Figure 1 shows t h e time dependence of t h e annual average air temperature and ground tenlperature a t a depth of 10 cm. It may be seen that not only is t h e r e a differ- ence between these two temperatures a t any given time, but the temperatures and t h e difference betwecn them change with time, t h e difference varying from a b o u t 1.25 to 3.25 C degrees.
When considering this figure, t h e implication of a cliange in t h e average annual temperature should b e kept in mind. Consider t h e first point plotted 30 April 1957. This point is obtained from
Y = t h e average annual temperature.
T h e next observation point, Yz, plotted o n 23 J u n e is given by
That is, the change in the average annual temperature is equal to one seventh t h e difference between the average temperature for one period and t h e same period o n e year earlier. From figure 1 it may be seen that the greatest observed change between adjacent average annual temperatures a t the 10 cm level was 0.44 C degrees, occurring in 1959. This reflects a change of 3.08 C degrees between the average temperature for the period 20 July to 9 September 1959, and 20 July to 9 September 1958.
AVERAGE A N N U A L GROUND TEMPERATURE
W b
'
AT 10 CM DEPTHAVERAGE A N N U A L AIR TEMPERATURE
T I M E
Fig. 1 - Dependence on time of the average annual shielded air temperature a n d ground temperature at the 10 cnl depth.
Although the curves given in figure 1 arc instructive, the reasons for the difference between average annual air and ground temperature can be more readily demonstrated with the 50-day average tenlperatures. Whcn comparing temperatures measured a t two different levels, account must be taken of the time difference that exists between corresponding events. Inspection of the observations showed that the air temperature is almost in phase with the 10-cnl ground temperature. N o serious error is introduced if corresponding 50-day average air and ground temperatures are compared w ~ t h o u t correcting for the small time lag of the ground temperature relative to the air temper- ature.
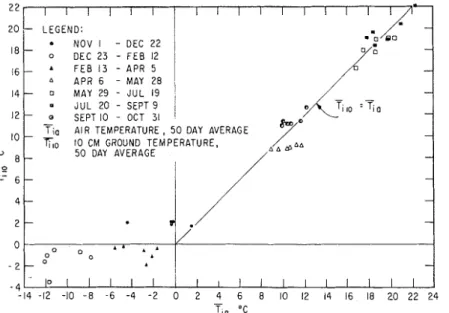
Corresponding pairs of the observed 50-day averages are plotted in figure 2. For the snow-free period ( A p r ~ l to November) it may be seen that each 50-day average air te~nperature is about equal to the corresponding 50-day average temperature a t the 10-cm level. This equality is quite striking during the summer period, 29 May t o 9 September, where the good correlation between the two temperatures is clearly evident. T h e 10-cm ground temperature tends to be a little cooler than the air temper- ature during the spring period 5 April to 9 May, and a little warmer during the fall period, 10 September to 31 October, as would be expected.
In winter, the 50-day average 10-cm ground temperature was normally relatively constant and confined to the temperature range 0 to -Z0C, whereas the average air
2 2 - [ I 1 1 1 , 2 0 - LEGEND: NOV l - DEC 22 - 0 DEC 23 - F E E 12 16 -
'
FEE 13 - APR 5 APR 6 - MAY 28 14-
0 MAY 29 - JUL 19 / JUL 20 - S E P T 91
12 - - 0 SEPT 10 - OCT 31'
T i a AIR TEMPERATURE , 5 0 DAY AVERAGE
lo -
Tlo
I 0 CM GROUND TEMPERATURE, -U 0 8 - 5 0 DAY AVERAGE 0
-
I+- 6 - - 4-
- 2 - - 0 - o 0 0 1' A' - 2 - O 0 -Fig. 2 - Correlation between corresponding pairs of 50-day average air a n d 10-cm ground temperature.
temperatLlrc was a s low as - 12OC. As may be seen in figure 3, where the approxinlate
average s ~ i o w depth and the deviation of each 50-day average from t h e average of the
3 2 I p 0 w - l w 4 u - 2 W - 3 r r - 4 U 0 u x- LL I 0 0 Z 5' 5 0
%
k- 4 - Oz
G R O U N D TEMPERATURE AT 10 C M DEPTH Z2
3 V) n 2 I 0 - I -2Fig. 3 - T i m e dependence of deviation of 50-day average air a n d 10-cni ground temperature from 6-year avcrage.
six scts obtained for each period is plotted against time, t h e lower values for tlie 50-day average ground temperatures in t h e winter a r e associated with shallower t h a n average snow covers. T h e temperature in t h e upper 10 crn of t h e soil was observed to be m u c h more constant during t h e period of snow cover t h a n it was at o t h e r times of t h e year, demonstrating t h e effectiveness of snow in reducing t h e influence of day to day fluc- tuations in t h e average daily air temperature. Because t h e temperature in t h e frozen soil is quite constant once t h e snow depth exceeds a b o u t 25 cm, it is not considered t h a t latent heat effects associated with t h e soil water a r e a contributing factor to t h e difference between t h e average annual air a n d ground tempcratures at the Ottawa site.
In figure 3 qualitative correlation between deviations from average for t h e g r o u n d temperature, deviations from average for t h e air temperature a n d depth of snow cover a r e apparent. F o r example, the negative deviation in the average 10-cm g r o u n d temperature in t h e winter of 1956-57 is associated with a negative deviation in t h e average air temperature, combined with a shallower t h a n n o r m a l snow cover. F o r winters of average o r deeper t h a n average snow cover tlie average ground tcmperature deviation is about t h e same and does not fluctuate much during t h e winter. T h e largest deviations from average conditions a t t h e 10-crn depth occur i n the summer.
T h e combination of variation in snow cover depth and average air temperature has produced a variation i n t h e ground temperature deviations with a period of a b o u t 2 years. It is this fluctuation t h a t is associated with t h e well defined fluctuation in t h e average annual ground temperature shown in figure 1 . This fluctuation ill t h e average annual ground temperature propagated d o w n into t h e soil a n d even a t a depth OF 610 c ~ i i had a n amplitude of a little over 0.10 C degrees. T h e observed dependence on depth of t h e amplitude and phase of this disturbance was consistent with t h e r m a l diffusion theory.
T h e temperature of t h e ground surface a n d its variation with time is determined by t h e heat balance established a t t h e surfacc. I n a givcn pcriod OF time, t h e difference between t h e net radiation a n d t h e ground h e a t flux must be dissipated by convection a n d evaporation o r evapotranspiration. A nct daily convective heat loss normally implies t h a t t h e average daily surface t e ~ n p c r a t u r e is greater t h a n the average daily air temperature, although a diurnal variation in t h c convective (and evaporative) heat transfer coefficients may havc t o be taken into account (larger during t h e d a y t h a n a t night). It would be expected t h a t t h e greater t h e a m o u n t of heat t h a t ~ i i u s t b e dissipated o r received by t h e surfacc by co~ivection, t h e larger t h e difference between t h e average air a n d surface tempcratures.
A difference between t h e average air and surface temperatures could induce a difference between t h e average annual air a n d ground temperatures. T o check t h i s possibility, some observations were made from which conclusions could b e d r a w n regarding t h e probable average difference bctwcen t h c air a n d surface t e r n p e r a t ~ ~ r e s in summer and in winter a t t h e Ottawa site. These observations a r e presented in t h e following two sections.
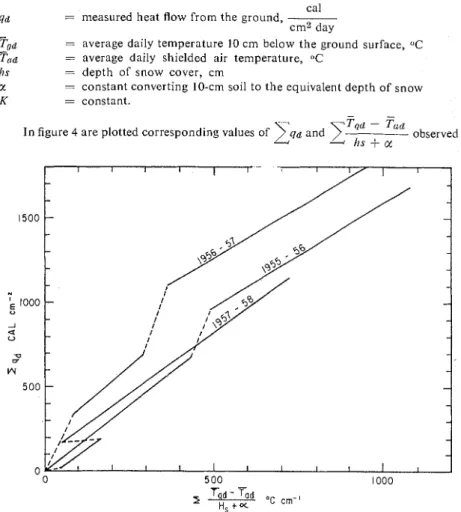
Observations made earlier a t Ottawa(l) showed t h a t t h e accumulated heat flow from t h e ground was related to t h e 10-cm ground temperature, theshielded air tempe- rature and t h e snow depth, according t o t h e following expression
where
cal
Ljrd = measured heat flow f r o m the ground, ----
c m 2 day
-
T,d
-
= average daily temperature 10 c m below t h e ground surface, OCT11d = average daily shielded air temperature, OC /IS = d e p t h of snow cover, cm
CI. = constant converting 10-cm soil t o t h e equivalent depth of snow
K = constant.
-
T 4 d - F u d
I n figure 4 a r e plotted corresponding values of x q d and
7---
observed4 h s f
a
Fig. 4 - Dependence of heat flow f r o m ground o n the temperature gradient through t h e snow cover.
during t h e winters 1955-56, 1956-57 a n d 1957-58. T h e dashed sections a r e associated with periods of melting snow o r of n o snow cover. T h e average value for K from t h e
cal
three winters of observations is 34.5
.
T h e average density of t h e snow cover crn OC d a ywas above 0.25 gm/cm3. Snow of this density has a thermal conductivity between cal
26.5 and 36.5
---.
cm OC day (4)
T h e reasonable agreement between t h e observed value for K a n d reported values for t h e thermal conductivity of s n o w indicates that t h e average snow surface temper- ature must b e almost equal t o t h e average air temperature. Measurements with a 30-gauge, butt-welded copper-constantan thermocouple during thirty-nine 24-hour periods in February and March, 1961, support this conclusion. It was observed that t h e average daily snow surface temperature was 0.84 C degrees lower t h a n t h e average
daily shielded air temperature. T h e difference between t h e average air and snow surface temperatures may b e a little greater than this because of errors in temperature measure- ment d u e t o solar radiation.
T h e snow cover during t h e winter of 1960-61 was quite shallow. It would b e expec- ted t h a t increasing t h e d e p t h of the snow w o ~ ~ l d cause t h e difference betwecn t h e average snow surface a n d air tenlperatures t o increase. It is concluded, therefore, t h a t on t h e average t h e daily snow surface temperature a t t h e site is probably 0.5 t o
1.0 C degrees colder t h a n t h e daily air temperature.
If t h e temperature,
Fred
in equation (1) is a d j ~ ~ s t e d by this amount, t h e value obtained for K would be about 10 per cent lower and thus in better agreement with reported values for t h e thermal conductivity of snow.SOIL S U R F A C E TEMPERATURE
T h e soil s ~ ~ r f a c e t e m p e r a t ~ ~ r e a t t h e Ottawa site d ~ ~ r i n g the s u m m e r was estimated by extrapolating t o zero depth the 50-day average t e m p e r a t ~ ~ r e s measured a t 5 a n d 10 cm. It was found t h a t t h e average soil s ~ ~ r f a c e temperature was between I a n d 3 0 C higher t h a n t h e average air temperature during t h e period 6 April t o 9 September. T h i s was confirmed by direct observation with a t h e r n ~ o c o u p l e placed a t t h e base of t h e grass stems. T h c average difference between average daily air and average daily soil s u r f x e temperature observed during a 15-day period in July 1958 w a s found t o b e 2.5oC, a n d d ~ ~ r i n g a corresponding period in July 1959 it was 1.3"C. T h e average difference observed for 7-day periods from May, J ~ l n e , July a n d August 1959 was 1.1 0C. Combining t h e average differences obtained by direct observation and by extrapolation of t h e 10- a n d 5-cm 50-day average ground temperatures indi- cates t h a t t h e soil surface during summer is o n t h e average between 1 and 2 C degrees warmer t h a n t h e air.
T h e normal rainfall a t Ottawa during t h e 4-month period from May t o A L I ~ L I S ~ is about 32 cni. Beginning in May, evapotranspiration exceeds rainfall and t h e soil moisture is gradually depleted. During a n extended dry period, particularly in t h e months of A L I ~ L I S ~ and September, t h e soil water content may b e reduced to t h e level where wilting of grass occurs. About t h e e n d of September t h e soil water content begins t o increase. T h e observed temperature differences a r c therefore probably representative of a situation where t h e availability of soil moisture for evapotrans- piration is li~niteci only during extended dry periods.
Figure 5 shows qualitatively t h e observed time dependence of t h e alr and g r o u n d thermal regime a t t h e Ottawa site. T h c surface temperature, although 1 t o 2 C dcgrees warmer in summer a n d 0.5 t o 1 C degrees colder in winter, m u s t have almost t h e same time dependence a s t h e average shielded air temperature. Thus t h e division of s ~ ~ r f a c e heat between convection and evaporation or evapotranspiration ant1 t h e time variation in t h e surface heat transfer coefficients a r e probably responsible f o r between 0 a n d 1 C degree of the observed difference between t h e average a n n u a l air a n d ground temperatures. T h e remainder o f t h e difference is probably d u e to t h e snow cover.
Snow cover h a s a two-fold influence : it interposes a medium of lower conduc- tivity between t h e air a n d t h e soil, a n d it increases t h e effective depth of t h e g r o u n d temperature measuring sites below t h e surface. This results, a s c a n be seen in figure 5, in reducing t h e amplitude o f t h e annual temperature wave in winter and effectively raising t h e average annual ground temperature. Because t h e ground temperature
Fig. I I I , I , I I I I I [ , I I I I I I 0 SOlL SURFACE AVERAGE SNOW I - AT TIME OF M I N I M U M -
-
2 - - - 3 AVERAGE ANNUAL ENVELOPE OF ANNUAL 4 GROUND TEMPERATURE WAVE 5 - 6 --
7-
I I I I I I I I I I -14 -12 -10 - 8 - 6 -4 - 2 0 2 4 6 8 10 12 14 16 18 2 0 2 2 24 26 TEMPERATURE O C5 - Qualitative representation of annual variation in alr and g r o u n d temper- atures.
wave near t h e surface is flattcr in winter t h a n in summer, t h e average a n n u a l ground temperature lies t o the cold side of t h e mean of t h c sunlmer maximum a n d the winter
minimum. As the higher harmonics of thc tempcraturc wave are damped out \\gith depth below the surface, the average annual ground tempcrature becomes more nearly e q ~ ~ a l to the mean of the summer maximum and winter minimum.
Various analytical techniques have been published for estimating the influence of the snow cover on the ground t c m p e r a t ~ ~ r e ( ~ , " . These techniques son~etin~es suffer from the fault that they are difficult to apply. An estimate of the minimum ground surface temperature that is satisfactory for many problems can be obtained from equation (1) and an estimate of the rate of heat loss from the soil. T h e maximum rate
ca 1 ca 1
of heat loss from soils in winter is usually between 20 to 30 --
.
Using 20-
cm2 day c m q a y
as a first approximation, and ther~noconductivity corresponding to the average density of the snow cover, the approximate temperature of the snow-soil interface a t the time of minimunl air temperature can be calculated. Using this temperature (Tmi,) and the average air temperature at the time of the summer maximum (Tina,)*, a check can be made of the assumed maximum heat loss from the soil using the first Fourier component approximation of this quantity :
where
( 1 ) = 212 radians per year
Co = volumetric heat capacity of soil
2.
-
thermal diffusivity of soil.The maximum heat flow rate obtained with equation (2) can then be used to obtain a n cstimate for Trnlll that will probably be adequate for most field calculations. If the snow cover is quite deep (greater than about 40 cm) and the average air tempera- ture a t the time of the winter minimum is between -10 and -15OC, the ground surface temperature will be close to O°C. For example, a t Glacier, British Columbia, the avcrage air temperature a t the timc of the winter minimum is about -1O')C. When the snow depth exceeds about 60 cm the ground surface temperature remains constant a t 0°C. These figures are valid for the Ottawa site as well. From a knowledge of T,,,, and T,,i,, the averagc annual ground temperature can be estimated, kecping in mind that it probably lies on the cold side of the mean of these two temperatures,
Observations havc been made over the past six years a t a natural grass-covered site a t Ottawa, Canada, on the ground temperatures at the 5- and 10-cm depth and on the shielded air temperature 120 cm above t h e ground surface. T h e average annual air and ground temperatures and the difference between them was found to change with time. The average annual 10-cm ground temperature was observed to vary between 7.86 and 9.00L'C, the average annual air temperature between 4.90 and 7 . 3 7 C and the diffcrence between them from 1.27 to 3.25 C degrees. During thc sum-
(*) The nature of the surface and the amount of rainfall may make it necessary to adjust the average air temperature at the time of sunlmer maximum in order to get a more accurate estimate of the average soil surface temperature.
tner the average g r o ~ ~ n d surface temperature followed closely the average air temper- ature and was between I to 2 C degrees warmer. T h e average snow surface temper- ature also followed the average air temperature closely and was between 0 to I C degrees colder.
Thesnow cover has the effect of adding to the soil surface in winter a layer whose depth varies with time and whose thermal cortductivity is u s ~ ~ a l l y lower than that of the soil. This layer increases t h e effective depth below the surface of t h e locations where the ground temperature is measured. T h e result is to decrease t h e amplitude of the wintertime ground temperature change and thus increase t h e average annual ground temperature.
T h e snow cover was primarily responsible for t h e fact that the average soil surface temperature in winter was about 5.70 to 11.20 C degrees warmer than t h e average air temperature. It is concluded that the snow cover is the principal reason why the average annual ground temperature at the Ottawa site is between 1.25 and 3.25 C degrees warmer than the average annual air temperature. The division of surface heat between convection and evaporation or evapotranspiration, and t h e variation of the surface heat transfer coefficients with time, contribute between 0 and 1 C degrees to this diference. T h e most important factors causing the average a n n ~ ~ a l ground temperature to vary with time are variations from year to year in t h e depth of the snow cover and in the average air temperature a t t h e time of summer maximum.
T h e author wishes to express his appreclatlon to Messrs. Jean L e Tourneau, Richard Ducharme, Peter Reynolds, Richard Armour and John Booth for their assistance a t v a r i o ~ ~ s periods in making and analys~ng t h e observations. H e is indebted as well to Dr. D. Stephenson and Mr. G.P. Mitalas for their assistance in processing the observations with a computer.
This paper is a contribution from the Div~sion of Building Research, National Research C o ~ ~ n c i l , and is published with the approval of the Director of t h e Division
REFERENCES
(1) GOLD, L.W. Influence of snow cover on heat flow from the g r o ~ ~ n d - s o m e observations made in the Ottawa area. Association Internationale d'tiydrologie Scizntifiq~~e, Union Geodesique et G e o p h y s i q ~ ~ e Internationale, Assertrblie Gtrrc;rcrle rle Torollto 1957, G e n t b r ~ ~ g g e 1958, T o m e IV, p. 13-21.
(9
PEARCE, D.C. Ground temperature studies at Saskatoon and Ottawa, Canada. Association Internationale d'Hydrologie Scientifique, Union Geodesique et G e o p h y s i q ~ ~ e Internationale, As.sernblie G i r r i m l e rle T u r u ~ r t o 1957, Gentbrugge 1958, T o m e IV, p. 279-290.(3) PEARCE, D. C. and G O L D , L. W . Observatio~ls of ground t e m p e r a t ~ ~ r e and heat flow at Ottawa, Canada. Jorrr. of Geopl~ysicnl Res., Vol. 64, No. 9, p. 1293-
1798 1959
- -
*-
, *-
*.
(9
Review of properties of snow and ice. U.S. Corps of Engineers, Cold Regions Research and Engineering Laboratories, SIPRE Report No. 4, Hanover, New Hampshire, U.S. A. July 1951.(") LACHENBRUCH, A.H. Periodic heat flow in a stratified medium with application to permafrost problems. Geog. Srrru. BirII. 1083-A, U.S. Gov't Printing Office, Washington 25, D.C., 1959.