HAL Id: hal-02393052
https://hal.archives-ouvertes.fr/hal-02393052
Submitted on 4 Dec 2019HAL is a multi-disciplinary open access
archive for the deposit and dissemination of sci-entific research documents, whether they are pub-lished or not. The documents may come from teaching and research institutions in France or abroad, or from public or private research centers.
L’archive ouverte pluridisciplinaire HAL, est destinée au dépôt et à la diffusion de documents scientifiques de niveau recherche, publiés ou non, émanant des établissements d’enseignement et de recherche français ou étrangers, des laboratoires publics ou privés.
Multi-color solar absorption as a synergetic UV
up-conversion enhancement mechanism in LiYF 4 :Yb
3+ ,Tm 3+ nanocrystals
Bhagyesh Purohit, Yannick Guyot, David Amans, Marie-France Joubert,
Benoit Mahler, Shashank Mishra, Stéphane Daniele, Christophe Dujardin,
Gilles Ledoux
To cite this version:
Bhagyesh Purohit, Yannick Guyot, David Amans, Marie-France Joubert, Benoit Mahler, et al.. Multi-color solar absorption as a synergetic UV up-conversion enhancement mechanism in LiYF 4 :Yb 3+ ,Tm 3+ nanocrystals. ACS photonics, American Chemical Society„ 2019, 6 (12), pp.3126-3131. �10.1021/acsphotonics.9b01151�. �hal-02393052�
Multi-color solar absorption as a synergetic UV
up-conversion enhancement mechanism in
LiYF
4
:Yb
3+
,Tm
3+
nanocrystals
Bhagyesh Purohit,
†,‡Yannick Guyot,
†David Amans,
†Marie-France Joubert,
†Benoit Mahler,
†Shashank Mishra,
‡Stephane Daniele,
‡,¶Christophe Dujardin,
†and Gilles Ledoux
∗,††Univ Lyon, Universit´e Claude Bernard Lyon 1, CNRS, Institut Lumi`ere Mati`ere, F-69622, LYON, France
‡Univ Lyon, Universit´e Claude Bernard Lyon 1, CNRS, Institut de Recherches sur l’Environnement et la Catalyse de Lyon, F-69622, LYON, France
¶Present address: C2P2-UMR 5265, ESCPE-Lyon, BP 2077, 69616 Villeurbanne cedex, France
E-mail: gilles.ledoux@univ-lyon1.fr Phone: +33 (0)4 72 44 83 38
Abstract
Motivated by the technologically important spectral conversion of sunlight for ef-ficient photocatalysis, we present a detailed analysis of the multi-color excitation of LiYF4:Yb3+,Tm3+ nanocrystals leading to UV emission through upconversion. We
demonstrate in particular that the combination of blue and IR light for generating upconversion UV emission is a linear mechanism that occurs at rather low density of excitation (a few mW/cm2). This up-conversion efficiency is fully compatible with
the broad band excitation from the sun, with comparable density similar to daylight excitation. It demonstrates that an appropriate design combining photocatalyst and dedicated up-converter leads to a drastic improvement of the photocatalytic effect.
Keywords
upconversion, photocatalysis, LiYF4, YLiF4 thulium, ytterbium
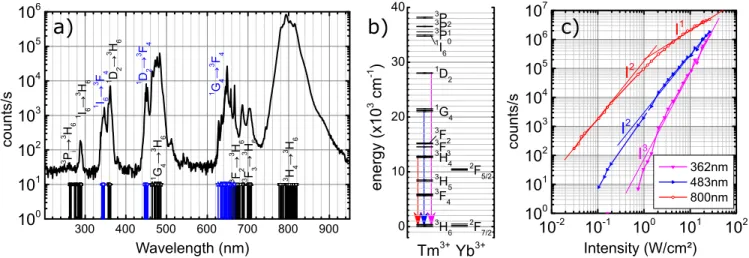
300 400 500 600 700 800 900 100 101 102 103 104 105 106 3 P i → 3 H 6 1G 4 → 3F 4 1 I6 → 3 F 4 3F 2 → 3H 6 3H 4 → 3H 6 3 F 3 → 3 H 6 1 D 2 → 3 F 4 1 G 4 → 3 H 6 1 D 2 → 3 H 6 counts/s Wavelength (nm) 1 I6 → 3 H 6
a)
10-2 10-1 100 101 102 100 101 102 103 104 105 106 107 I1 362nm 483nm 800nm I3 I2 I2 counts/s Intensity (W/cm²)c)
b)
0 10 20 30 40 3 H6 3F 4 3 H5 3 H4 3F 3 3F 2 1G 4 1 D2 1 I6 3 P0 3P 1 3 P2 2 F7/2 2 F5/2 Yb3+ energ y (x10 3 cm -1 ) Tm3+Figure 1: (a) Upconversion spectra of 20% Yb and 0.5% Tm co-doped LiYF4 nanocrystals
under a 973 nm excitation wavelength with an intensity of 4.32 W/cm2. The black lines
show the emission transitions going down to the ground level of Tm3+ (3H6) while the blue
lines represent the transitions going down to the first excited multiplet of Tm3+ (3F
4). (b)
energy levels of Thullium and Ytterbium ions in LiYF4 according respectively to Dulick et
al1 and to Bensalah et al.2 The arrows indicate the three transitions presented in panel (c) with the same color code. (c) luminescence intensity variations of the principal emission components with respect to the excitation intensity of the IR laser.
Up-conversion phosphors emit higher energy photons than those absorbed. This effect is efficient in rare earth doped materials under mild irradiation conditions from mW/cm2 to hundreds of W/cm2. The phenomena was discovered in the late 50’s by Bloembergen3 and just a few years later Auzel showed that it could be combined with energy transfer in order to improve its efficiency.4,5 This additional process, called APTE (Addition de photons par
transfert d’´energie) or ETU (Energy Transfer Upconversion), was thus naturally envisioned to convert the inefficient infrared part of the solar spectrum into photons efficiently absorbed
by solar cells (see6,7 and references therein).
Solar driven photocatalysis is a steadily growing market that reached 2 billions $ in 2014.8 Most of the applications are based on titania but other inorganic (ZnO, CeO
2, ... ),
metal complexes (tetrabutylammonium decatungstate, chromium carbenes, ...) or organic compounds (acetone, ...) are also used.8 A common trend of this photocatalysts is that
they are efficient mainly under UV excitation. Therefore only a very small amount of solar spectrum photons are useful. For instance only 1.5% of solar spectrum photons are exploited in the case of titania. Using upconversion materials to convert many more solar spectrum photons into useful ones could greatly enhance the production rate, provided that they demonstrate the ability to produce UV photons. Considering the non-linearity of this effect, up-conversion enhanced photocatalysis has only been demonstrated with a relatively high excitation provided by an infrared laser.9–15 Nevertheless, we demonstrated previously that
up-converting NaGdF4:Yb3+,Tm3+ nanocrystals can also enhance photocatalysis under solar
irradiation.16 This last result was counter-intuitive if one considers that the addition of the energy of at least 3 photons in the IR are required to obtain one excitation in the UV. In this paper we aim to demonstrate that the IR → UV conversion process under broadband excitation is not a third order process, with respect to the infrared at low power density excitation. Under broad band excitation, a subtle intermix of energy transfer and excited state absorption using the blue part of the solar spectrum converts it to a first order mechanism, entirely compatible with natural light excitation.
The LiYF4:Yb3+,Tm3+system is reported to be one of the most efficient ones for the
gen-eration of UV photons by upconversion.17Here we have synthesized it by the thermal decom-position method using anhydrous metal trifluoroacetate derivatives [Ln(TFA)3(DME)] (Ln =
Y, Tm, Yb) and Li(TFA)(DME) (where TFA = trifluoroacetate, and DME = dimethoxyethane) as molecular precursors (the detailled protocol is given in the supplementary information). The absence of water molecules during synthesis avoids the risk of the formation of ox-ofluoride phases and produces high quality nanocrystals (NCs) with enhanced upconversion
intensity. Water molecules are a well-known luminescence quencher,18 and the synthesis of
NCs with water free surfaces is mandatory. The formation of a pure phase, well-crystallized and monodisperse LiYF4: 20% Yb3+, 0.5% Tm3+ (measured at 19±1% Yb and 0.6±0.5%
by EDS ) NCs was confirmed by powder XRD, EDS, TEM and high resolution TEM studies (see supporting information).
The samples are placed on a heating/cooling stage DSC600 from Linkam corporation equipped with a sapphire window. They are therefore maintained at 25◦C at all time. A first laser with continuous wave (CW) excitation at 973 nm and with a power of 2 W is focused to a square spot of 1×1 mm2 on the sample with a quasi top-hat energy distribution. Its power
can be varied thanks to a set of neutral density filters allowing a variation of the intensity from 200 W/cm2 down to 8.4 µW/cm2. A second laser, an Optical Parametric Oscillator
(OPO) from EKSPLA (model NT230-50-SH) with a fixed repetition rate of 50 Hz and a pulse width of 3 ns, is also shone on the sample. Its emission wavelength can be tuned from 211 nm up to 2.5 µm. The spot size is 5 mm diameter on the sample with a Gaussian intensity distribution. The two lasers are collinear at the sample surface. Therefore in the central 1x1 mm2 square spot both laser excitation are almost homogeneous (meaning less than 10%
variation over the central 1×1 mm2 area for both lasers). The light emitted from this central
spot is collected by an optical fiber placed as close as possible to the sample and fed to a monochromator from Jobin-Yvon (TRIAX 320) equipped with automatic order removing filters and coupled to an EMCCD (Newton 920U from Andor) or a cooled photomultiplier (Hamamatsu R943-02). The signal from the photomultiplier is sent to a SR400 counting module from Stanford Research Systems. A simple LED (M455L1 from Thorlabs) can be focused on the sample over a surface of 0.6 cm2, as an alternative to the OPO laser source
excitation. The wavelength of the peak intensity of the LED has been measured to be 460nm with a FWHM of 30 nm. Its intensity can be varied continuously from 0 to 15 mW/cm2. The
emission can also be excited thanks to a Xe laser driven light source EQ99 from Energetiq together with a YG12 colored long pass filter (see figure 7 of the supplementary information)
to mimic a solar irradiation without its UV component. 800 1000 1200 1400 1600 1800 2000 0 1000 2000 3000 4000 5000 6000 7000 2F 7/2 2F 5/2 3H 6 3F 4 3H 5 3H 4 3F 3 3F 2 counts/s wavelength (nm) (OPO+CW)-CW emission excitation 0 5 10 15 energ y (x10 3 cm -1) 1000 excitation CW alone OPO alone emission
Figure 2: Upper panel: In blue excitation (right) and emission (left) of the 3H4→3H6
tran-sition of Tm3+ ions in LiYF
4 nanocrystals at 805 nm with the OPO laser alone. In red,
excitation (right) and emission (left) of the same transition with the CW laser alone. Lower panel: for the same transition in black excitation spectra under a combined excitation of a CW laser at 973 nm with an intensity of 13 mW/cm2 and a variable wavelength OPO pulsed
laser after subtraction of the IR laser contribution. On the left, in green, the corresponding emission spectra with the OPO centered at 1210 nm.
Figure 1a shows, in a semi-log scale, a characteristic upconversion emission spectrum of LiYF4 nanoparticles with a doping concentration measured by EDS of 19±1% Yb3+ and
0.6±0.5% Tm3+ ions under a moderate density of excitation (4.32 W/cm2 at 973 nm). The
different emission lines can be easily ascribed to the f − f intraconfigurational transitions of Thulium as reported by Dulick and collaborators1 and for which the energy level
dia-gram is presented in figure 1b. The spectrum is dominated by the emission around 800 nm coming from the 3H4 →3H6 transition from Tm3+ ions. At shorter wavelength, the blue
emission around 480 nm arises mainly from 1G4 →3H6 and the UV region is dominated by
the 1D
2 →3H6 transition at 360 nm. The intensity of upconversion has been compared to
that of a single crystal of similar composition (see figure 3 of the supplementary informa-tion). The overall intensity of the nanoparticles under the same excitation intensity and the same collection geometry corresponds to 78% of the one measured on the single crystal. Up-conversion photoluminescence Quantum yield (UC-QY) and Energy Up-conversion efficiencies
(ECE) have also been measured and are reported in table 1 of the supplementary informa-tion. While smaller (by a factor of ∼2) than the one reported by19 our nanoparticles are
about ten times smaller than theirs. Because of the larger surface to volume ratio in our case, It suggests that our particles have only a small quenching at the surface, while they are well crystallized and exempt of volume defects.
These processes are non linear, figure 1c presents the evolution of luminescence intensity of the three main emissions as a function of the excitation source intensity. From a few tens of mW/cm2 up to 30 W/cm2, the blue emission shows an almost quadratic behavior, the UV emission depends on the third power of the excitation density while the 800 nm emission is quadratic up to about 1 W/cm2 and becomes linear afterwards.
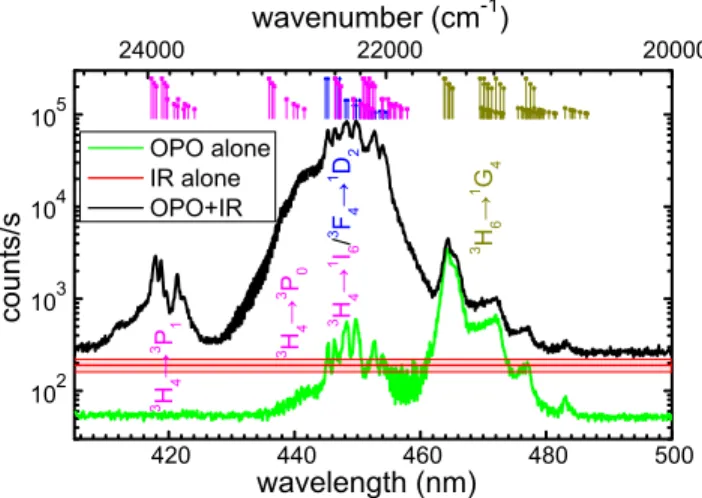
420 440 460 480 500 102 103 104 105 3 H 6 → 1 G 4 3 H 4 → 1 I6 / 3 F 4 → 1 D 2 3 H 4 → 3 P 1 counts/s wavelength (nm) OPO alone IR alone OPO+IR 3 H 4 → 3 P 0 24000 22000 20000 wavenumber (cm-1)
Figure 3: Excitation spectra of the 1D
2→3H6 transition of Tm3+ ions in LiYF4:Yb,Tm
nanocrystals. The black curve corresponds to the dual excitation with a CW IR laser at 973 nm and the OPO laser of varying wavelength. The green curve corresponds to the excitation spectrum using only the OPO laser source. The red curve corresponds to the average emission intensity when using only the IR excitation (the clear red band being the ±2σ intensity fluctuation over time). In the upper part the different possible transitions for Thulium ions1 are plotted with their intensities normalized to their expected relative
population from the starting levels according to a simple Boltzmann distribution at room temperature. The colors of the transition being the text tag colors of the bottom figure.
The full description of the up-conversion process in co-doped Thulium-Ytterbium systems is still a matter of debate and essentially two different scenarios have been considered, both using Yb3+ for each excitation step: either a sequential transfer or a cooperative sensitization
by several Yb3+ ions. In the first hypothesis20,21 an Yb3+ ion transfers its excitation to a
Tm3+ into its 3H
5 and/or 3F4 level. Then a second transfer promotes Tm3+ in a higher
excited state (3F
2 or even 1G4) and the process is repeated as long as the excited Yb3+ ions
can transfer some excitation. In the second hypothesis,22,23 two excited Yb3+ ions which are
sufficiently close to a single Tm3+ ion, transfer simultaneously by cooperative sensitization
their excitation to the Tm3+ ion promoting it directly to its 1G4 excited state. Then some
additional excitation from another excited Yb3+ ion brings the Tm3+ to a higher excited state.
In order to provide a deeper insight into these two potential processes, we have performed excited state excitation spectroscopy. A CW IR laser at low enough excitation density (13 mW/cm2) is used to populate the excited state of the Yb3+ ions without any detectable
up-conversion emission. Under this excitation, we expect to have a significant amount of Yb3+ ions in the excited state (∼2.2×1015 cm−3) at all time and a small amount of Tm3+ in the lower lying excited states (3F4 and 3H5) excited through energy transfer from Yb3+ 2F
5/2 at all time. Thus, when the Tm3+ are brought to one of the 3F4 or 3H5 excited state
by a second tunable laser, through energy transfer, the excited Tm3+ ions can be brought to
higher excited states if the correct conditions exist. The3H
4→3H6 upconversion emission at
800 nm is thus monitored as a function of the wavelength of the tunable excitation laser. As can be seen in figure 2, the 800 nm emission is hardly detected when the 2 lasers are used as separate excitation source, while a series of peak clearly appear around 1680 nm and 1210 nm when the two lasers are used simultaneously. These two excitation lines perfectly match the
3H
6 →3F4 and 3H6 →3H5 transitions respectively. It indicates that when the 3F4 level is
populated, since the3F
4to3F2 energy difference is almost resonant with the Ytterbium2F5/2
to2F
7/2 energy difference , it is an extremely efficient means of obtaining the emission from
the 3H
4 level. To confirm this hypothesis, lifetimes in the excited state have been performed
with either a single excitation of Yb3+ or a double excitation with a CW laser at 973nm
and a pulsed laser tuned at 1210nm corresponding to the 3H
presented in figure 4 of the supplementary information and it confirms the process described above.
A similar study has been performed on the 1G
4→3H6 emission of Tm3+ and the results
are presented in figure 5 of the supplementary information. The main result is that the most efficient way to excite this level is by cooperative sensitization. Indeed the sequential excitation would involve a transition from3H5 to1G4 levels of Tm3+, which is most unlikely
since its energy correspond to 125% of the2F5/
2→ 2F 7/ 2 transition in Yb 3+. 320 330 340 350 360 370 380 390 10 100 1000 counts/s wavelength (nm) LED alone (9mW/cm²) sun-like source IR IR+LED IR (mW/cm²) 2640 250 15
}
340 360 380 0 10 20 30 40 50Figure 4: Emission spectra of Tm3+ ions in LiYF
4:Yb,Tm nanocrystals under dual excitation
(red lines) of a SCW IR laser at 973 nm and the LED or by the LED alone (blue stars) or the IR laser alone (black lines) . The brown stars correspond to an excitation with a sun-like excitation (lamp +filter). The inset is a close-up in linear scale of the weaker spectra. The noise of the detector is around 3 counts/s.
More interesting is the study of the 1D
2 to 3H6 transition around 360 nm. As shown in
figure 6 of the supplementary information, increasing the IR laser excitation density up to 100 mW/cm2 results in weak emission from the3H
4 and the1G4, and undetectable from1D2.
When excited at about 450 nm with a pulsed laser fluence of 50 mJ/cm2, this emission cannot be detected either. When the lasers are combined, a strong synergetic effect is demonstrated with an increase by more than 2 orders of magnitude of the 1D2 →3H6 emission at 360 nm.
The excitation spectrum of this phenomenon is presented in figure 3 where the different transitions can be clearly assigned. It demonstrates that excited state absorption from the
3F
leading to a drastic increase of the emission of the 1D
2 level when the IR source helps to
populate the3F
4 level thanks to an energy transfer from the Yb3+ 2F5/
2 level. On the other
hand, there is no effect on the 1D
2 emission with the addition of the IR source when the
OPO source leads to a population of the 1G
4 level (direct excitation from the 3H6). This
means that an energy transfer from the Yb3+ 2F
5/
2 level is not efficient for populating the
1D
2 level from the1G4 level. These results allow us to state that the most efficient processes
leading to the excitation of the1D2 by classical upconversion are the sequential mechanisms
involving a first step that populates the 3F4 level and then a second step of cooperative
sensitization from two excited Yb3+ ions to generate a 1D
2 excited Tm3+ ion. This result is
consistent with the calculations of Carnall et al.24 who showed that the3F
4→1D2 transition
is hypersensitive (∆J=2) and its squared U(2) matrix element is 0.5689, therefore one of the strongest absorption of the Tm3+ions. Again lifetime in the excited state has been measured
under single or dual excitation and the results are presented in figure 7 of the supplementary information. As before this confirms the above described process with the appearance of a single monoexponential decay for the 1D2→3H6 emission once the second laser is present
corresponding only to the lifetime of the 1D
2 level.
These results were obtained with relatively high excitation densities far from day light excitation. It allows an understanding of the different steps that can take place in the upconversion phenomena and for us to sort out which wavelength domains play a role in a broadband excitation scheme. However, by our own admission, it is far from real life applications like a solar photocatalysis plant. In the following section, we aim to demonstrate that this process still occurs under continuous moderate sunlight-type excitation conditions. The OPO laser is replaced by the standard LED as described before, that has its maximum in the range of the 3F
4→1D2 excitation. Figure 4 presents spectra in the range of the
1D
2 →3H6 emission under separate and simultaneous blue and IR excitations highlighting
the same synergetic phenomena. These excitations correspond to a typical sun irradiance on the earth for these two ranges of wavelengths as described by the standard AM1.5.25 As
can be seen in this figure as soon as the IR intensity is decreased below a few W/cm2 no
UV light can be detected if no blue excitation is present. On the contrary, if the blue LED is turned on with rather low excitation intensities (9mW/cm2) UV emission can be detected
even for very low intensities of the IR laser.
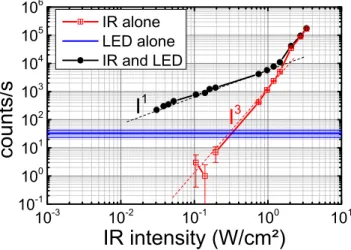
10-3 10-2 10-1 100 101 10-1 100 101 102 103 104 105 106
counts/s
IR intensity (W/cm²)
IR alone LED alone IR and LEDI
3I
1Figure 5: total emission in the range 360-370 nm Tm3+ ions in LiYF4:Yb,Tm nanocrystals
under dual excitation (black line) of a CW IR laser at 973 nm and a LED centered at 460 nm. Excitation of the CW IR laser (red) alone or the LED alone (blue line together with its ±2σ variation) as a function of the IR intensity. The LED is kept at 3 mW/cm2. The dashed lines are guide for the eyes showing a variation following a linear relation with intensity (black) or following a power law with a factor of 3 (red).
In order to demonstrate the impact of the discussed mechanisms on the change of power law regime for the 1D2 emission, we compared the UV intensity as a function of the IR laser
intensity with or without the blue LED (3 mW/cm2). The results presented in Figure 5
with IR excitation alone follow a third order dependence as expected and already presented. When the LED is turned on, the power law shape is radically modified and becomes linear up to 1 W/cm2 indicating that the IR excitation switches from a three photon to a single IR
photon process. As described above, by energy transfer, the IR absorption of a single photon in Yb3+ allows the excitation of the3F4 of Tm3+, and the blue excitation promotes Tm3+ to
the1D2 state. At higher excitation density, the third order process is, as expected, dominant.
Similarly, when varying the power of the LED while keeping the IR laser power constant, a linear behavior is observed as evidenced in figure 8 of the supplementary information. It
demonstrates that the overall mechanism involves 1 photon in the blue and 1 photon in the IR, which satisfies the energy conservation law to obtain UV light at 360 nm.
As a last demonstration, we simulated a solar illumination using a filtered Xe lamp with a spectrum shown in figure 9 of the supplementary information. UV emission under such excitation is presented in figure 4 as brown stars compared to the IR excitation through up-conversion mechanisms or with the combination of LED and IR laser. A clear band is obtained at 360 nm and the band is slightly broader because the system resolution in this case was 2.5 nm instead of 1 nm.
This excitation, similar to the sun, is able to promote high energy excitations in Yb3+,Tm3+
co-doped LiYF4. It would enable the generation, by energy transfer, of electron-hole pairs
compatible with standard photocatalysts. Combining up-converter and photocatalyst, a sig-nificant part of the solar spectrum that is unused can stimulate photocatalysis, which, after optimization and use of efficient energy transfer ions26–28 has the potential to improve the overall photocatalysis efficiency by a factor of 3 as we have shown in a previous work.16 Such an approach would allow a significant decrease in the time of reaction that currently take between hours and weeks in solar photocatalysis plants8 and could also allow the use
of photocatalysts that have been discarded since they need photons with an energy that is too high.
This exciting result comes from the simple addition of the energy of an IR and a visible photon, thus reducing the non-linearity of the UV upconversion phenomena, which in part originates from the idea behind Auzel’s original publication in 1966 to make a ”quantum counter by energy transfer from Yb3+ to Tm3+”.5
Acknowledgement
The authors acknowledge the funding from Agence Nationale de la Recherche through the grant number ANR-17-CE09-0002.
References
(1) Dulick, M.; Faulkner, G.; Cockroft, N.; Nguyen, D. Spectroscopy and dynamics of upconversion in Tm3+: YLiF
4. Journal of Luminescence 1991, 48-49, 517–521.
(2) Bensalah, A.; Guyot, Y.; Ito, M.; Brenier, A.; Sato, H.; Fukuda, T.; Boulon, G. Growth of Yb3+-doped YLiF4 laser crystal by the Czochralski method. Attempt of Yb3+ energy
level assignment and estimation of the laser potentiality. Optical Materials 2004, 26, 375–383.
(3) Bloembergen, N. Solid state infrared quantum counters. Physical Review Letters 1959, 2, 84.
(4) Auzel, F. Compteur quantique par transfert d’´energie entre deux ions de terres rares dans un tungstate mixte et dans un verre. Comptes rendus de l’acad´emie des sciences de Paris 1966, 262, 1016.
(5) Auzel, F. Compteur quantique par transfert d’´energie de Yb3+ `a Tm3+ dans un tungstate mixte et dans un verre germanate. Comptes rendus de l’acad´emie des sci-ences de Paris 1966, 263, 819.
(6) van Sark, W. G.; de Wild, J.; Rath, J. K.; Meijerink, A.; Schropp, R. E. Upconversion in solar cells. Nanoscale research letters 2013, 8, 81.
(7) Yang, W.; Li, X.; Chi, D.; Zhang, H.; Liu, X. Lanthanide-doped upconversion materials: emerging applications for photovoltaics and photocatalysis. Nanotechnology 2014, 25, 482001.
(8) Spasiano, D.; Marotta, R.; Malato, S.; Fernandez-Iba˜nez, P.; Di Somma, I. Solar photo-catalysis: Materials, reactors, some commercial, and pre-industrialized applications. A comprehensive approach. Applied Catalysis B: Environmental 2015, 170-171, 90–123.
(9) Tang, Y.; Di, W.; Zhai, X.; Yang, R.; Qin, W. NIR-Responsive Photocatalytic Activity and Mechanism of NaYF4 :Yb,Tm@TiO2 Core–Shell Nanoparticles. ACS Catalysis 2013, 3, 405–412.
(10) Zhang, Y.; Hong, Z. Synthesis of lanthanide-doped NaYF4@TiO2 core–shell compos-ites with highly crystalline and tunable TiO2 shells under mild conditions and their upconversion-based photocatalysis. Nanoscale 2013, 5, 8930.
(11) Wang, W.; Ding, M.; Lu, C.; Ni, Y.; Xu, Z. A study on upconversion UV-vis-NIR responsive photocatalytic activity and mechanisms of hexagonal phase NaYF4:Yb3+,Tm3+@TiO2 core-shell structured photocatalyst. Applied Catalysis B: Environmental 2014, 144, 379–385.
(12) Wang, W.; Li, Y.; Kang, Z.; Wang, F.; Yu, J. C. A NIR-driven photocatalyst based on α-NaYF4 :Yb,Tm@TiO2 core–shell structure supported on reduced graphene oxide. Applied Catalysis B: Environmental 2016, 182, 184–192.
(13) Ullah, S.; Hazra, C.; Ferreira-Neto, E. P.; Silva, T. C.; Rodrigues-Filho, U. P.; Ribeiro, S. J. L. Microwave-assisted synthesis of NaYF 4:Yb3+/Tm3+ upconver-sion particles with tailored morphology and phase for the design of UV/NIR-active NaYF4:Yb3+/Tm 3+@TiO2 core@shell photocatalysts. CrystEngComm 2017, 19, 3465–3475.
(14) Su, W.; Zheng, M.; Li, L.; Wang, K.; Qiao, R.; Zhong, Y.; Hu, Y.; Li, Z. Directly coat TiO 2 on hydrophobic NaYF4 :Yb,Tm nanoplates and regulate their photocatalytic activities with the core size. Journal of Materials Chemistry A 2014, 2, 13486.
(15) Yin, D.; Zhang, L.; Cao, X.; Tang, J.; Huang, W.; Han, Y.; Liu, Y.; Zhang, T.; Wu, M. Improving photocatalytic activity by combining upconversion nanocrystals and Mo-doping: a case study on β-NaLuF 4 :Gd,Yb,Tm@SiO 2 @TiO 2 :Mo. RSC Adv. 2015, 5, 87251–87258.
(16) Chen, Y.; Mishra, S.; Ledoux, G.; Jeanneau, E.; Daniel, M.; Zhang, J.; Daniele, S. Direct Synthesis of Hexagonal NaGdF 4 Nanocrystals from a Single-Source Precursor: Upconverting NaGdF 4 :Yb 3+ ,Tm 3+ and Its Composites with TiO 2 for Near-IR-Driven Photocatalysis. Chemistry - An Asian Journal 2014, 9, 2415–2421.
(17) Mahalingam, V.; Vetrone, F.; Naccache, R.; Speghini, A.; Capobianco, J. A. Colloidal Tm 3+ /Yb 3+ -Doped LiYF 4 Nanocrystals: Multiple Luminescence Spanning the UV to NIR Regions via Low-Energy Excitation. Advanced Materials 2009, 21, 4025–4028. (18) Rabouw, F. T.; Prins, P. T.; Villanueva-Delgado, P.; Castelijns, M.; Geitenbeek, R. G.; Meijerink, A. Quenching Pathways in NaYF 4 :Er3+ ,Yb 3+ Upconversion Nanocrys-tals. ACS Nano 2018, 12, 4812–4823.
(19) Meijer, M. S.; Rojas-Gutierrez, P. A.; Busko, D.; Howard, I. A.; Frenzel, F.; W¨urth, C.; Resch-Genger, U.; Richards, B. S.; Turshatov, A.; Capobianco, J. A.; Bonnet, S. Abso-lute upconversion quantum yields of blue-emitting LiYF 4 :Yb3+ ,Tm 3+ upconverting nanoparticles. Physical Chemistry Chemical Physics 2018, 20, 22556–22562.
(20) Guy, S.; Jurdyc, A.; Jacquier, B.; Meffre, W. Excited states Tm spectroscopy in ZBLAN glass for S-band amplifier. Optics Communications 2005, 250, 344–354.
(21) Peretti, R.; Jurdyc, A.-M.; Jacquier, B.; Gonnet, C.; Pastouret, A.; Cavani, O. How do traces of thulium explain photodarkening in Yb doped fibers? 2010, 6.
(22) Kn¨upfer, A.; Ostroumov, V.; Heumann, E.; Huber, G.; Lupei, V. Mechanisms of up-conversion excitation of blue emission in YAG:Tm, Yb. Le Journal de Physique IV 1994, 04, C4–501–C4–504.
(23) Mishra, S.; Ledoux, G.; Jeanneau, E.; Daniele, S.; Joubert, M.-F. Novel heterometal-organic complexes as first single source precursors for up-converting NaY(Ln)F 4 (Ln = Yb, Er, Tm) nanomaterials. Dalton Trans. 2012, 41, 1490–1502.
(24) Carnall, W. T.; Crosswhite, H.; Crosswhite, H. M. Energy level structure and transition probabilities in the spectra of the trivalent lanthanides in LaF3; 1978; pp ANL–78–XX–
95, 6417825.
(25) G173-03, A. Standard Tables for Reference Solar Spectral Irradiances: Direct Normal and Hemispherical on 37◦ Tilted Surface.
(26) Wang, F.; Deng, R.; Wang, J.; Wang, Q.; Han, Y.; Zhu, H.; Chen, X.; Liu, X. Tuning upconversion through energy migration in core–shell nanoparticles. Nature Materials 2011, 10, 968–973.
(27) Su, Q.; Han, S.; Xie, X.; Zhu, H.; Chen, H.; Chen, C.-K.; Liu, R.-S.; Chen, X.; Wang, F.; Liu, X. The Effect of Surface Coating on Energy Migration-Mediated Upconversion. Journal of the American Chemical Society 2012, 134, 20849–20857.
(28) Ledoux, G.; Amans, D.; Joubert, M.-F.; Mahler, B.; Mishra, S.; Daniele, S.; Du-jardin, C. Modeling Energy Migration for Upconversion Materials. The Journal of Physical Chemistry C 2018, 122, 888–893.
Supporting Information Available
• synthesis and characterization of the nanoparticles;
• upconversion of the nanocrystals compared to a single crystal; • upconversion quantum yield measurements and results;
• excitation in the excited state for the 1G
4→3H6 emission;
• lifetime in the excited state 3H
4→3H6;
• emission spectra of the 1D
• lifetime in the excited state 1D
2→3H6;
• power dependency of the 1D
2→3H6 with respect to visible diode intensity;
Graphical TOC Entry
340 360 380
wavelength (nm)
0 500 1000 1500 2000 2500 Wavelength (nm)
Multi-color solar UV up-conversion in nano LiYF4:Yb-Tm