HAL Id: hal-03183148
https://hal.archives-ouvertes.fr/hal-03183148
Submitted on 26 Mar 2021HAL is a multi-disciplinary open access archive for the deposit and dissemination of sci-entific research documents, whether they are pub-lished or not. The documents may come from teaching and research institutions in France or abroad, or from public or private research centers.
L’archive ouverte pluridisciplinaire HAL, est destinée au dépôt et à la diffusion de documents scientifiques de niveau recherche, publiés ou non, émanant des établissements d’enseignement et de recherche français ou étrangers, des laboratoires publics ou privés.
The heavy atom microwave structure of
2-methyltetrahydrofuran
Vinh Van, Wolfgang Stahl, Ha Vinh Lam Nguyen
To cite this version:
Vinh Van, Wolfgang Stahl, Ha Vinh Lam Nguyen. The heavy atom microwave structure of 2-methyltetrahydrofuran. Journal of Molecular Structure, Elsevier, 2016, 1123, pp.24-29. �10.1016/j.molstruc.2016.05.078�. �hal-03183148�
The Heavy Atom Microwave Structure of
2-Methyltetrahydrofuran
Vinh Vana, Wolfgang Stahla, and Ha Vinh Lam Nguyen*b
a Institute of Physical Chemistry, RWTH Aachen University, Landoltweg 2, D-52074 Aachen,
Germany
b Laboratoire Interuniversitaire des Systèmes Atmosphériques (LISA), CNRS UMR 7583, Université
Paris Est-Créteil, Université Paris Diderot, 61 avenue du Général de Gaulle, F-94010 Créteil cedex, France.
* Corresponding Author
Phone: +33 145 17 65 48; Email: [email protected]
ABSTRACT
The rotational spectra of 2-methyltetrahydrofuran have been observed using a pulsed molecular beam Fourier transform microwave spectrometer operating in the frequency range 2 26.5 GHz. Conformational analysis using quantum chemical calculations yields two stable conformers; both of them possess an envelope structure. The conformational transformation can occur via two different transition states. The Cremer-Pople notation for five-membered rings is chosen for describing the conformations. Only one conformer with equatorial position of the methyl group is assigned in the experimental spectrum. The fits of its parent species, 13C- and 18O-isotopologues result in highly
accurate molecular parameters, and enable the determination of a heavy atom rs structure using
Kraitchman’s equations. This experimentally determined structure is in excellent agreement with the structure calculated by anharmonic frequency calculations.
KEYWORDS: rotational spectroscopy, conformational analysis, isotopic substitution, structure determination, Kraitchman’s equations
1. INTRODUCTION
Rotational spectroscopy in the gas phase has increasingly been applied to determine the structure of medium-sized molecules, which often exhibit complex conformational landscapes.1-3 Since the traditional method by isotopic substitutions is not always possible, the support of quantum chemistry becomes a helpful tool, whereby ab initio structures can be taken as references for a comparison of the experimental and calculated molecular parameters. On the other hand, quantum chemical calculations at different levels of theory often differ in a wide range, whereas atomic positions determined by rotational spectroscopy are highly precise,4 in particular when using the molecular beam Fourier transform microwave (MB-FTMW) technique. With high sensitivity and excellent experimental accuracy, it is possible to observe singly substituted isotopologues such as 13C, 34S, 15N, and 18O in natural abundances. Comparisons of experimentally and computationally derived
molecular parameters can therefore validate the quality of various theoretical methods in characterizing the studied system.
In this paper, we will report on the heavy atom rs structure of 2-methyltetrahydrofuran (MTHF)
studied by MB-FTMW spectroscopy, and compare it with results from quantum chemistry. MTHF is a promising environmentally friendly solvent and biofuel component, which is derived from renewable resources. Following the principles of Green Chemistry, MTHF has been evaluated as an eco-friendly substance in various fields like organometallics,5 metathesis,6 and biosynthesis.7
The methyl group in MTHF exhibits internal rotation with a rather high barrier of 13.12 kJ∙mol−1 (i.e. 1097 cm−1) calculated at the CCSD(T)/6-311++G(d,p) level of theory. In the experimental spectrum, narrow torsional splittings only occur in a few transitions with high J values.
2. QUANTUM CHEMICAL CALCULATIONS 2.1. Geometry optimizations
Several starting geometries of MTHF were created based on the structures of two conformers of cyclopentane used as a prototype.8 Geometry optimizations were performed at the MP2/6-311++G(d,p) level of theory using the GAUSSIAN package.9 This level was chosen, since it yielded
rotational constants which were close to the experimental values for other heterocyclic molecules.10,11 We only considered the (S)-configuration, because enantiomers cannot be distinguished using our technique. The geometry optimizations signified two envelope conformers, called the equatorial and the axial conformer. Harmonic frequency calculations at the same level of theory were also carried out to decide, whether the optimized geometries are true minima or saddle points. Anharmonic frequency calculations resulted in the quartic centrifugal distortion constants (shown in Table 1) and the rotational constants B0 of the vibrational ground state.
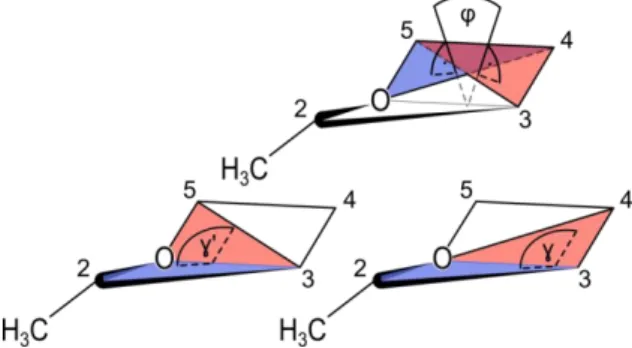
The envelope conformations can be described by the ring plane determined by the O, C3, C4, C5
atoms, and the envelope fold determined either by C2, O, C3, C4 or C2, C3, O, C5, as depicted in
Figure 2. The dihedral angle φ = ∠ (O, C5, C4, C3) of the ring plane is zero and both angles γ = ∠
(C2, O, C3, C4) and γ’ = ∠ (C2, C3, O, C5) of the envelope fold are equal, if the ring structure is not
distorted.
Similar to the case of methylcyclopentane, the equatorial orientation of the methyl group is lower in energy than the axial orientation due to steric effects, where the hydrogen atoms in the methyl group are closer to the hydrogen atoms of the ring. The equatorial conformer is illustrated in Figure 1; the Cartesian coordinates of both conformers are also available in Table S-1 in the Electronic Supporting
Information (ESI). The equatorial conformer was afterwards re-optimized at different levels of theory using the HF, DFT, MP2, and CCSD methods and various basis sets. The calculated rotational constants are listed in Table S-2 in the ESI. If not otherwise stated, all values given from now on will refer to the MP2/6-311++G(d,p) level of theory.
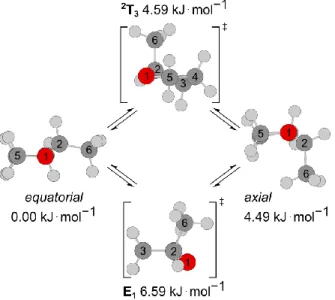
2.2. Transition states
Using the Berny algorithm,12 two transition states (called 2T3 and E1) were found. We notice that in
both 2T
3 and E1, the ring structure is slightly distorted. The transition state energies were obtained
from single-point calculations at the CCSD(T)/6-311++G(d,p) level of theory using the geometries optimized at the MP2/6-311++G(d,p) level. The envelope transition state E1 is 2.00 kJ∙mol−1 higher
in energy than the twist configuration 2T3. Their Cartesian coordinates are also available in Table
S-1. Figure 3 indicates the intramolecular conversion between the stable conformers via 2T3 and E1.
Since 2T
3 is only 0.10 kJ∙mol−1 higher in energy than the axial conformer, the barrier to convert the
axial conformer in the equatorial conformer via 2T3 is very small.
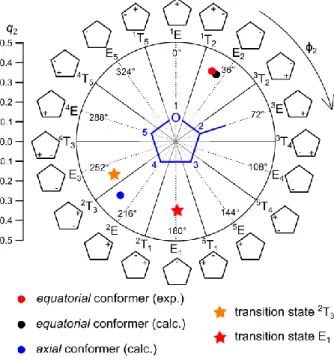
2.3. Cremer-Pople puckering parameters
The Cremer-Pople puckering parameters13 for both conformers and the transition states are calculated using the program RING14 to characterize the ring geometries in more detail. The conformational space for a five-membered ring has two dimensions characterized by the puckering amplitude q2 and the angle phase ϕ2.13 The orientation of the methyl group as a ring substituent is
described by the angle α between the mean plane of the puckered ring and the bond of the methyl group.15 Figure 4 illustrates possible conformations based on the model of Altona and Sundaralingam.16 The calculated as well as the experimental geometry of the equatorial conformer has an envelope structure E2 with significant distribution of the twist structure 1T2, and the methyl
substituent in equatorial orientation with q2 = 0.39, ϕ2 = 32.4°, and α = 67.7° as well as q2 = 0.40, ϕ2
2E and the twist structure 2T
3 and has the methyl substituent in axial orientation with q2 = 0.38, ϕ2 =
226.6°, and α = 10.1°. The axial orientation is higher in energy than the equatorial orientation due to steric effects. The lower energy transition state 2T3 has a more pronounced twist structure with q2 =
0.38, ϕ2 = 242.4°, and α = 13.1°, whereas the transition state E1 has an envelope structure with q2 =
0.36, ϕ2 = 179.5°, and α = 17.1°. In both of them, the methyl group is in axial orientation.
3. MICROWAVE SPECTROSCOPY 3.1. Measurements
MTHF was purchased from Alfa Aesar GmbH & Co. KG, Karlsruhe, Germany with a stated purity of 99 % and stabilized with approximately 150-400 ppm BHT (butylated hydroxytoluene). Additional purification was not necessary, since the vapor pressure of BHT is too low for an observation in the gas phase under the same conditions. The rotational spectra were measured with a MB-FTMW spectrometer operating in the frequency range 2 26.5 GHz. A detailed description is given in Refs. 17 and 18. A gas mixture of 1% substance in helium at a total pressure of 60 to 110 kPa was expanded through the nozzle into the cavity.
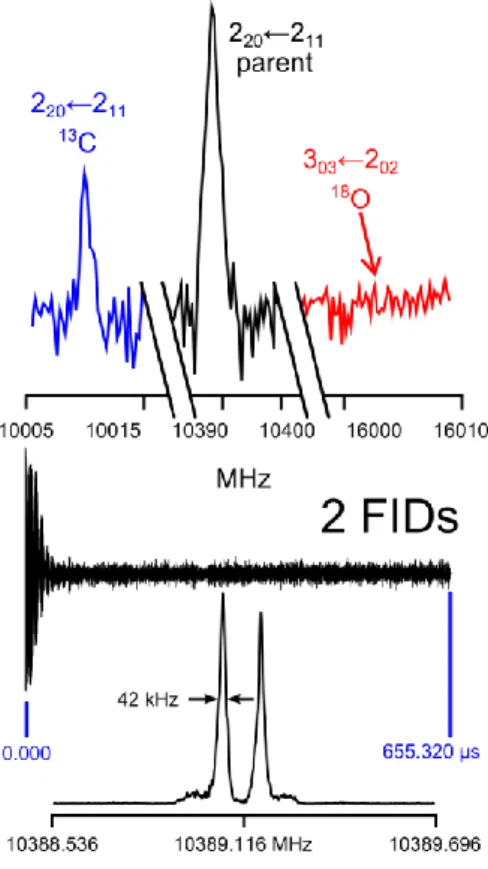
A broadband scan from 8.8 to 12.4 GHz was recorded, which consists of automatically taken overlapping spectra with 50 co-added decays per each at a step width of 0.25 MHz. The scan indicates positions of the rotational transitions, which were remeasured afterwards at higher resolution. The typical line widths are 10 40 kHz; the measurement accuracy of isolated lines is approximately 2 kHz. Figure 5 illustrates some sections of a typical broadband scan and a high resolution spectrum.
3.2. Spectral assignment
We do not expect to observe the axial conformer in the spectrum because (i) there is an energy difference of 4.59 kJ∙mol−1 between the two stable conformers of MTHF (calculated at the CCSD(T)/6-311++G(d,p) level of theory). The axial conformer is thus too high in energy to be
observed under molecular beam conditions, where the rotational temperature is very low (about 2 K) and (ii) the intramolecular conversion from the axial conformer to the equatorial conformer has a very low barrier of only 0.10 kJ∙mol−1 (see section 2.2).
After assigning the equatorial conformer, all attempts to assign the axial conformer failed. Therefore, we believe that (i) in the supersonic expansion only the equatorial conformer exists due to collisional conformational relaxation and (ii) the remaining lines with much weaker intensity belong to vibrationally excited states occurring from ring puckering effects. Only the assignment procedure of the equatorial conformer is thus given here.
3.2.1. Parent species
The calculated dipole moment components were |µa| = 0.69 D, |µb| = 1.60 D, and |µc| = 0.62 D.
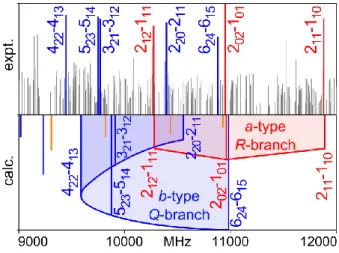
Correspondingly, we expected strong b-type and medium intense a- and c-type transitions. Nevertheless, we still began with searching for a-type transitions due to their characteristic pattern, which could be often assigned readily in the spectrum. At a rotational temperature of about 2 K of the molecular beam, transitions with low J and K values are often of highest intensity. Therefore, we started our assignment with the a-type R-branch transitions 212 ← 111, 202 ← 101, and 211 ← 110.
They were indeed three of the most intense lines in the broadband scan as can be recognized in Figure 6. The assignment of these lines fixed the B and C rotational constants. To determine the A rotational constant, the b-type Q-branch transitions 220 ← 211, 321 ← 312, 422 ← 413, and 523 ← 514
were taken into account (also given in Figure 6). Afterwards, further lines up to J = 15 (including c-type transitions) could be assigned and fitted. The molecular parameters were fitted using the XIAM program19 and summarized in Table 1; the frequency list is available in Table S-3 in the ESI.
3.2.2. 13C-isotopologues
After the most intense transitions were assigned to the equatorial conformer, a large number of lines with low to medium intensities remained in the scan. We assumed that these transitions belong to the
13C-isotopologues of MTHF in their natural abundances of 1 %.
By changing the mass of a 12C atom to that of the 13C atom, the rotational constants of the respective
13C isotopologue could be obtained. We used the same transitions as mentioned in section 3.2.1 for
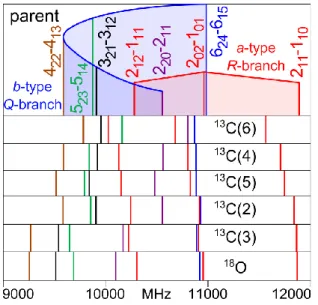
the assignment process. Since the line density was quite high, we wrote a script which automatically generates XIAM inputs and fits to simplify the assignment. The calculated frequencies were close to those of the respective transitions of the main isotopologue, as can be recognized in Figure 7. The calculated and experimental a-type R-branch frequencies differed by less than 10 MHz, whereas the
b-type Q-branch is shifted by approximately 160 MHz in the spectra of all isotopologues.
For all 13C-isotopologue, the rotational constants and four quartic centrifugal distortion constants
could be determined with high accuracy, as summarized in Table 2; the frequency lists are also given in Table S-3.
3.2.3. 18O-isotopologue
The natural abundance of the 18O-isotopologue is 0.2 %. Its rotational transitions, therefore, did not appear in the scan like those of the 13C-isotopologues. Figure 5 visualizes the relative intensity of the
parent species, 13C-, and 18O-isotopologues in the broadband scan. Whereas the b-type transitions mentioned in section 3.2.1 were discarded here, the same a-type R-branch transitions 212 ← 111, 202
← 101, and 211 ← 110 as well as three other a-type lines 313 ← 212, 303 ← 202, and 312 ← 211 were
searched, since a-type transition frequencies could, in general, be much better predicted.
Scans of ±5 MHz around the predicted frequencies with overlapping spectra of 750 co-added decays
per each and a step width of 0.2 MHz were performed. In total, 14 transitions could be found and fitted. The quartic centrifugal distortion constants ∆J and ∆K were well determined, whereas the δJ
and δK were fixed. The frequency list for the 18O-isotopologue is also given in Table S-3, the fitted
molecular parameters in Table 2.
3.3. Internal rotation
The methyl group in MTHF undergoes internal rotation and causes A-E splittings of all rotational lines.20 The barrier to internal rotation is calculated using various method-basis set combinations, as given in Table S-2. The CCSD(T)/6-311++G(d,p) level of theory yields a barrier of 13.12 kJ∙mol−1 (1097 cm−1), which is rather high. The splittings, if resolvable, are expected to be very small, in the order of a few tens of kHz. In the experimental spectrum, only a few transitions at high J values show A-E splittings. A typical spectrum with observable splitting is given in Figure S-F1 in the SI. We tried to fit the torsional splittings of 23 rotational transitions. Nevertheless, due to the small splittings, we did not obtain a reasonable fit. Furthermore, very small splittings often appear larger after Fourier transformation. The barrier to internal rotation was not well determined, and the standard deviation was four times larger than the measurement accuracy. Therefore, we completely neglected the effect of internal rotation in MTHF.
It should be noted that the A-E splittings are larger for excited torsional states, and the barrier to internal rotation could be much better determined if transitions from the excited torsional states were included. Unfortunately, these states are not observable in a supersonic jet.
4. DISCUSSION 4.1. Results of the fits
For the equatorial conformer, the rigid rotor fit including 111 rotational transitions has a standard deviation of 2.2 kHz, which is within the measurement accuracy. However, four sextic centrifugal distortion constants are needed to achieve this fit quality, while only transitions with J ≤ 15 are included. Omitting these constants increases the standard deviation to 3.6 kHz, as shown in Fit II in Table S-4 in the ESI. By taking into account only transitions with J ≤ 6, the standard deviation
decreases to 1.4 kHz (Fit III, also in Table S-4). As mentioned in section 3.3, the internal rotation of the methyl group causes splittings of about 20 kHz for some high J transitions. In such cases, we neglect the E component and only include the A component in the fit. This approximate treatment partly explains the increase of the standard deviation of the fit, when transitions with J > 6 are considered. It might also be the reason that some sextic centrifugal distortion constants improve the fit. The quartic centrifugal distortion constants are in a normal order of magnitude for molecules with comparable rotational constants, and there is no indication for an unusual floppiness of the molecule. The constants obtained from anharmonic frequency calculations are close to the experimental values for J, J, and K. The deviations for JK, K, and all sextic centrifugal distortion constants are
remarkable, probably due to the effects of small vibration rotation interactions which have been taken into account in the calculations for these constants.
The experimentally deduced rotational constants are compared with those from quantum chemical calculations and listed in Table S-2 in the ESI. Because the experimental constants B0 refer to the
ground vibrational state (r0 structure), whereas the theoretical constants Be refer to the equilibrium
geometry (re structure), the values usually agree only within 1 %. We find the best agreement at the
B3LYP/cc-pVQZ level of theory. The MP2 method in combination with triple zeta basis sets provides excellent results for the B and C rotational constants but a larger deviation for the A rotational constant. The M06-2X functional is specifically designed for taking into account long-range dispersive interactions and yields also good results in this case. We note that the rotational constants of the ground vibrational state can be predicted by anharmonic frequency calculations, as given in Table 1. At the MP2/6-311++G(d,p) level of theory, the calculated A rotational constant agrees well with the experimental values; on the other hand, the B and C constants are much worse comparing to the results from geometry optimizations (see Table S-2). Anharmonic frequency calculations at other levels of theory cannot be done because of the limitation of our calculations.
4.2. Microwave structure determination
The structure determination can be performed using the experimentally deduced rotational constants of the parent species and the 13C and 18O-isotopologues. The isotopic shifts allow us to calculate the heavy atom (carbon and oxygen) positions with respect to the center of mass of the parent species using Kraitchman’s equations21 as implemented in the program KRA and EVAL, which are available from the PROSPE database.22 The uncertainties are calculated using Costain’s rule, saying that the uncertainty is inversely proportional to the center of mass distance.23 The signs of the atom
coordinates have been chosen from the coordinates calculated at the MP2/6-311++G(d,p) level. This determined rs structure is in excellent agreement with the vibrational averaged structure (rz)
calculated by anharmonic frequency calculations, as shown in Figure 8. The Cartesian coordinates of the rz geometry are given in Table S-1 in the ESI.
The experimental bond lengths, angles, and dihedral angles are indicated in Table 3. By regarding both, Figure 7 and Figure 8, we note that the frequency shifts from the parent transitions increase with the distance of the substituted carbon atom to the center of mass.
The microwave structure yields the experimental ring plane dihedral angle φ as well as the envelope fold angles, which characterize the envelope structure of MTHF as mentioned in section 2.1. The ring plane is indeed distorted by φ = −6.48(21)°, resulting in a “near-envelope” conformation of the observed conformer. The envelope fold angles are γ = 135.715(48)° and γ’ = 139.950(54)°. These values reasonably agree with the calculated angles of φ = −3.66°, γ = 137.46°, and γ’ = 139.90°. The experimental Cremer-Pople parameters q2 = 0.40, ϕ2 = 27.5°, and α = 68.5° show that the equatorial
conformer has a more twist character (see Figure 4) than the structure calculated at the MP2/6-311++G(d,p) level of theory (q2 = 0.39, ϕ2 = 32.4° and α = 67.7°).
5. CONCLUSION
Geometry optimizations of MTHF using quantum chemical calculations yielded two stable conformers (equatorial and axial); both of them have an envelope structure. The intramolecular conversion from the axial conformer to the energetically more favorable equatorial conformer can occur via two transition states; one has an envelope and the other one a twist structure. In the microwave spectra recorded using the MB-FTMW technique, only the equatorial conformer could be observed. Rotational transitions of all heavy atom isotopologues were assigned, resulted in highly accurate rotational constants, centrifugal distortion constants, and the heavy atom positions with respect to the center of mass. The observed spectra could be reproduced within our measurement accuracy of 2 kHz.
ACKNOWLEDGMENT
The authors thank the Land Nordrhein-Westfalen for financial supports. V.V. thanks the Fonds der Chemischen Industrie (FCI) for a Ph.D. fellowship. Simulations were performed with computing resources granted by JARA-HPC from the RWTH Aachen University under the project jara0124.
REFERENCES
(1) Shipman, S. T.; Neill, J. L.; Suenram, R. D.; Muckle, M. T.; Pate, B. H. Structure Determination of Strawberry Aldehyde by Broadband Microwave Spectroscopy: Conformational Stabilization by Dispersive Interactions. J. Phys. Chem. Lett. 2011, 2, 443–448.
(2) Grabow, J.-U.; Mata, S.; Alonso, J. L.; Peña, I.; Blanco, S.; López, J. C.; Cabezas, C. Rapid Probe of the Nicotine Spectra by High-Resolution Rotational Spectroscopy. Phys. Chem. Chem.
Phys. 2011, 13, 21063–21069.
(3) Attig, T.; Sutikdja, L. W.; Kannengießer, R.; Kleiner, I.; Stahl, W. The Microwave Spectrum of n-Butylacetate. J. Mol. Spectrosc. 2013, 284–285, 8–15.
(4) Martinez O.; Crabtree, K. N.; Gottlieb, C. A.; Stanton, J. F.; McCarthy, M. C. An Accurate Molecular Structure of Phenyl, the Simplest Aryl Radical.Angew. Chem. Int. Ed. 2015, 54,
1808–1811.
(5) Aycock, D. F. Solvent Applications of 2-Methyltetrahydrofuran in Organometallic and Biphasic Reactions. Org. Process Res. Dev. 2007, 11, 156–159.
(6) Smoleń, M.; Kędziorek, M.; Grela, K. 2-Methyltetrahydrofuran: Sustainable Solvent for Ruthenium-Catalyzed Olefin Metathesis. Catal. Commun. 2014, 44, 80–84.
(7) Duan, Z.-Q.; Hu, F. Efficient Synthesis of Phosphatidylserine in 2-Methyltetrahydrofuran. J.
Biotechnol. 2013, 163, 45–49.
(8) Lightner, D. A.; Gurst, J. E. Organic Conformational Analysis and Stereochemistry from Circular Dichroism Spectroscop. J. Wiley-VCH, New York, 2000.
(9) Frisch, M. J.; Trucks, G. W.; Schlegel, H. B.; Scuseria, G. E.; Robb, M. A.; Cheeseman, J. R.; Scalmani, G.; Barone, V.; Mennucci, B.; Petersson, G. A.; et al. Gaussian 09, Revision A.02, Gaussian, Inc., Wallingford CT, 2009.
(10) Mouhib, H.; Stahl, W.; Lüthy, M.; Büchel, M.; Kraft, P. Cassis Odor through Microwave Eyes: Olfactory Properties and Gasphase Structures of all the Cassyrane Stereoisomers and its Dihydro Derivative. Angew. Chem. Int. Ed. 2011, 50, 5576–5580.
(11) Van, V.; Dindic, C.; Nguyen, H. V. L.; Stahl, W. Conformational Transformations of Sulfur-Containing Rings: 2-Methyltetrahydrothiophene Gas-Phase Structures. ChemPhysChem. 2015,
16, 291–294.
(12) Schlegel, H. B. Optimization of Equilibrium Geometries and Transition Structures. J.
Comput. Chem. 1982, 3, 214−218.
(13) Cremer D.; Pople, J. A. A General Definition of Ring Puckering Coordinates. J. Am. Chem.
(14) Cremer, D. RING - A Coordinate Transformation Program for Evaluating the Degree and Type of Puckering of a Ring Compound. Quantum Chemical Program Exchange 1975, 288, 1−8. Available at https://sites.smu.edu/dedman/catco/ring-puckering.html.
(15) Cremer, D. A General Definition of Ring Substituent Positions”, Isr. J. Chem. 1980, 20, 12−19.
(16) Altona, C.; Sundaralingam, M. Conformational analysis of the sugar ring in nucleosides and nucleotides. New description using the concept of pseudorotation. J. Am. Chem. Soc. 1972, 94, 8205–8212.
(17) Andresen, U.; Dreizler, H.; Grabow, J.-U.; Stahl, W. An Automatic Molecular Beam Microwave Fourier Transform Spectrometer. Rev. Sci. Instrum. 1990, 61, 3694–3699.
(18) Grabow, J.-U.; Stahl, W.; Dreizler, H. A Multioctave Coaxially Oriented Beam Resonator Arrangement Fourier-Transform Microwave (COBRA-FTMW) Spectrometer. Rev. Sci. Instrum.
1996, 67, 4072–4084.
(19) Hartwig, H.; Dreizler, H. The Microwave Spectrum of trans-2,3-Dimethyloxirane in Torsional Excited States. Z. Naturforsch. 1996, 51a, 923−932.
(20) Dreizler, H. Gruppentheoretische Betrachtungen zu den Mikrowellenspektren von Molekülen mit zwei behindert drehbaren dreizählig-symmetrischen Molekülgruppen. Z. Naturforsch. 1961,
16a, 1354−1367.
(21) Kraitchman, J. Determination of Molecular Structure from Microwave Spectroscopic Data.
Am. J. Phys. 1953, 21, 17−24.
(22) Kisiel, Z.; PROSPE-Programs for ROtational SPEctroscopy, available at http://info.ifpan.edu.pl/∼kisiel/prospe.htm.
(23) Costain, C. C. Further comments on the accuracy of rs substitution structures. Trans. Am.
TABLES
Table 1. Experimentally deduced molecular parameters of the equatorial conformer of MTHF
compared to the r0 vibrational ground state values calculated by anharmonic frequency calculation at
the MP2/6-311++G(d,p) level of theory.
Par.a Unit Fit I (J ≤ 15) MP2
A GHz 6.59156823(22) 6.5798 B GHz 3.170370175(84) 3.1425 C GHz 2.367116054(88) 2.3457 J kHz 0.3312(13) 0.257 JK kHz 0.0641(35) 0.761 K kHz 2.855(20) 0.849 J kHz 0.05881(44) 0.057 K kHz 0.5322(69) 0.561 HJK Hz −0.788(96) −0.163·10−3 HKJ Hz 2.83(35) 0.111·10−3 hJK Hz 0.331(46) 0.059·10−3 hK Hz −2.84(55) 2.367·10−3 b kHz 2.2 Nc 111
a All parameters refer to the principal axis system. Watson’s A reduction in Ir representation was used. b Standard
deviation of the fit. c Number of lines.
Table 2. Experimentally deduced molecular parameters of different isotopologues of the equatorial
conformer. The atoms are numbered according to Figure 1.
Par.a Unit 18O(1) 13C(2) 13C(3) 13C(4) 13C(5) 13C(6)
A GHz 6.3962301(30) 6.57970964(61) 6.46187441(69) 6.55107431(70) 6.53423752(71) 6.59028755(61) B GHz 3.16966061(63) 3.15713442(33) 3.17000430(43) 3.12372913(38) 3.13465551(41) 3.08086383(37) C GHz 2.34229427(70) 2.36130876(29) 2.34994423(31) 2.33611689(36) 2.34012997(37) 2.31701145(35) J kHz 0.332(29) 0.3318(69) 0.3355(82) 0.329(12) 0.3235(76) 0.3143(72) K kHz 2.53(53) 3.021(51) 2.781(53) 2.696(55) 2.610(59) 2.997(50) J kHz 0.06016b 0.0665(30) 0.0663(35) 0.0553(27) 0.0496(44) 0.0513(48) K kHz 0.580 b 0.596(26) 0.662(39) 0.544(27) 0.709(43) 0.617(56) c kHz 3.0 2.3 2.3 2.8 2.4 3.0 Nd 14 33 31 37 30 37
a All parameters refer to the principal axis system. Watson’s A reduction in Ir representation was
used. b Fixed to the value from Fit III in Table S-4 in the SI, since the two fits are most similar.
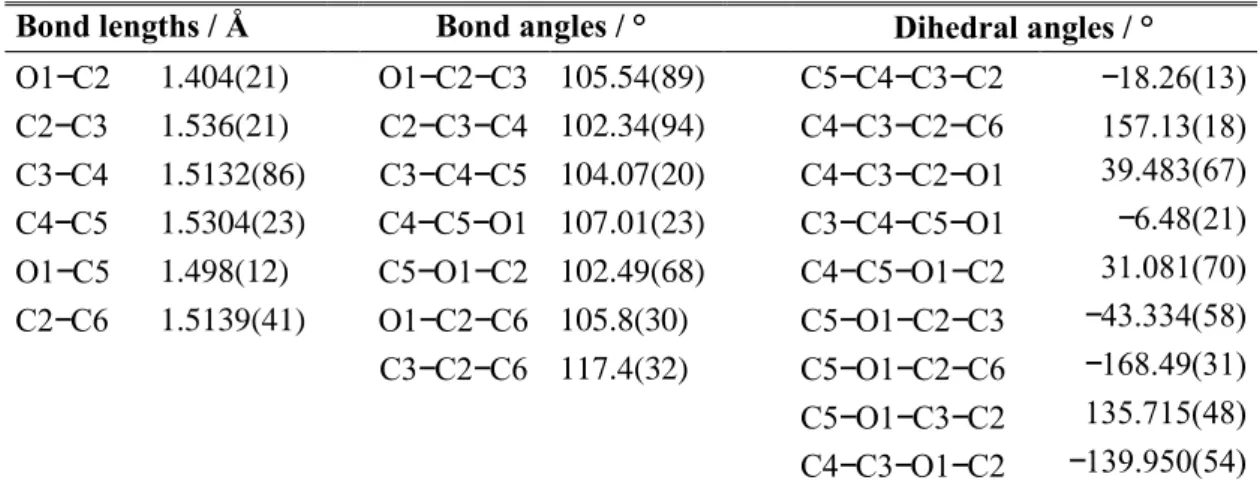
Table 3a. Experimental heavy atom positions of the equatorial conformer obtained by isotopic
substitutions and using Kraitchmann’s equations implemented in the program KRA.21 The atoms are
numbered according to Figure 1.
a/Å b/Å c/Å O1 0.104(15) 1.0792(14) 0.1747(86) C2 0.7290(21) 0.051(30) 0.3774(40) C3 0.140(11) 1.2464(12) 0.039(39) C4 1.54132(97) 0.6932(22) 0.104(15) C5 1.3428(12) 0.8240(19) 0.118(13) C6 2.15737(70) 0.018(83) 0.123(13)
Table 3b. Experimental bond lengths, bond angles, and dihedral angles of the equatorial conformer
obtained using the program EVAL.21
Bond lengths / Å Bond angles / ° Dihedral angles / ° O1−C2 1.404(21) O1−C2−C3 105.54(89) C5−C4−C3−C2 −18.26(13) C2−C3 1.536(21) C2−C3−C4 102.34(94) C4−C3−C2−C6 157.13(18) C3−C4 1.5132(86) C3−C4−C5 104.07(20) C4−C3−C2−O1 39.483(67) C4−C5 1.5304(23) C4−C5−O1 107.01(23) C3−C4−C5−O1 −6.48(21) O1−C5 1.498(12) C5−O1−C2 102.49(68) C4−C5−O1−C2 31.081(70) C2−C6 1.5139(41) O1−C2−C6 105.8(30) C5−O1−C2−C3 −43.334(58) C3−C2−C6 117.4(32) C5−O1−C2−C6 −168.49(31) C5−O1−C3−C2 135.715(48)
FIGURES
Figure 1. The optimized geometry in the principal axes of inertia of the most stable conformer of
MTHF calculated at the MP2/6-311++G(d,p) level of theory. Left-hand side: view along the c-axis; right-hand side: view along the b-axis. The circled dot and cross indicate that the axis direction points out of and into the paper plane, respectively. The blue arrow presents the dipole moment vector.
Figure 2. The envelope conformation is described by the dihedral angles angle φ = ∠ (O, C5, C4, C3)
of the ring plane and two angles γ = ∠ (C2, O, C3, C4) and γ’ = ∠ (C2, C3, O, C5), which describe the
Figure 3. The intramolecular conversion between two stable envelope conformers (equatorial and
axial) via one twist (2T
3) and one envelope (E1) transition state. The energies at the
CCSD(T)/6-311++G(d,p) are related to the lowest energetic the equatorial conformer with its absolute energy E = −271.1307051 Hartree. 2T3 is only 0.10 kJ∙mol−1 higher in energy than the stable axial conformer.
Figure 4. Conformational landscape of MTHF using two Cremer-Pople parameters q2 (puckering
amplitude) and ϕ2 (angle phase). The nomenclature is based on the Twist or Envelope geometry and
the positions of the atoms which are above (+) and below (−) the ring plane. At the center, q2 = 0
Figure 5. Upper diagram: Some sections of a typical broadband scan, where overlapping spectra are
automatically taken at a step width of 0.25 MHz with 50 co-added decays per each spectrum. The relative intensities on a logarithmic scale of the main, 13C-, and 18O-isotopologue are indicated. Lower diagram: A high resolution spectrum of the 220 ← 211 transition obtained after two co-added
free induction decays (FIDs) with a line width of approximately 42 kHz. The splitting is due to the Doppler effect.
Figure 6.a) Upper trace: Experimental broadband scan in the frequency range from 9000 to 12000 MHz. Three a-type R-branch transitions 212 ← 111, 202 ← 101, and 211 ← 110 of the parent species of
the equatorial conformer are marked in red, some assigned b-type Q-branch transitions in blue. b) Lower trace: Predicted spectrum of the equatorial conformer using the rotational constants calculated at the MP2/6-311++G(d,p) level of theory. The calculated a-, b-, and c-type transitions are colored in red, blue, and orange, respectively.
Figure 7.Predicted spectra of the 13C and 18O-isotopologues compared to that of the parent species using the rotational constants calculated at the MP2/6-311++G(d,p) level. The substituted 13C atom is numbered according to Figure 1.
Figure 8. Comparison of the rs microwave structure of MTHF (in blue) determined by heavy atom
substitutions with atom positions (carbon in gray, oxygen in red) of the vibrational averaged geometry calculated by anharmonic frequency calculations at the MP2/6-311++G(d,p) level of theory. The indicated experimental bond lengths are given in Å. Note that the further away the carbon atom is from the center of mass, the larger the frequency shift is from the parent transition (see Figure 7 for comparison).