HAL Id: hal-03094520
https://hal.archives-ouvertes.fr/hal-03094520
Submitted on 4 Jan 2021HAL is a multi-disciplinary open access archive for the deposit and dissemination of sci-entific research documents, whether they are pub-lished or not. The documents may come from teaching and research institutions in France or abroad, or from public or private research centers.
L’archive ouverte pluridisciplinaire HAL, est destinée au dépôt et à la diffusion de documents scientifiques de niveau recherche, publiés ou non, émanant des établissements d’enseignement et de recherche français ou étrangers, des laboratoires publics ou privés.
Validation of a new fluidic device for mechanical
stimulation and characterization of microspheres: A first
step towards cartilage characterization
Noémie Petitjean, Gilles Dusfour, Patrick Cañadas, Marie Maumus, Patrice
Valorge, Stephan Devic, J. Berthelot, Emmanuel Belamie, Pascale Royer,
Christian Jorgensen, et al.
To cite this version:
Noémie Petitjean, Gilles Dusfour, Patrick Cañadas, Marie Maumus, Patrice Valorge, et al.. Validation of a new fluidic device for mechanical stimulation and characterization of microspheres: A first step towards cartilage characterization. Materials Science and Engineering: C, Elsevier, 2020, pp.111800. �10.1016/j.msec.2020.111800�. �hal-03094520�
1
Validation of a new fluidic device for mechanical stimulation and
characterization of microspheres: a first step towards cartilage
characterization
N. Petitjean
1,2, G. Dufour
1, P. Cañadas
1, M. Maumus
2, P. Valorge
1, S. Devic
1,
J.
Berthelot
3,4, E. Belamie
3,4, P. Royer
1, C. Jorgensen
2,5, D. Noël
2,5,#, S. Le Floc’h
1,##: equally contributing authors
1LMGC, Univ Montpellier, CNRS, Montpellier, France; 2IRMB, Univ Montpellier, INSERM,
Montpellier, France; 3ICGM, Univ Montpellier, CNRS, ENSCM, Montpellier, France; 4EPHE, PSL
Research University, 75014, Paris, France; 5Clinical Immunology and Osteoarticular Disease
Therapeutic Unit, Department of Rheumatology, CHU Montpellier, France.
* Corresponding author: Simon Le Floc’h, PhD
LMGC - UMR 5508 Université de Montpellier - CC048 163 rue Auguste Broussonnet 34090 MONTPELLIER, France
Tel: +33 4 67 14 39 90 - E-mail: simon.le-floch@umontpellier.fr REVISED Manuscript (text UNmarked)
2 Highlights
- A new device was validated to mechanically stimulate and characterize microspheres.
- Six microspheres (size 900–1500µm) can be stimulated with various pressure signals.
3 Abstract
Articular cartilage is made of chondrocytes surrounded by their extracellular matrix that can both sense and respond to various mechanical stimuli. One of the most widely used in vitro model to study cartilage growth is the model of mesenchymal stromal cells-derived cartilage micropellet. However, mechanical stimulation of micropellets has never been reported probably because of their small size and imperfect round shape. The objective of the study was to develop an original custom-made device allowing both the mechanical stimulation and characterization of cartilage micropellets. The fluidic-based device was designed for the concomitant stimulation or characterization of six microspheres placed into the conical wells of a tank. In the present study, the device was validated using alginate-, collagen- and crosslinked collagen-based microspheres. Different types and ranges of pressure signals (square, sinusoidal and constant) were applied. The mechanical properties of microspheres were equivalent to those determined by a conventional compression test. Accuracy, repeatability and reproducibility of all types of pressure signals were demonstrated even though square signals were less accurate and sinusoidal signals were less reproducible than the others. The interest of this new device lies in the reliability to mechanically stimulate and characterize microspheres with diameters in the range of 900 to 1500 µm. Mechanical stimulation can be performed on six microspheres in parallel allowing the mechanical and molecular characterization of the same group of cartilage micropellets. The device will be useful to evaluate the growth of cartilage micropellets under mechanical stimuli.
4
1 . Introduction
Articular cartilage is a highly organized connective tissue that covers the long bones. Its composition and structure lead to complex mechanical behavior so that the cartilage ensures smooth movements and facilitates efficient transmission of forces in joint. Chondrocytes surrounded by their extracellular matrix (ECM) play an essential weight-bearing role in the joint and can both sense and respond to various mechanical stimuli (Demoor et al., 2014). However, in degenerative diseases or after injuries, cartilage does not respond properly to mechanical stimulation and fails to regenerate. Current strategies to repair cartilage include bone marrow stimulation, mosaicplasty, autologous chondrocyte implantation (ACI) and matrix-assisted chondrocyte implantation (MACI). However, successful clinical results are limited on the long-term and widely depend on the type of cartilage lesions and inter-patient variability (Ringe et al., 2012). Several types of biomaterials are being developed to provide optimal scaffolds for mature and stable cartilage formation but the mechanical properties of new tissues and the way they respond to mechanical stimulation are often sub-optimal. Therefore, a better understanding of the mechanobiological and biomechanical response of the native cartilage during growth would greatly help to improve current approaches of cartilage engineering.
The cartilage micropellet model is relevant and widely used to study in vitro the growth of cartilage after differentiation of mesenchymal stromal/stem cells (MSCs) into chondrocytes (Johnstone et al., 1998). This model recapitulates the different steps from MSC condensation to proliferation and differentiation into chondrocytes that secrete the specific ECM characterized by the production of type II collagen, aggrecans and other proteoglycans. However, the mechanical
5
characterization of cartilage micropellets has been poorly investigated. We recently showed that compression of micropellets between two planar surfaces allowed to measure their global mechanical properties at different time points during differentiation (Dusfour et al., 2020). The increase of stiffness was correlated to the production of cartilage ECM components as measured at the molecular level. Similar data were previously obtained using the same micropellet culture model and hydrostatic pressure stimulation during 14 days (Miyanishi et al., 2006). Two other studies reported the zonal variation of elastic modulus in cartilage micropellets obtained after 14 day culture of expanded human nasal chondrocytes and after 21 day differentiation of induced pluripotent stem cells using atomic force microscopy. However, one limitation of this technique is the need to use cryosections of micropellets and the inability to measure the mechanical properties overtime on the same micropellets. Finally, mechanical stimulation of chondrocytes embedded in collagen microspheres by compression between two planar surfaces has also been reported (Au-yeung et al., 2009). This method applies strain and stress that depend on the size of the microspheres and is not appropriate to determine the impact of stimulation amplitude on the mechanical properties of multiple spheres at a time. The reasons are that such cartilage microspheres are small, variable in size and exhibit an imperfect round shape. Therefore, compression of micropellets in a fluidic system would probably be the best method for the most accurate stimulation of multiple spheres at a time, which has never been reported to date, and the characterization of their mechanical properties.
The objective of the study was to develop an original custom-made fluidic device allowing both the mechanical stimulation and the characterization of microscale and round objects, such as cartilage microspheres. The device was developed to stimulate and characterize concomitantly
6
six microspheres and was validated by comparison with a conventional method by using alginate and collagen microspheres.
2 . Materials and methods
2.1 . Design of the custom-made device
The custom-made device consists of a fluidic system in which six microspheres (spheres with a diameter ranging from 900 to 1500 µm) can be pressurized within a stereolithography-3D-printed transparent and biocompatible resin tank (Clear Resin, Formlabs, Markershop, Le Mans, France) as depicted (Fig. 1A). The device is sized to allow the position of the entire fluid circuit and the other components within a standard cell culture incubator (Fig. 1B).
7
Fig. 1. Custom-made fluidic device for mechanical stimulation and characterization of microspheres. (A) Schematic representation of the device. Six microspheres can be placed into the conical wells of the tank which is filled with fluid (pink color). A positive pressure (Pi) is applied at the top of microspheres whereas atmospheric pressure (Patm) is maintained at the bottom. (B) Picture of the device comprising the tank, the peristaltic pumps, the camera and the other components. (C) Magnification of one cone of the tank showing a microsphere under the pressure sensor.
In the 6 conical wells tank, the upper part of the wells is pressurized by two peristaltic pumps (15KS series, Boxer, Flow Technique, Entzheim, France), while the lower part is connected to two chambers at atmospheric pressure (Patm). The two peristaltic pumps, which are programmed for
8
The single-roller pump is used to manage the shape of pressure signals (square, sinusoidal, constant) while the multi-roller pump is used to maintain a minimum pressure in case of leakage. Three sizes of soft tubes are used for the single-roller pump (i.e., 2.4, 3.2 and 4.8 mm of internal diameter; Pharm-A-Line™, Boxer, Flow Technique, Entzheim, France) and 4.8 mm tubes for the multi-roller pump. The tank is filled with 20 mL of culture medium. The microspheres are introduced by the openings on top of each cone and tightly fitting caps close each opening on top of the tank. The pressure acquisition is carried out by rated pressure sensors with variable ranges of 25, 100 and 500 kPa (ADP5121, ADP5141, ADP5161, Panasonic, Farnell, Limonest, France). A camera (Mako, Allied Vision, Stemmer Imaging, Suresnes, France), mounted on a motorized stage, is used to follow the oscillations of each microsphere in the cones of the transparent tank (Fig. 1C). Two led bars are attached to the camera support to adapt the lighting of microspheres. The peristaltic pumps and the intensity of the led bars are controlled by an Arduino board (Genuino Uno, Arduino, USA) whereas the displacement of camera, the acquisition of pictures and the pressure are controlled by a second Arduino board (M0 Pro, USA). A computer is connected to the two Arduino boards and to the camera in order to launch python scripts and collect the data.
2.2 . Conventional device
In the conventional device, one microsphere is immersed in a chamber and compressed between two parallel planar surfaces as previously described (Dusfour et al., 2020). The lower planar surface is guided by a linear actuator (Physik Instrumente, Karlsruhe, Germany) and can
9
approach step-by-step until entering in contact with the microsphere. The upper one is linked to a miniature S Beam load cell (LSB200, FutekInc., Irvine, USA).
2.3 . Generation of microspheres
The alginate microspheres (AM) were made with a sodium alginate solution at a concentration of 3% (w/v) in 0.15 M NaCl (Sigma-Aldrich, Lyon, France). The solution was then extruded through a syringe into a 0.1 M CaCl2 solution under magnetic stirring. Alginate
microspheres were allowed to crosslink for 24 hours and were stored in distilled water at room temperature (RT) until use.
The collagen microspheres (CM) were made with a solution of type I collagen extracted from rat tail tendons as described (Mathieu et al., 2014). Drops of collagen solution (9 mg/mL) were produced with a syringe pump set at 0.02 mL/min into a bath of fluorinated oil (Hydrofluoroether, HFE) and 1 % triblock copolymer surfactant. The resulting emulsion was placed in a desiccator for 24 hours in the presence of ammonia vapors to increase the pH, which induces the fibrillation of collagen and solidification of the drops. The CM were then washed three times with pure HFE to remove the excess of surfactant, then rinsed three times and stored in PBS at RT.
The crosslinked collagen microspheres (CCM) were obtained by incubating the CM in a 100 mM buffer solution of 2-(N-morpholino)ethanesulfonic acid (MES). After adjusting the solution pH to 5.5, the crosslinking agent (EDC: 1-éthyl-3-(3-diméthylaminopropyl) carbodiimide) was added in excess at the rate of 20-30 µg/mL of the initial collagen solution and kept under
10
stirring for 2 hours. The CCM were finally rinsed three times and stored in PBS at RT. Populations of small and large CCM were generated.
2.4 . Mechanical testing
2.4.1 . Fluidic compression test in the custom-made device
Before compression, a picture of each microsphere was taken to determine its initial position in the cone at atmospheric pressure. A multi-creep test on crosslink collagen microspheres was used by applying six pressure stages held for 2 minutes. The relative pressure was incrementally increased: 5.1, 6.8, 8.5, 10.3, 12.0 and 13.7 kPa, corresponding to 1.72 kPa ramps at 57.3 kPa/s from the first stage. At each pressure stage, the sinking of microspheres in the cone were recorded using the dedicated camera. The resulting displacements of the top (blue cross) and bottom (red cross) ends (see Fig. 3A and 3B) of each microsphere were estimated through image analysis using a python code with OpenCV library (threshold function). In order to get rid of lateral motions that could occur in the segmentation procedure, only vertical displacements were recorded.
2.4.2 . Conventional compression test
Before and after the fluidic compression test, the microspheres were individually tested in the conventional device. Each microsphere was introduced in the chamber and a multi-relaxation compression test was used. Ten ramps of 30 µm at 100 µm/s were performed. The motor displacement was maintained during 10 sec for the three first stages, 20 sec for the following
11
three and 30 sec for the last stages. A minimum rest of 30 min between each test was applied to allow microspheres to achieve a full elastic recovery.
2.4.3 . Finite element modeling
Two finite element (FE) models using a compressible neo-Hookean hyperelastic energy density (Equation 1) were created by using the LMGC90 software (Dubois and Mozul, 2017) to simulate the deformation of the spheres in both cases, the conventional and fluidic compression tests.
𝜓 =2(1+𝜈)𝐸 (𝐼1− 3 − 2𝑙𝑛(𝐽)) +(1−2𝜈)(1+𝜈)𝜈𝐸 𝑙𝑛2(𝐽) Equation 1
with: 𝐸 the Young’s modulus and 𝜈 the Poisson’s ratio.
𝐼1= 𝑡𝑟𝐶 is the first invariant of the right Cauchy-Green tensor 𝐶 = 𝐹𝑇𝐹 𝐹 the deformation gradient.
𝐽 = 𝑑𝑒𝑡(𝐹) the determinant of the deformation gradient.
The meshes were built with GMSH (Geuzaine and Remacle, 2009) with 667 triangles and 4167 quadrangles, for the fluidic compression test and the standard compression test, respectively. Axisymmetric models have been used since microspheres were assumed to be spherical in shape. In both models (conventional and fluidic compression tests), the contact problem was solved at each pressure stage using the Discrete Element Method described in Dubois and Mozul, (2017) and contact areas were automatically updated.
For the fluidic compression test, half a disk of 1 mm diameter was defined by the vertical axis of symmetry (Fig. 2A). A pressure was applied to each node at the top of the disk, which resulted in disk compression into the cone walls. Each node that encountered the walls was no
12
longer subject to the imposed pressure. The displacements of the top and of the bottom of the microsphere were recorded.
For the conventional compression test, a quarter disk was defined by two vertical and horizontal symmetry axes, as previously reported (Petitjean et al., 2019). A rigid bar parallel to the horizontal axis was used to compress the microsphere for a given displacement. The force developed by the microsphere, which depends on its mechanical properties, was recorded.
The plateau and the cone walls were considered as rigid body since the elastic modulus of tank material and plateau is 4 orders of magnitude higher (more than 1.25 GPa according to the manufacturer) than the mean elastic modulus of microspheres (between 1 and 30 kPa).
2.4.4 . Estimation of the Young’s modulus and Poisson’s ratio
The Young’s modulus and Poisson's ratio of the microspheres were evaluated at the equilibrium state, to estimate their elastic properties (i.e. after relaxation or creep phenomena) and to avoid the influence of the loading rate (DiSilvestro et al., 2000). For the fluidic compression test, only the displacements at the end of each pressure stage were used in the estimation of the mechanical properties. A 2 min waiting time (relaxation time) allowed the stabilization of the deformation of the microsphere within the cone. The mean pressure employed was calculated at each stage. For the conventional compression test, the force developed by the microsphere was measured at equilibrium when the force changed by less than 0.008 mN during 10 sec, at each compression stage.
For the fluidic compression test, the Young’s modulus of microspheres was determined by an identification procedure which minimized the squared difference between the pressure
13
applied experimentally and the one given by the numerical FE model from the measured displacements. For the conventional compression test, the squared difference between the measured force and the one given by the numerical FE model was minimized. A non-linear minimization procedure (least square procedure from scipy.optimize module, with a Trust Region algorithm, in python) was used in the parameter identifications.
In order to reduce the computing time of the FE simulation of the fluidic compression, the problem was nondimensionalized by using two dimensionless ratios. In other words, the identification procedure takes advantage of the fact that even if the mechanical responses are highly non-linear (i.e., the force increases non-linearly with the driven displacement), these responses are strictly proportional to the size and Young’s modulus of the microspheres, as it is shown in the results section. Furthermore, an interpolation procedure using a lookup-table of pre-calculated numerical mechanical responses was developed. All the FE simulations were driven on an HPC cluster with 28 core and 128 GB of RAM.
2.4.5 . Statistical analysis concerning mechanical characterizations.
Statistical analysis was performed for the comparison of the Young’s moduli of small CCM obtained with the fluidic and the conventional compression tests using GraphPad Prism 7 software (San Diego, USA). Data assumed a Gaussian distribution according to the Agostino-Pearson omnibus normality test and were analyzed using paired t tests. Statistical analysis was performed for the comparison of the Young’s moduli and the Poisson's ratios of the alginate-, collagen- and small crosslinked collagen-based microspheres by using Mann-Whitney tests. Data were represented in a boxplot chart.
14
2.5 . Mechanical stimulations 2.5.1 . Stimulation tests
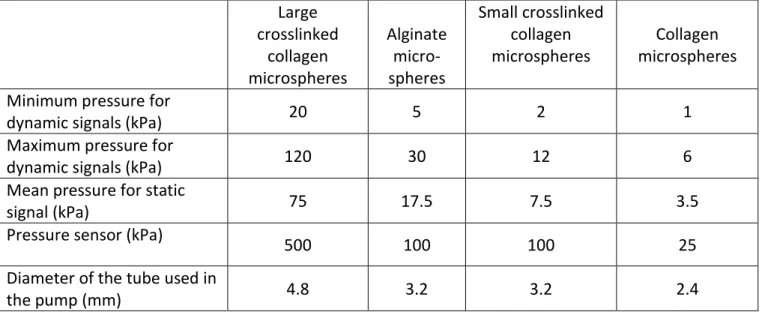
Three groups of six microspheres were stimulated by a square, sinusoidal or constant signal of pressure during 30 min. This stimulation time seemed appropriate by reference to what is usually applied on engineered tissue (Natenstedt et al., 2015). Stimulations with the different signals were consecutively performed on the same group of microspheres after 5-minute pauses. The minimum and maximum relative pressures of dynamic signals (i.e., square and sinusoidal) and the mean relative pressure of static signals (i.e., constant) were adapted to the size and stiffness of microspheres (Table 1). The frequency of the dynamic signals was 1 Hz. The frequency of acquisition pressure was 200 Hz for square signals and 100 Hz for the other signals.
15 Large crosslinked collagen microspheres Alginate micro-spheres Small crosslinked collagen microspheres Collagen microspheres Minimum pressure for
dynamic signals (kPa) 20 5 2 1
Maximum pressure for
dynamic signals (kPa) 120 30 12 6
Mean pressure for static
signal (kPa) 75 17.5 7.5 3.5
Pressure sensor (kPa)
500 100 100 25
Diameter of the tube used in
the pump (mm) 4.8 3.2 3.2 2.4
Table 1. Signal characteristics and experimental parameters used for the stimulation of microspheres, depending on the types of tested microspheres.
2.5.2 . Pressure signal analyses
The signal accuracy was evaluated by determining the mean absolute error between experimental and theoretical signals. For the square signal, additional mean absolute errors were computed for the two transitional parts of the signal, and the minimum and maximum stages.
Repeatability and reproducibility of signals were assessed by analyzing the minimum and maximum pressures of the dynamic signals and the mean pressures of static signal. For square signals, the minimum and maximum stages were isolated by retaining 86% of each half-period, in order to exclude the transitional part of the signal. For sinusoidal signals, the minimum and maximum pressures were identified for each period. The repeatability of the signals was evaluated for each experiment by estimating the standard deviations of the period, of the maximum pressure, of the minimum pressure, and of the mean pressure along the 30 minutes. Signal reproducibility was estimated using the standard deviations of the mean of the signal
16
criteria considering three experiments that were driven with the same experimental parameters and the same microspheres at different time within the same week.
3 . Results
3.1 . FE modeling simulation of the fluidic compression and verification of the usefulness of the dimensionless ratios
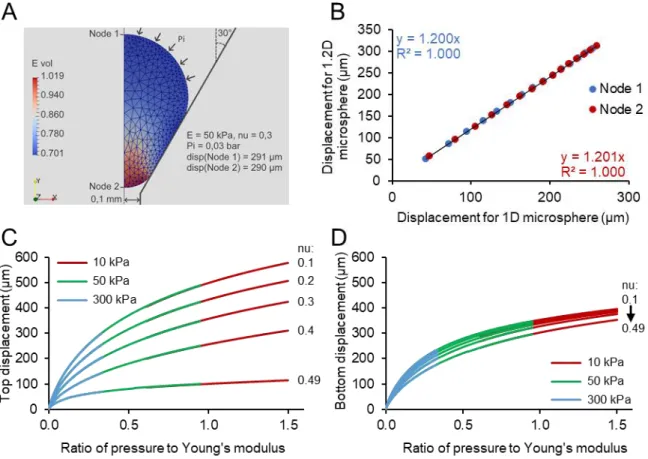
The complex deformation of a microsphere in a cone was depicted by a FE modeling simulation (Fig. 2A). In the upper part of the microsphere, the determinant of the deformation gradient tensor, illustrated in (Fig. 2A), indicates a local decrease in volume during the
compression, while it increases slightly in the lower part.
The impact of microsphere diameter on the displacements of the top (Node 1) and bottom (Node 2) ends was simulated with microspheres of 1 and 1.2 mm diameter (1D and 1.2D microspheres; E = 50 kPa, ν = 0.3). For each end, the displacements of the 1.2D microsphere were plotted as a function of the displacements of the 1D microsphere (Fig. 2B). A perfect correlation between the displacements of the top and bottom ends was indicated by the correlation coefficient R2 while the curve gradient was equal to 1.2, which corresponds to the ratio of the two
microsphere diameters. Therefore, the displacement solutions of this hyperelastic non-linear contact problem are strictly proportionate to the radius of the microspheres. In other words, experimental displacements can be divided by the radius of the microsphere in order to compare them to the displacements estimated by FE modeling simulation using a microsphere of 1 mm of diameter. The identification procedure has therefore been simplified, as simulations of a sphere
17
of 1 mm of diameter are sufficient to identify the mechanical properties of microspheres of different diameters.
Fig. 2. Simulation of the sinking of a microsphere into a cone of the custom-made device. (A) Finite element modelling simulation for a 1 mm microsphere with a Young’s modulus E of 50 kPa, a Poisson's ratio ν of 0.3 and an imposed pressure Pi of 3 kPa. The displacements of the top (Node 1) and bottom (Node 2) ends of the microsphere are saved for the inverse analyses and the determination of microsphere mechanical properties. “E vol” indicates the volume change (equal to unity if no volume change), namely the determinant of the deformation gradient tensor in the finite strain theory. (B) Comparison of the displacements of the top (blue circle) and bottom (red circle) ends of two microspheres of 1 and 1.2 mm of diameter (1D and 1.2D). (C) Displacements of the top end of a microsphere depending on the ratio of the imposed pressure to the Young’s modulus of the microsphere. Curves were built with 15 simulations: 3 Young’s moduli (10, 50, 300 kPa) and 5 Poisson's ratios (0.1, 0.2, 0.3, 0.4, 0.49). (D) Displacements of the bottom end of a microsphere depending on the ratio of the imposed pressure to the Young’s modulus of the microsphere as obtained in (C).
18
Moreover, the displacement of the top and bottom ends of a 1D microsphere was evaluated for different Poisson's ratios and Young’s moduli as indicated in Fig. 2C-D. The relationship between the displacement of the top or the bottom ends and the ratio between the pressure applied (Pi) and the Young’s modulus (E) were shown in Fig. 2C-D. The top and the bottom displacements of microspheres of different Young’s moduli were strictly identical if plotted as a function of the pressure to Young’s modulus ratio. Therefore, the displacement solution was found to be strictly proportionate to the Young’s modulus. Again, the identification procedure has taken advantage of using the proportionality between the displacement and the Young’s modulus of the microsphere. The parameter that has a non-linear influence on the displacements is the Poisson's ratio. No nondimensionalization could therefore be proposed.
3.2 . A limited computation time while estimating the mechanical properties
The different simplifications led to the creation of a lookup-table with the sinking of a microsphere of 1 mm of diameter for three Young’s moduli (10, 50 and 300 kPa) and six Poisson's ratios (0.1, 0.2, 0.3, 0.4, 0.49, 0.499). Eighteen simulations were computed for a total of 18 days computation time since each simulation lasted 5 to 48h. Then, the calculation of the mechanical properties of a microsphere, by interpolation of this table, took less than 5 seconds. Thus, the total computation time needed to determine the mechanical properties of the 62 microspheres of this study with the minimization procedure was greatly reduced. Moreover, any additional computation time that would be required for characterizing other types of microspheres will be short, as no additional FE simulation will be needed.
19
3.3 . Comparison of the mechanical properties estimated using the new fluidic and the conventional compression device.
Small crosslinked collagen microspheres (small CCM of 1.15 ± 1.10 mm diameter) were characterized using the conventional device before and after their characterization using the custom-made device.
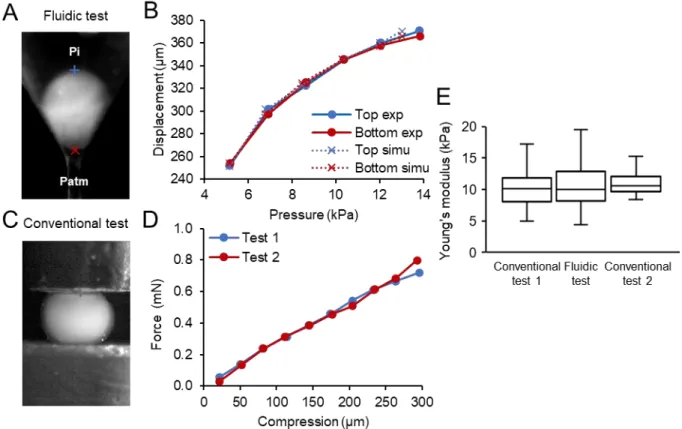
Fig. 3. Mechanical characterization of small crosslinked collagen microspheres. (A) Microsphere in the custom-made device under fluidic pressure (blue cross: top end; red cross: bottom end; Pi: induced pressure, Patm: atmospheric pressure). (B) Representative displacement of a microsphere at the equilibrium of each stage of pressure during the fluidic compression test (exp: experimental data, simu: simulated data). (C) Microsphere in the conventional device between two planar surfaces during a compression test. (D) Representative graph of the force developed by a microsphere following conventional compression tests before (Test 1) and after (Test 2) the fluidic compression test. (E) Median Young’s modulus of microspheres determined by inverse analysis using the fluidic and conventional compression tests. n=16 independent microspheres.
20
During the compression of microspheres within the fluidic device, displacements of both ends (top and bottom) were successfully estimated thanks to the camera (Fig. 3A-B). Compression tests were performed on the same microspheres using the conventional device (Fig. 3C). Forces developed by the microspheres as a function of compression were identical before (Test 1) and after (Test 2) the fluidic compression test (Fig. 3D).
The mechanical properties of microspheres were first analyzed using the data recorded during the fluidic compression test. The root mean square error between the experimental and the simulated ratios of the pressure to Young’s modulus was 0.0427. This ratio remained within the range of 0.265 to 1.498, indicating a good fit between simulated and experimental curves (Fig. 3B). The Poisson's ratio was estimated at 0.35 ± 0.05. This Poisson's ratio was then used in the inverse analysis of the conventional compression test to determine the Young’s modulus. The mean Young’s modulus of microspheres measured with the fluidic device was 10.58 ± 3.93 kPa and it was not significantly different of that measured with the conventional compression tests (Fig. 3E). These results indicated that microspheres were not altered in the fluidic custom-made device and validated this device as appropriate to measure the mechanical properties of microspheres.
3.4 . Capacity of the fluidic device to characterize microspheres with a wide range of stiffness.
To further test the capacity of the mechanical characterization procedure with the fluidic device, two other types of microspheres with different chemical and mechanical characteristics were used: alginate microspheres (AM) and collagen microspheres (CM). The microsphere diameters ranged from 0.95 mm to 1.33 mm for the CM and, from 1.15 mm to 1.24 mm for the
21
AM. The stiffness of microspheres was very different according to the type of biomaterials (Fig. 4A). As expected, the small CCM were 3-fold stiffer than CM while AM were the stiffest samples. The large range of estimated Young’s moduli (1.46 kPa to 29.56 kPa) indicated that the characterization procedure using the fluidic system could estimate a wide range of rigidity of microspheres with variable sizes. While the classical compression device, equipped with a very sensitive force-sensor of 0.1 N capacity at full range, could not attain the required sensitivity, the fluidic device, equipped with a 25 kPa pressure sensor, could precisely calculate the mechanical properties of very soft matter with stiffness as low as 1 kPa. Simultaneously, the compressibility of microspheres was assessed by calculating the Poisson's ratio. It indicated that CM and small CCM were compressible, while AM were almost incompressible with a Poisson's ratio close to 0.5 (Fig. 4B).
Fig. 4. Mechanical properties of the tested microspheres. Young’s modulus (A) and Poisson's ratio (B) obtained for collagen microspheres (CM), small crosslinked collagen based-microspheres (small CCM) and alginate based-microspheres (AG) with the custom-made device. Statistical differences: ** p = 0.002 and *** p ≤0.0005.
22
3.5 . Ability of the fluidic device to drive mechanical stimulations with variable pressure signals on small crosslinked collagen microspheres
Different types of mechanical stimulation were tested using the small CCM. Square, sinusoidal, or constant pressure signals were generated thanks to the stepwise control of the single-roller pump for 30 min. For each for each pressure signal, three independent experiments were conducted with identical pressure parameters to estimate the reproducibility of the fluidic compression experiment. Typical signals for square, sinusoidal and constant signal of pressure are shown in (Fig. 5A).
The amplitude, frequency and shape of signals were analyzed. A difference between the target and experimental values of 0.62 and 0.09 kPa for the minimum pressures (Pm) and, 0.28
and 0.32 kPa for the maximum pressures (Pm) was measured for the square and sinusoidal signals,
respectively. A difference of 0.17 kPa was measured for the constant signal. A small difference (less than 0.5%) was observed between the set and measured periods of the dynamic signals. The global shape of the signals had also a good accuracy as shown by an acceptable mean absolute error of the signals (0.90, 0.49 and 0.24 kPa for the square, sinusoidal and constant signals, respectively) considering the targeted pressure range (from 2 to 12 kPa). The higher mean absolute error of pressure observed with square signals was due to the non-instantaneous change of pressure during the transitional phases: the mean absolute error raised up to 5.82 kPa during the transitional times as compared to around 0.77 kPa during the stage times. Moreover, the stage of the square signal showed a creep of pressure, which led to a higher error compared to the sinusoidal signal. These results indicated that constant and sinusoidal signals had a better shape than square signals.
23
Fig. 5. Square, sinusoidal and constant signal of pressure applied on small crosslinked collagen microspheres. (A) Representative square, sinusoidal and constant signals of pressure generated during the stimulation of small crosslinked collagen microspheres. (B) Boxplot charts present the distribution of maximum (Pm) and minimum (P
m) pressures of square (left column), or sinusoidal
signals (center column) and the distribution of pressures (P) of the constant signals (right column). Pm, P
m and P are compared to the maximum (red dashed line), minimum (blue dashed line) and
mean (orange dashed line) targeted value, respectively. For each type of pressure signal, three groups of 6 microspheres were stimulated for 30 min.
The repeatability of signals was tested during a 30 min stimulation period. The standard deviation of Pm and Pm was 0.27 and 0.29 kPa for the sinusoidal signals and the standard
deviations of pressure were 0.14 kPa for the constant signals (Fig. 5B). For the square signals, the standard deviations of Pm (0.74 kPa) and Pm (0.94 kPa) were slightly higher and this was due to
24
the creep of pressure, as shown in Fig. 5B. Moreover, the periods of dynamic signals were extremely repeatable (1.63% and 1.31% of variation for the square and sinusoidal signals, respectively). This showed a better repeatability for square signals than for sinusoidal signals.
Reproducibility of signals was tested by stimulating three groups of small CCM. The standard deviations of signals were 0.38 and 0.25 kPa for Pm and Pm of square signals), 0.15 and 0.29 kPa
for Pm and Pm of sinusoidal signals and 0.12 kPa for constant signals. Moreover, the periods of
dynamic signals were extremely reproducible (0.07% and 0.11% of variation between groups for the square and sinusoidal signals, respectively). This demonstrated that pressure signals were reproducible between different experiments.
3.6 . Ability of the fluidic device to drive mechanical stimulations on microspheres of variable sizes and mechanical properties
The quality of the pressure signals driven by the fluidic system could be influenced in particular by the size and mechanical properties of the microspheres. Moreover, the amplitude of stimulation needs to be adapted to the type of microsphere, since too low pressure could induce no deformation and too high pressure could destroy the microspheres in the cone. Thus, different types of mechanical stimulation were tested again using large crosslinked microspheres (large CCM), AM and CM. The precision of the amplitude of the pressure signals, repeatability and reproducibility were found similar whatever the microspheres and the range of pressures used (Fig. 6A-C). For stimulating large CMM, which are 1.37 ± 0.09 mm in diameter versus 1.15 ± 0.10 mm for small CCM, a higher stimulation pressure using a sensor with a wider range of pressures and a larger soft tube for the single-roller pump were chosen. The results (Fig. 6A)
25
indicated similar accuracy, repeatability and reproducibility of the signals obtained with the small and large CCM, except for Pm of the dynamic signals where the repeatability and reproducibility
were twice better in the case of the larger CCM.
Depending on the Young’s moduli of the microspheres tested, the ranges of stimulation pressures were adjusted (Table 1). Thus, the sensor with the smallest range and the smallest soft tube was used for CM. The root mean square error tended to increase with the decrease of range of pressures but stayed under 20%, 16% and 4% for the sinusoidal, square and constant signals, respectively, which indicated that the shape of signals was accurate. Similarly, the repeatability and reproducibility of all parameters tended to deteriorate with the decrease of ranges of pressures (Fig. 6A-C). Variability remained under 5% for the ramp signal and under 7% for the Pm
of dynamic signals but the variability of Pm (minimum pressure at each period) reached 25%. We
noticed a wider distribution of the values of the quality criteria for the sinusoidal and constant signals in the first group of CM (Fig. 6C). The stabilization of signals was obtained only after 10 min of stimulation in that specific case. During the remaining stimulation time (20 min), the standard deviation of signal parameters was less than 2.5% showing a good repeatability. The periods of dynamic signals were also extremely repeatable and reproducible since the variability of this criteria never reached 1%. The results indicated that Pm are difficult to generate in a
26
Fig. 6. Repeatability and reproducibility of pressure signals applied on the different types of microspheres. Square, sinusoidal or constant signals of pressure were applied on large crosslinked collagen microspheres (A), alginate microspheres (B) and collagen microspheres (C). Boxplot charts present the distribution of maximum (Pm) and minimum (P
m) pressures of square (left
column), or sinusoidal signals (center column) and the distribution of pressures (P) of the constant signals (right column). Pm, P
m and P are compared to the maximum (red dashed line), minimum
(blue dashed line) and mean (orange dashed line) targeted value, respectively. For each type of pressure signal and each type of microspheres, three groups of 6 microspheres were stimulated during 30 min.
27
4 . Discussion
The present custom-made fluidic device was designed for the mechanical stimulation and characterization of cartilage micropellets and validated here using collagen- and alginate-based microspheres. Our study demonstrates that the device is appropriate and accurate to mechanically stimulate and characterize microspheres in the micrometer range (typically from 900 to 1500 µm in diameter), with different stiffness and compressibility. It allows to load under compression six microspheres simultaneously, using a wide range of precisely defined pressure and frequency regimes. Moreover, the interest of the device will be to provide enough biological material for transcriptomic and proteomic characterization of the six cartilage micropellets that will have been submitted to identical mechanical stimulations. It could also be used to periodically stimulate cartilage micropellets during the differentiation process while maintaining them in the culture medium, within the device.
The fluidic device was designed to stimulate mechanically soft materials by integrating a sensitive pressure sensor, small pressurizing tubes, a sensitive and adequate camera and, control units. Mechanical stimulations were applied on microspheres using different types of pressure signals. The accuracy of the shape of pressure signals, which are rarely described in studies assessing the impact of dynamic mechanical stimulation, was determined (Salinas et al., 2018). The precision of the sinusoidal and constant pressure signals was shown to be good but that of square signals was not perfect probably due to the creep of the pressure stages. Three possible sources of creep were identified: (i) a change of microspheres shape during the stages, (ii) leakages of the fluid between the spheres and the device, and (iii) a creep of the soft tubes used within the pumps, which all might impact the creep of the pressure stage. The imperfect round
28
shape of microspheres or the position in the cone may lead to fluid flow through the cone. The visco-elasticity of soft tubes could also explain the symmetry observed between the creep of the Pm and Pm stages. Currently, only the mean values of the minimum pressure stage use the
feedback of the pressure signal. The accuracy of square pressure signals should be improved through the modification of the closed-loop control of the pump. Of importance, all signals were repeatable and reproducible, even though the square and constant signals were more reproducible than the sinusoidal signal. For all shapes of pressure signals, the most challenging parameter to control is Pm, which can be difficult to maintain stable as it allows to stabilize the
microspheres within the cones.
Along with the demonstration of the accuracy of signal shapes, repeatability and reproducibility, the adaptability of the fluidic device is another main interest. This adaptability was shown by its capacity to stimulate microspheres with different diameters and mechanical properties (Young’s moduli from 1.5 to 30 kPa and Poisson's ratio from 0.25 to 0.499). Various amplitudes of relative pressure can be generated (from 5 to 100 kPa), which means that the fluidic system can test samples with a wide range of stiffness. Moreover, the device is up scalable to samples of smaller or larger sizes since tanks are 3D printed and can be resized at custom.
Combined to the new fluidic device, a fast numerical procedure to identify the Young’s moduli and the Poisson's ratios of the microspheres was specifically developed for this study. The computation time revealed to be a key point as a relatively high number of microspheres had to be characterized. The total computational cost of the identification procedure is mainly due to the resolution of the FE numerical simulations. Taking advantage of two dimensionless ratios, an interpolation method, which used a few FE numerical solutions of the problem, was successful to
29
identify the mechanical properties of the microspheres. This method drastically reduced the overall computation time of the study. When the initial database of FE simulations is completed, a major advantage of such a method is that the computation time is reduced to less than 5 seconds for each microsphere to be characterized. This will allow to mechanically characterize many samples, without elevated computational costs.
The accuracy of mechanical property measures was also demonstrated with microspheres with different chemical and mechanical properties. Indeed, the measures of the Young’s moduli of small CCM obtained with the conventional test were similar to those obtained in the fluidic device and the same accuracy of results was obtained with stiffer alginate microspheres as tested (Petitjean et al., 2019). Using our custom-made fluidic device and a fast numerical FEM-based identification procedure, the Young's modulus values obtained for CM were found to be in the range of those determined for collagen microspheres or gels in other studies (Chan et al., 2008; Ramtani et al., 2010; Yamamura et al., 2007). However, the values of Young’s modulus for AM were lower than the expected value of 200 kPa previously reported (Ouwerx et al., 1998). In this last study, an alginate solution with medium viscosity was used while we used an alginate solution with low viscosity. Moreover, they measured an instantaneous elastic modulus with a compression increase at the rate of 0.03 mm/s, which tends to increase the apparent Young's modulus with increasing viscosity. In the study, only the elastic parameters (Young’s modulus and Poisson’s ratio) were estimated. However, studying the viscoelastic behavior of such biomaterials is of first importance and could be assessed in future studies using our fluidic system (Edelsten et al., 2010; Mak, 1986). Up today, the major limitation of such future visco-hyperelastic characterizations seems to be the computation time.
30
In the present study, several assumptions were adopted for the mechanical characterization of microspheres. First, microspheres with the most spherical shape were selected, in order to get experimental data consistent with the numerical model. An exact axi-symmetry is difficult to achieve due to the irregular shape of microspheres but, considering a sufficiently large number of random samples, the distribution of measured parameters should reflect the intrinsic behavior of the material. Second, a quite simple hyperelastic law was chosen for the FE model, which may not perfectly reproduce the mechanical behavior of microspheres. However, within the pressure range which was used, a Neo-Hookean model could describe with a sufficient quality the behavior of the material, even though collagen fibers are generally described by a non-linear hyperelastic behavior (Fung, 2013). The largest error source of mechanical characterization with the fluidic device was the tracking procedure. The resolution of recorded pictures was 2.65 µm for a range of microsphere displacements during compression tests between 200 to 400 µm. Moreover, the quality of pictures, notably the contrast between the microsphere and the background of the tank, is the key factor for accurate tracking.
5 . Conclusion
The main interest of this new custom-made fluidic device lies in the reliability to mechanically stimulate and characterize microspheres made of soft materials in a single system. Three types of pressure signals can be generated to stimulate microspheres by a non-destructive compression test in a repeatable and reproducible manner. The validation of the fluidic device to stimulate and characterize microspheres of different sizes and stiffness was the first step before
31
its use for measuring the mechanical properties of cartilage micropellets. Of note, six MSC-based cartilage micropellets, regardless of their size and shape, can be mechanically stimulated in parallel allowing both the molecular and mechanical characterization on the same group of samples. The perspectives are to evaluate the growth of cartilage micropellets under mechanical stimuli in a longitudinal differentiation study while keeping the microspheres in the device in the differentiation medium throughout the differentiation process.
Acknowledgements
We thank Yvan Duhamel from Pro3D platform (Univ Montpellier) for 3D-printing of the fluidic device tank and Gille Camp and Quentin Chapelier from COMPEX plateform (LMGC) for the fabrication of some parts of the device.
Funding
We gratefully acknowledge funding support from Inserm and the University of Montpellier. This work benefitted from a French State grant managed by the French National Research Agency under the Investments for the Future programme (LabEx NUMEV, reference n°ANR-10-LABX-20). This work has received financial support from CNRS through the MITI interdisciplinary programs (AAP "Osez l’interdesciplinarité 2018", MoTiV Project).
Declarations of interest
The authors disclose any financial or personal conflict of interest.
32 N. Petitjean: methodology, investigation, writing-original draft preparation. G. Dufour:
conceptualization, methodology, software. P. Canadas: conceptualization. M. Maumus: investigation. P. Valorge: conceptualization, investigation. S. Devic: conceptualization, investigation. J. Berthelot: investigation. E. Belamie: investigation. P. Royer: methodology. C.
Jorgensen: review-editing. D. Noël: conceptualization, writing-review and editing, supervision. S. Le Floc’h: conceptualization, methodology, writing-review and editing, supervision.
References
Au-yeung, K.L., Sze, K.Y., Sham, M.H., Chan, B.P., 2009. Development of a Micromanipulator-Based Loading Device for Mechanoregulation Study of Human Mesenchymal Stem Cells in Three-Dimensional Collagen Constructs. Tissue Engineering Part C: Methods 16, 93– 107. https://doi.org/10.1089/ten.tec.2008.0707
Chan, B.P., Li, C.H., Au-Yeung, K.L., Sze, K.Y., Ngan, A.H.W., 2008. A Microplate Compression Method for Elastic Modulus Measurement of Soft and Viscoelastic Collagen
Microspheres. Ann Biomed Eng 36, 1254–1267. https://doi.org/10.1007/s10439-008-9507-y
Demoor, M., Ollitrault, D., Leduc-gomez, T., Bouyoucef, M., Hervieu, M., Fabre, H., Lafont, J., Denoix, J.-M., Audigié, F., Mallein-Gerin, F., Legendre, F., Galera, P., 2014. Cartilage tissue engineering: Molecular control of chondrocyte differentiation for proper cartilage matrix reconstruction. Biochimica et biophysica acta 1840.
https://doi.org/10.1016/j.bbagen.2014.02.030
DiSilvestro, M.R., Zhu, Q., Wong, M., Jurvelin, J.S., Suh, J.-K.F., 2000. Biphasic Poroviscoelastic Simulation of the Unconfined Compression of Articular Cartilage: I—Simultaneous Prediction of Reaction Force and Lateral Displacement. J Biomech Eng 123, 191–197. https://doi.org/10.1115/1.1351890
Dubois, F., Mozul, R., 2017. LMGC90. Presented at the 13e colloque national en calcul des structures.
Dusfour, G., Maumus, M., Cañadas, P., Ambard, D., Jorgensen, C., Noël, D., Le Floc’h, S., 2020. Mesenchymal stem cells-derived cartilage micropellets: A relevant in vitro model for biomechanical and mechanobiological studies of cartilage growth. Materials Science and Engineering: C 112, 110808. https://doi.org/10.1016/j.msec.2020.110808
33
Edelsten, L., E. Jeffrey, J., V. Burgin, L., M. Aspden, R., 2010. Viscoelastic deformation of articular cartilage during impact loading. Soft Matter 6, 5206–5212.
https://doi.org/10.1039/C0SM00097C
Fung, Y.C., 2013. Biomechanics: Mechanical Properties of Living Tissues. Springer Science & Business Media.
Geuzaine, C., Remacle, J.-F., 2009. Gmsh: A 3-D Finite Element Mesh Generator with Built-in Pre- and Post-Processing Facilities. International Journal for Numerical Methods in Engineering 79, 1309–1331. https://doi.org/10.1002/nme.2579
Johnstone, B., Hering, T.M., Caplan, A.I., Goldberg, V.M., Yoo, J.U., 1998. In vitro chondrogenesis of bone marrow-derived mesenchymal progenitor cells. Experimental cell research 238, 265–272. https://doi.org/10.1006/excr.1997.3858
Mak, A.F., 1986. The Apparent Viscoelastic Behavior of Articular Cartilage—The Contributions From the Intrinsic Matrix Viscoelasticity and Interstitial Fluid Flows. J Biomech Eng 108, 123–130. https://doi.org/10.1115/1.3138591
Mathieu, M., Vigier, S., Labour, M.-N., Jorgensen, C., Belamie, E., Noël, D., 2014. Induction of mesenchymal stem cell differentiation and cartilage formation by cross-linker-free collagen microspheres. European Cells and Materials 28, 82–97.
https://doi.org/10.22203/eCM.v028a07
Miyanishi, K., Trindade, M.C.D., Lindsey, D.P., Beaupré, G.S., Carter, D.R., Goodman, S.B., Schurman, D.J., Smith, R.L., 2006. Effects of hydrostatic pressure and transforming growth factor-beta 3 on adult human mesenchymal stem cell chondrogenesis in vitro. Tissue Eng. 12, 1419–1428. https://doi.org/10.1089/ten.2006.12.1419
Natenstedt, J., Kok, A.C., Dankelman, J., Tuijthof, G.J., 2015. What quantitative mechanical loading stimulates in vitro cultivation best? J Exp Orthop 2.
https://doi.org/10.1186/s40634-015-0029-x
Ouwerx, C., Velings, N., Mestdagh, M.M., Axelos, M.A.V., 1998. Physico-chemical properties and rheology of alginate gel beads formed with various divalent cations. Polymer Gels and Networks 6, 393–408. https://doi.org/10.1016/S0966-7822(98)00035-5
Petitjean, N., Maumus, M., Dusfour, G., Cañadas, P., Jorgensen, C., Royer, P., Noël, D., Floc’h, S.L., 2019. Validation of a new technique dedicated to the mechanical characterisation of cartilage micropellets. Computer Methods in Biomechanics and Biomedical Engineering 22, S296–S298. https://doi.org/10.1080/10255842.2020.1714919
Ramtani, S., TAKAHASHI-IÑIGUEZ, Y., Helary, C., GEIGER, D., GUILLE, M., 2010. Mechanical behavior under unconfined compression loading of dense fibrillar collagen matrices mimetic living tissues. Journal of Mechanics in Medicine and Biology - J MECH MED BIOL 10. https://doi.org/10.1142/S0219519410003290
Ringe, J., Burmester, G.R., Sittinger, M., 2012. Regenerative medicine in rheumatic disease— progress in tissue engineering. Nature Reviews Rheumatology 8, 493–498.
https://doi.org/10.1038/nrrheum.2012.98
Salinas, E.Y., Hu, J.C., Athanasiou, K., 2018. A Guide for Using Mechanical Stimulation to Enhance Tissue-Engineered Articular Cartilage Properties. Tissue Engineering Part B: Reviews 24, 345–358. https://doi.org/10.1089/ten.teb.2018.0006
34
Yamamura, N., Sudo, R., Ikeda, M., Tanishita, K., 2007. Effects of the Mechanical Properties of Collagen Gel on the In Vitro Formation of Microvessel Networks by Endothelial Cells. Tissue Engineering 13, 1443–1453. https://doi.org/10.1089/ten.2006.0333