Determinants of Singapore Residential Land Value
ByYean Pin Lee
Bachelor of Science (Estate Management) National University of Singapore, 1996
Submitted to the Department of Architecture in Partial Fulfillment of the Requirements for the Degree of
Master of Science in the Real Estate Development
at theMassachusetts Institute of Technology
September 2002@ 2002 Yean Pin Lee
All Rights Reserved
MAAHuSTTS INSTITUTE
OFTECHNOLOGY
SEP
2 0
20
02LIBRARIES
ROTCH
The author hereby grants to MIT permission to reproduce and to distribute publicly paper and electronic copies of this thesis document in whole or in part.
Signature of Author: Certified By: Accepted By: D palme Architecture U ugust 2002 Henry 0. Pollakowski Visiting Scholar, Center for Real Estate Thesis Supervisor
William C. Wheaton Chairman, Interdepartmental Degree Program in Real Estate Development
Determinants of Singapore Residential Land Value
By Yean Pin Lee
Submitted to the Department of Architecture on August 3, 2002 In Partial Fulfillment of the Requirements for the
Degree of Master of Science in the Real Estate Development
ABSTRACT
This empirical study investigates the factors that explain the variation in private residential land value in Singapore. In doing so, it determines the impact that land use zoning and plot ratio allowable have on residential land value.
Previous empirical studies in the US and UK have found plot characteristics, accessibility and zoning variables to be important determinants of land value. However, these factors need to be examined within the specific economic, social and political context of different cities. In this study, these variables are employed to investigate whether the traditional determinants have similar significant impacts on the variation in
residential land value in the dense and highly regulated Singapore land market.
The data used consist of all residential land transactions from the government land sales program between years 1993 to 2001. Two land use types -- landed and non-landed -- are separately analyzed because of the difference in their density and mean land price per square meter. The study establishes the premium or discount in land price per square meter that developers would factor into a tender bid for each type of housing form allowed. Empirical evidence is provided that confirms the importance of location and accessibility in determining residential land value in Singapore. The study also confirms the presence of plattage (negative relationship between parcel size and price per unit area) in non-landed housing sites. Density or plot ratio is also a primary driver of residential land value and an important tool in land use policies to encourage capital land substitution.
Thesis Supervisor: Henry 0. Pollakowski
Acknowledgement
I would like to thank my thesis supervisor, Henry for his guidance, and for making this thesis work an invaluable learning experience. I would also like to thank my friends in URA for providing resources from Singapore, CRE classmates especially Yoon-Jung Kim and Allan Wu for their constant encouragement and making the thesis experience fun.
I would like to thank my fianc6, Teck Hee, for his unwavering support, patience and love throughout this exciting year at MIT. And to my dear parents and sister Shan whom I am deeply indebted to, I dedicate this thesis.
Finally, I would like to thank the Urban Redevelopment Authority of Singapore for giving me this opportunity to pursue my interests in the Real Estate Development at MIT.
Yean Pin Lee Cambridge, MA
TABLE OF CONTENT
1. Introduction ... 6
1.1 Supply of land in Singapore ... 7
1.2 Demand of land ... 8
1.3 Purpose of the study:... 11
1.4 Organization of study ... 11
2. Overview of Singapore housing market...12
2.1 Social economic context ... 12
2.2 Key features of Singapore Housing Market... 13
2.3 Housing sub-sectors in Singapore ... 18
2.3.1 Public Housing... 18
2.3.2 Executive Condominiums ... 19
2.3.3 Private Housing ... 19
2.4 Performance of private residential market since 1975... 21
3. Singapore land m arket... 25
3.1 Restrictive Land Supply ... 25
3.2 Land Tenure ... 28
3.3 Sales of Sites (SOS) Program ... 28
3.4 Sales Process... 29
3.5 State Land Pricing Approach ... 30
4. Literature review and synthesis...32
4.1 Definition of land value/ price ... 32
4.2 Previous studies ... 32
4.2.1 Relationship between housing and land price ... 32
4.2.2 Researches on determinants of land value ... 33
4.3 Synthesis and Hypotheses formation... 36
5. Operationalization of hypotheses... 39
5.1 Locational variables ... 39
5.2 Zoning variables ... 41
5.3 Plot Variables ... 44
5.4 Dependent variable: LnTPSA (tender price per square meter)... 45
6. Data Collection and Research Methodology ... 47
6.1 Data Source and collection ... 47
6.2 Data Exploration ... 48
6.2.1 Descriptive Statistics... 48
6.2.2 Location variables... 50
6.2.3 Zoning Variable - Housing form allowed... 51
6.2.4 Plot ratio allowed ... 52
6.2.5 District ... 53
6.3 Methodology ... 53
7. Em pirical result... 56
7.1 The Models... 56
7.2 Landed Housing Model ... 56
7.2.1 Discussion ... 57
7.3 Non-Landed Housing Model ... 63
7.3.1 Discussion ... 64
7.4 Inferences... 67
7.4.1 Landed housing zone... 67
7.4.2 Types of housing allowed ... 68
7.4.3 Plattage effect... 68
7.4.4 Distance from CBD ... 69
7.4.5 Plot ratio allowed ... 69
8. Conclusion... 72
8.1 Sum mary of Findings... 72
8.2 Lim itations of the study... 73
8.3 Recom mendation for further studies ... 73
9. Table of Figures ... 74
1. Introduction
This empirical study investigates the factors that explained the variations in private residential land values in Singapore. In doing so, it determines if land use zoning and/or plot ratio regulations have significant impacts on private residential land values.
Land is a heterogeneous good that is comprised of a bundle of unique characteristics reflecting not only its location but also other amenities such as the quality of neighborhood and infrastructure. Zoning fixes the supply of land with given attributes for different uses. If the use allocation leads to a fixed supply of land, the equilibrium price would be determined by demand. Such an outcome in a competitive market could reflect how much a developer would pay for the land in a competitive bid, knowing that he/she could yield the highest economic use and density on the site at that particular location. Within a regulated market, this willingness-to-pay price is determined by how much the developer values each of the characteristics of the particular residential land for the proposed type of development. It is in the above context that the empirical
research on what makes up the residential land value in Singapore arises.
Escalating residential sales price could also bring about an increase in residential land value as developers are willing to pay more for the land that could potentially give greater profits. At the micro level, land is a key factor of production for housing development. Its cost could contribute to a substantial portion of the project cost and subsequently manifested through residential sales price. Understanding the determinants of land value would help improve the feasibility study of a site acquisition from the developer's point of view. It would also enable more accurate bidding for new vacant site.
At the macro level, the understanding of the determinants of residential land value would enable policy makers such as planners and economists to make land use allocation more efficient. In making decisions, local governments and private utility providers monitor new developments and activities in the land market because of the lead times required to build the complementary infrastructure to accommodate the development. In addition, the study could also help to determine if some of the land use
allocation strategies such as increase allowable density around state land around transit station have indeed "optimized" the land use.
1.1 Supply of land in Singapore
Land is a scarce resource in Singapore, a small tropical island with a land area of 647.2 square kilometers (or 250.2 square miles). The city-state of Singapore is just slightly more than 3.5 times the size of Washington, DC and about the same size as the Pacific Island of Guam.
Singapore is one of the most densely populated countries in the world (Figure 1). Its population density has risen from 3,245 per sq. km in 1965 to 6,055 per sq. km in 2001 (Figure 2). It was estimated that by 2001, some 80% of the Singapore population would be staying in residential development with average plot ratio' of 2.1. At plot ratio 2.1 on a site of 10,000 square meters, there would be around 1202 dwelling units in a 16-story3 apartment.
Figure 1: How Singapore compared with other cities (1999)
Hong Kong 6 1,095 5479
London 7 1,579 4433.2
Beijing 11 16,800 654.8
New York 20 137,304 1457
1 Plot ratio is equivalent to floor area ratio. It measures the ratio of gross floor area to land area.
2 This is based on 175 sqm per unit (3.11 persons per unit X 56sqm per person) including circulation space.
3 1 0,000sqm site could yield a building footprint of about 15 -20%.
4 Urban redevelopment Authority
Source: The Straits Times (Feb 10 1999 & Mar 20 1999)
Figure 2: Key Statistics of Singapore
Population Dependency
Mid year population Land Density Median Ratio
Year ('000) (sqkm) (per sqkm) age #(year) (per '00)
Total* residents 1991 3135.8 2795.4 639.1 4907 30.2 40.9 1996 3670.4 3067.8 647.5 5669 32.4 41.3 1997 3793.7 3121.1 647.8 5856 32.8 41.1 1998 3922 3174.8 648.1 6052 33.2 40.8 1999 3950.9 3221.9 659.9 5987 33.7 40.6 2000 4017.7 3263.2 682.7 5885 34.2 40.4 2001 4131.3 3319.1 682.3 6055 34.6 40.4
* Total Population comprises Singapore Residents and foreigners staying in Singapore for at least 1 year
# Residents under 15 and above 65 year divided by residents aged 15-64 years
Source: Yearbook of Statistics Singapore(http://www.singstat.gov.sg/keystats/annual/yos/yos18.pdf)
1.2 Demand of land
In addition to the limitations posed by the small fixed supply of territorial land area, the supply of land for housing is further reduced by the more restrictive criteria for residential development such as location and neighborhood attributes. As a sovereign nation, other than land for housing, business and economic growth, open spaces and recreation, Singapore also needs land for airports and sea ports, military training grounds and water catchments areas (Figure 3). These uses consume large land areas and also impose development constraints such as building height, usage compatibility and intensity over wide areas around the developments. For example, a 30m expressway noise buffer sterilizes the land adjacent to expressway, making residential use within the buffer unsuitable.
To ensure the best use of scared land, Singapore has a land use blueprint called the Concept Plan. First developed in 1971, the Concept Plan is a long-term strategic
5 Urban redevelopment Authority
6
plan that is reviewed once every ten years to keep up with changing trends and the aspirations of the people. In Concept Plan 1991, it was projected that Singapore's population would reach 4 million only after 2010. However, due to government's immigration policy to attract and embrace foreign talents, Singapore's population has already reached 4 million by mid 1999.
In the most recent Concept Plan Review 2001, URA has projected a total population of 5.5 million as a reasonable growth estimate to evaluate the allocation of land and resources in the next 40 to 50 years. With a larger population, there will be more demand for land resources for various uses. In particular, URA projected that a total of 1.8 million homes will be needed to cater for the 5.5 million resident populations. This is another 800,000 (80%) new homes on top of the existing 1 million homes today. With a fixed supply of land, these new homes would have to be provided by higher density development.
Over the last 30 years, the Singapore economy enjoyed a period of continuous growth. Such growth was also complemented by the escalating real estate property
prices, particularly in the private residential sector (Figure 4). Especially in the last decade, the residential price index has increased by 155%. Over the same period, the real GDP increased by less than 109%. With the continual growth of the economy and the population over the last 3 decades, the demand for land becomes more intense. In land scarce Singapore, the supply of housing is closely intertwined with the factor market for land. With such bullish housing market and land scarcity, builders would pay more for land in anticipation of higher demand and selling residential developments for higher profits or do more capital land substitution that would yield more sellable units. This increase in demand for land could then be translated to high land prices.
Figure 4: Relationship between Real GDP and private property price index
160,000- - 180 140,000 _., 160 120,000- - 140 meU 120>1 100,000 - -)(1 100ax 4) CO 80,000-- -0 0 ar* 80 -S c f0 60,000 _O. C + 60 n-40,000- C40 40 (U) 20,000 20 ) Year-1976 1978 1980 1982 1984 1986 1988 1990 1992 1994 1996 1998 2000
-- &n- Real GDP (S$m) - RPPI
As urban economists have suggested, with increase in land cost, there would be a tendency to use less land relative to other labor or capital input (capital land substitution). Take for example: it would be extravagant to build a large home with big garden in the CBD because of high land cost. Rather, developer would substitute land with capital (such as building) and labor to build a higher density apartment. How land use zoning and density would affect residential land value becomes important both to individual developer and to the policy makers in making zoning decisions. The results of our study would help property appraisers, land buyers and sellers, and policy makers evaluate the impact of certain parcel characteristics and also zoning on residential land values.
1.3 Purpose of the study:
The objective of the study is:- To investigate the factors that explain the variations in the private residential land value in Singapore; and
- To determine if land use zoning and/or plot ratio restriction have significant impact on the land value.
1.4 Organization of study
The thesis is organized into 8 chapters. Chapter 1 states the research issue and objective of this thesis. Chapter 2 provides the context of this study by reviewing the Singapore residential housing market. This would be followed by Chapter 3 which focuses on an overview of the Singapore land sales market and the relevant government policies. Market jargons that are frequently mentioned in the thesis would also be explained here.
With the background and context of Singapore explained, I proceed with a literature review of the classic economic rationale and determinants of land value in Chapter 4. Then, the various studies and articles relating to possible determinants of residential land value are explored systematically to lead to the formulation of the hypotheses. Chapter 4 also gives details on the formation of the hypotheses of this study while Chapter 5 focuses on the operationalization of the hypotheses.
Chapter 6 covers the aspects of data source, collection, methodology and preliminary data exploration. Chapter 7 presents the empirical results based on correlation research using multiple linear regression models. Finally, Chapter 8 summarizes the findings of the study, discusses limitations and suggests key
2. Overview of Singapore housing market
2.1 Social economic context
Singapore is a densely populated city-state with about 4 million people and territorial land area of only 682.3 square kilometers. Over the last four decades, Singapore has achieved tremendous economic advancements. From earning a GDP of S$2.15 billion in 1960 to a GDP of S$141 billion (US $80 billion) (Figure 5) in 2001, the city-state is today a reputable financial centre, a key regional trading centre, the world's busiest port and a top location for investment.
Figure 5: Real GDP 160,000 140,000 -120,000 -100,000 -80,000 -E 4 60,000 - 40,000-i 20,000 1 0 1 1 ! 1 1 1 1 i 1 1 1 1 i 1 ! 1 1 1 1 1 1 1 1 I ! Year 1976 1978 1980 1982 1984 1986 1988 1990 1992 1994 1996 1998 2000 - *- Real GDP (S$m)
Singapore has been ranked one of the best cities for business procurement in Asia based on a number of criteria ranging from political leadership, economic
profitability, degree of corruption, risks in investment, and skills in workforce to assess a country's competitiveness as a business location.
pL..
U-Previously a British colony, Singapore became an independent republic in 1965 with People's Action Party being the ruling party. Since the 1960s, the Singapore Government has focused on job creation and housing provision for the nation. Today more than 92% of Singaporeans are homeowners and the unemployment rate has been kept at a low of 4% for the last 15 years.
2.2 Key features of Singapore Housing Market
The housing market in Singapore is very much driven and guided by planning and public policy. In response to the deplorable standard of living and acute housing shortage, the Housing and Development Board (HDB) was set up soon after self-government in 1959 as a statutory board to 'provide decent homes equipped with modern amenities for all those who needed them.' According to Census 2001, HDB housed about 86% of the population in affordable public housing by 2000.
Public Sector Dominance
About 80.5% of the dwelling units in Singapore are public housing built by HDB. High-density, high-rise buildings have always been a main feature of all public housing estates in Singapore. They include residential blocks predominantly 10 to 13 story slab blocks, several 4 story blocks and several 20 to 25 story point blocks. These 99-year leasehold apartment units were sold to the eligible household such as a nuclear family with annual household income not exceeding $96,000 (US$53,631).
These apartments are located in housing estates, which are self-contained towns with schools, supermarkets, clinics, as well as sports and recreational facilities. There are three-room, four-room, five-room and executive flats (figure 6). A three-room flat has two bedrooms of about 800 sq ft. An executive apartment, the largest type of apartments built by HDB with typically about 1,600 sq ft of space, has three bedrooms and separate dining and living rooms.
The government supports the public housing program by providing financial assistance for the funding of housing development and other activities. These assistance come in the form of loans such as the housing development loan that covers
development program and operations, and government grants.
Figure 6: % of Household in each HDB Flats type
100- 80- 60-Percent 20-0'
HDoftsal oo 3-room 4-room cuoo v Others
0 1990 84.6 8.2 35.4 27.4 13 0.7 o 2000 88 5 25.7 33.2 23.7 0.4
Type of HDB flat
Source: Singapore Census of Population, 2000 Advance Data Release no 6 - Households and Housing
- High percentage of Home Ownership
Singapore public housing program had its early emphasis on homeownership and creation of resale housing market. In 1964, the government introduced the Home Ownership for the People Scheme to give citizens an asset in the country, a means of financial security and to hedge against inflation as it protects against rising rents. This push for home ownership also helped in the overall economic, social and political stability of the country.
- Predominant medium to high density housing
Since 1970s, to solve the housing shortage problem, Singapore embarked on medium to high density housing program. With constraints on the availability of land for new development, part of the increase in the much needed housing units are accommodated by gradually building higher and denser developments in areas without height constraints, in order to make full use of available land.
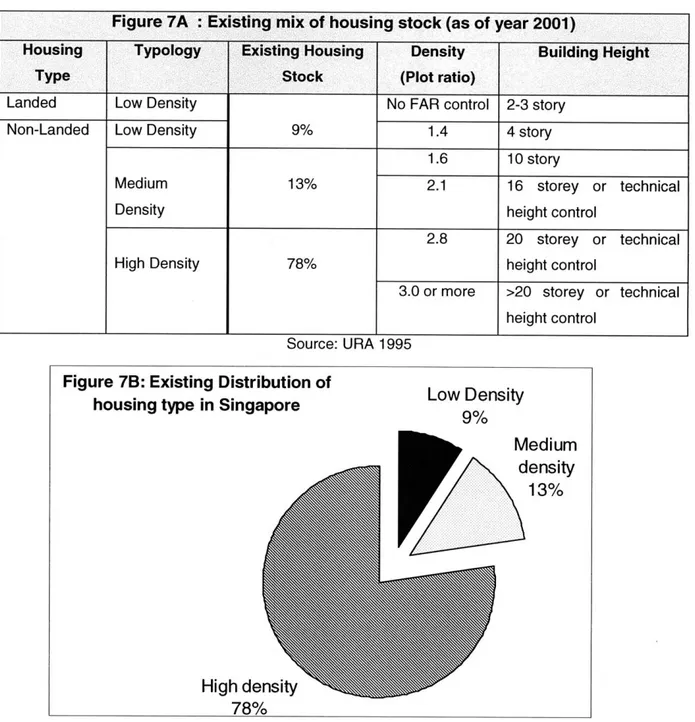
The existing mix of housing typology is summarized in Figure 7A & B. Almost 91 % of the housing stock are of medium to high density housing more than 10-story
high.
Figure 7A : Existing mix of housing stock (as of year 2001)
Housing Typology Existing Housing Density Building Height
Type Stock (Plot ratio)
Landed Low Density No FAR control 2-3 story
Non-Landed Low Density 9% 1.4 4 story
1.6 10 story
Medium 13% 2.1 16 storey or technical
Density height control
2.8 20 storey or technical
High Density 78% height control
3.0 or more >20 storey or technical height control
Source: URA 1995
To illustrate the difference between landed and non-landed sites, we could look at the typical distribution of residential typology within a typical 'satellite' new town such as Pasir Ris. With a land area of 601 ha (601,000square meter), including 318,000square meter of residential land, Pasir Ris town was developed in 1995 and it currently housed about 44,000 dwelling units. (Figure 8)
Pasir Ris New Town
Figure 8A: Map of Singapore and Pasir Ris New Town. Source: URA
Figure 8B: Distribution of residential typology within Pasir Ris New Town
Housing Type Density Building No of units % of Dwelling
(Plot ratio) Height units
Landed No FAR 2-3 story 1,100 4%
- Low Density control
Non-Landed 1.4 4 story 90
- Low Density
Non-Landed 1.6 10 story 3,500 25%
-Medium Density 2.1 16 storey 7,900
Non Landed 2.8 20 storey 33,000 71%
-high Density 3.0 or more >20 storey
-Source: URA 1995 Total 46,400 100%
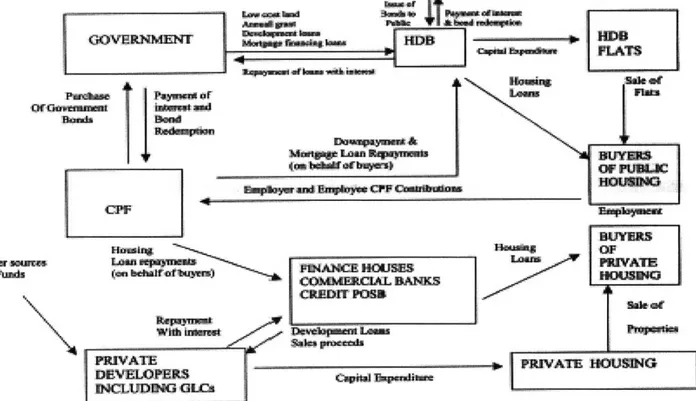
- Housing Finance Policy
The predominant 92.3% home ownership rate in public and private market is made possible mainly through the use of Central Provident Fund (CPF) as an instrument of housing finance. (Figure 9) The CPF is essentially a fully-funded, pay-as-you-earn
X
4M4
social security scheme, which requires mandatory contributions by both employees and employers of a percentage of the employee' monthly contractual wage towards his/her personal account in the fund. Contribution rate fluctuates with economic condition and it is currently set at 20% of wages for employees and 16% of wages for employers. In effect, the CPF is a compulsory savings scheme that earns interest and is exempted from taxation.
Since Sep 1968, legislation was enacted to allow CPF members to withdraw their CPF funds to finance the purchase of both HDB and private housing. Eligible members are allowed to use their CPF savings for the 20% down payment for HDB flats and their monthly CPF contributions can be deducted directly for mortgage payments of housing loans for the purchase of HDB and private housing units. This allows purchasers of public and private housing to be able to make provision for home ownership without a resultant decrease in monthly disposable income.
GOVERNET
Mr nsA7
Sakt
CPFM
MWcaamen
bLimae andye Bus
... r.r...r OF PUMK2C
Bormp Am -amok%"e cPr ebmwsamwns O
411 s Has~
CORc1AL BAWO5
With ~ ~
ISO"~
owi.R~f iP055i ...
-3
PUVATE UMSINGj
2.3 Housing sub-sectors in Singapore
There are 2 main housing sub-sectors in Singapore, public and private. In each of these markets, there are both sales and rental market. Figure 10 shows the percentage of residential household by dwelling type and also shows the several sub-sectors of the market.
Figure 10: Percent of Resident households by dwelling type
Dwelling type Yr 1990 Yr 2000 Total 100% 100% Public Sector: 84.6% 88% HDB flats 1 & 2 -room 8.2 5 3-room 35.4 25.7 4-room 27.4 33.2
5-room & Executive 13 23.7
Others 0.7 0.4
Private Sector:
Private apartment and condos 4.1% 6%
Private Houses 7% 5.1%
Others 4.3% 0.9%
2.3.1 Public Housing
The public owner- occupied housing sector is the largest of the housing market. (Pang 2000) As the HDB has a virtual monopoly over the public housing market, the market does not determine the price of housing. The low price is set by the government, through the Ministry of National Development, taking into account the state of the economy and the levels of affordability of the general public. Demand is regulated by eligible rules such as household income, forming a nucleus family etc. An eligible household is allowed to buy a new flat that is priced almost half that of a similar-size private apartments. (Figure 11) This has worked towards encouraging home ownership among the Singaporean public, even for those in the lowest income brackets.
8 Pang Sock-Yong 2000, "The impact of Privatization on State Housing and Housing Policy in Singapore' workshop on 'New Requirements in Housing Policy: The experience of the East and Southeast Asia' seoul, 8-10 Nov 2000.
The rental public sector is very small as its stock only makes up about 7.3% of the 850,000 HDB units in Singapore. This sector is regulated by HDB and provides minimum standard housing for the lowest income families. Some of the rental units are also for 'transitional' families that are waiting for their new HDB flats that are under construction or for foreign workers
Figure 11: Comparison between the price per square meters of HDB flat and
private apartments (as at 4 th Quarter 2000)
New HDB Flats Private apartment
Zone Town 4-Room 90 sqm 5-Room 1 10sqm Mean Price Difference
(%) West Jurong $1,733,330 $2,463,640 $ 5,485,000 55% West North Sengkang $ 2,066,670 $2,681.82 $ 5,199.00 48% East 2.3.2 Executive Condominiums
The Executive Condominium (EC) sector is a hybrid public-private sector that was introduced in 1995 to meet the increasing demand for private housing at affordable prices. The EC scheme also facilitated the HDB withdrawal of upper-middle-income housing market (previously called executive flats). These ECs are similar to the 99-year leasehold private apartment except for its eligibility conditions (household income below $10,000 per month) and the other regulations governing the minimum 5-year occupancy before sale to Singaporean or Permanent Resident and 10-year before sale to foreigners.
2.3.3 Private Housing
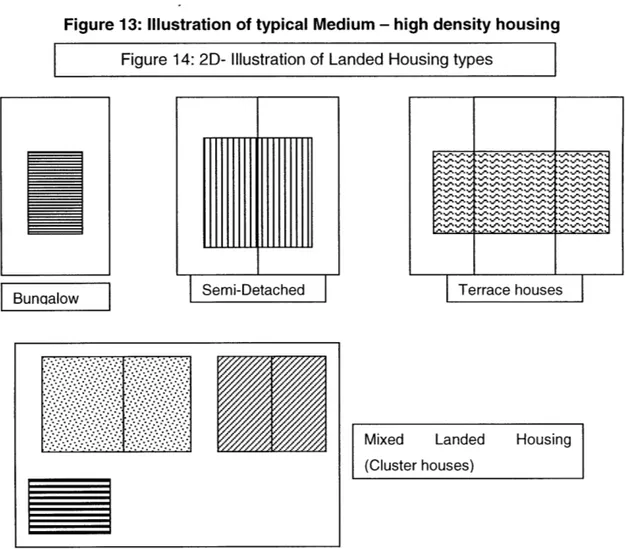
This sector has generally catered to the upper echelons of Singapore society and also the foreigners. Private housing comprises of condominiums and flats as well as landed housing (terrace, semi-detached and detached houses). The former are mostly strata-subdivided housing units, with the common areas owned and managed by a Management Corporation. Hybrid housing forms such as townhouses, cluster housing and strata-bungalows also come under the strata-subdivision arrangement. Landed housing can range from terrace houses on house plots as low as 150 square meters to
gives details on the characteristics of each housing type. A free-standing house usually with garden. detached [SD] A pair houses attached along common party wall. Terrace house [TH] Row houses of 3 or more units. landed [ML] A few houses within a plot that could be combination of any 3 of the other landed housing forms. [-A,,P... [APT] Multi-family units that have land area of less than 4,000sq meters.
Usually Restricted to Singaporean and permanent residents only.
[EC]
Hybrid of public and private housing but has regulated
eligibility and resale rules.
Multi-tamily units that has land area of more than 4,000sq meters Foreigners are eligible. ' '
Figure 13: Illustration of typical Medium - high density housing Figure 14: 2D- Illustration of Landed Housing types
I
L
---
Z
Terracehouses-Mixed Landed Housing (Cluster houses)
2.4 Performance of private residential market since 1975
In Singapore (Ng 2002), the private residential investment accounted for 5.8 per cent of Singapore's real GDP and 17 per cent of gross fixed capital formation between 1990 and 2001. In fact, private sector investment in residential buildings constituted 66 per cent of overall residential building investments (based on 1990 prices) over the same period, despite the fact that 88 per cent of resident households were living in public housing estates in 2000.
Private residential property market is driven primarily by market demand and supply (although it is subjected to government regulations and, to some extent,
Ng Hui Meng (2002) 'ECONOMIC SURVEY OF SINGAPORE - (FIRST QUARTER 2002)' Ministry of Trade and Industry
competition from public housing). Figure 15 shows that private property prices index have been on an upward trend since 1975, with strong underlying relationship between property prices and real GDP.
However, in the periods 1980-1983 and 1993-1996, property prices had overshot the fundamental trend driven by GDP. Private property prices rose by 24 per cent per annum between 1980 and 1983, due partly to the relaxation of rules in 1981 to allow the use of Central Provident Fund (CPF) savings to purchase private properties. Property prices were also fuelled by a surge in foreign capital inflows, some of which went into property investments. Together with the strong economic growth at the time, these factors led to a rising demand for private residential properties and a shortage of housing units.
Figure 15: Relationship between Real GDP and private property price index
160,000 180 140,000 160 120,000 - 140 120U 100,000 --CO 1 00.o 80,000 -! 80 6 60,000-- 0. 5 0- 60 -40,000-4 0, 40 20,000 20 0 -0 Year 1976 1978 1980 1982 1984 1986 1988 1990 1992 1994 1996 1998 2000 -n- Real GDP (S$m) -- RPPI Source: Residential
Fuelled by a demand boom in the residential property market, construction
Property Prices and National Income', Economic Survey of Singapore, First Quarter 2001, pp 49-51
activities grew by a remarkable 25 per cent per annum in the period 1980-84. This contributed on average 1.8 percentage points to real GDP growth each year. However, the construction frenzy resulted in a property glut between 1983 and 1986, when new supply exceeded new demand. With the slowdown in real GDP growth and the subsequent economic recession, property prices started to collapse in 1984, continuing its decline till 1986. The sudden downturn of the construction sector after several years of high growth was identified as one of the causes of the 1985 recession (Figure 16).
Since the mid-1980s, private residential property prices had been rising steadily. In the boom years of 1993-96, prices in the residential markets escalated, driven by strong income growth, bullish stock market performance, ease of obtaining financing through banks, and property speculation (which was common not only among Singaporeans but also foreign buyers as well).
Figure 16: Vacancy Rate, change in Supply and Demand of private residential units.
Source: URA web site www.ura.gov.sq
What was most troubling about the property market fever was the sharp increase in housing loans, particularly the easing of financing terms. A survey of banks conducted in the housing loan market found that 55 per cent of housing loans provided more than
80 per cent financing in 1995. Such high level of financing did not provide banks and finance companies sufficient cushion to absorb losses in the event of a decline in
property values and the inability of borrowers to service their loans. This affects the quality of loan portfolios and undermines the soundness of Singapore's financial system. In May 1996, the government imposed anti-speculative measures to prick the property price bubble which was mainly supported by speculators and investors, rather than genuine homeowners.
Subsequently, the Asian financial crisis and a recession in 1998 further weakened the property market, as prices bottomed out in 1998 to 1994 levels. A brief period of recovery was experienced between 1999 and early 2000 as the overall economy experienced strong growth. But prices started to drop again in late 2000 with the collapse of the tech bubble, lackluster performance on the local stock market and the global economic malaise.
3. Singapore land market
3.1 Restrictive Land Supply
Singapore has a restrictive land policy similar to Hong Kong (Wheaton 1994). As a city-state, Singapore has a fixed boundary of territorial land area. Other than this restriction on the eventual land supply, the flow of new land available for residential development is directly controlled by the Singapore government. The government decides when and how much new land will be put on the market as well as the uses allowed on this land. This is done primarily through the sale of state land to private developers by tender or auction process.
With limited territorial land and a shrinking private land bank especially after 1989, Singapore government has directly intervened in the private residential land market. This is most evidence between 1994 and 1997 where the government response to the escalation of private house prices by intensifying the release of residential land parcels for bidding by private sector to stabilize supply of housing units (Lum 1996).
Land Acquisition Policy
Due to the extreme scarcity of land in Singapore, the price of land rises very quickly in the early 70s. To allow the authorities to acquire land quickly and cheaply for housing purposes, the Land Acquisition Act set up in 1967 was passed to enable the government to compulsorily acquire private land for public housing or other development programs. The 1966 Land Acquisition Act enabled the government to acquire any land that is deemed necessary in the interest of national development, with the rate of compensation determined by existing use or zoned value, whichever is lower.
Through this legislature, the state was able to amass substantial amount of close
'0 Wheaton, C.W and Peng, Ruijue (1994) 'Effect of restrictive Land Supply on Housing In Hong Kong: An Econometric analysis', Journal of Housing Research Vol.5 Issue 2 pg263-291
" Lum, Sau Kim (1996) "Housing Market Dynamics in Singapore: The Role of Economic
Fundamentals and Restrictive Land Supply", PHD dissertation, UC Berkeley Fall 1996
12 Phang, Sock Yong (1999) "Urban Transportation and Land Regulations in Singapore, World Development report,Second East Asian workshop in Singapore January 12-13, 1999
to 90% of the total land area today (Pang 1999). About three quarter of the acquired land bank has been put into the public housing development while the rest for urban renewal and also public infrastructure project such as the mass transit line, industrial estates, and 99-year leasehold land use rights of these lands were also tendered or auctioned for private residential developments.
- Land use policy
The other mechanism that regulates land supply and its price is the strong regulatory control on land use and allowable plot ratio. Urban Redevelopment Authority (URA) carries out strategic planning to ensure the best use of land. Singapore has a total area of 647.5 sq km and the challenge is to ensure the best and optimal use of this limited land. However, planning means more than just safeguarding land for the future. It means having development blueprints to stimulate Singapore's economic growth and improve the quality of life for all Singaporeans.
This is achieved through a two-tier system of plans comprising the Concept Plan, the Development Guide Plans and an efficient development control mechanism.
Concept Plan 1991 and 2001
At the apex of the planning and development process is the Concept Plan, which sets the long-term strategy for Singapore's physical development. The Concept Plan serves as a strategic comprehensive plan to guide the use of land in the long term. The Concept Plan, first developed in 1971 and fine-tuned over the years, has guided Singapore's infrastructural, transportation and economic growth. The latest review of the Concept Plan 2001 has just been completed and it will set the broad development strategy for Singapore for the next 40 to 50 years to meet the needs of a projected long-term population of about 5.5 million.
One of the key strategies to meet this increased housing demand was to increase the density of housing within existing new town. Today, the public housing is generally built at a density of 2.8 plot ratio (ratio of gross floor area to land area) and no more than 30-storeys. More recently, some developments have already been built up to 4.0 plot ratio and 40-storys at selected locations, such as Toa Payoh.
Development Guide Plans (DGPs)
The DGPs form a second layer of plans that translate the broad proposals of the strategic Concept Plan to detailed proposals at the local level. From the Concept Plan, the planning intention for individual plots of land is translated into a detailed Master Plan. The Master Plan is reviewed every 5 years and it is a gazetted, public document backed by the law. As the Master Plan forms the basis for all development control decisions, it provides businesses with the certainty crucial to business ventures and investments. The Master Plan also provides transparency and stability in the planning system.
In total, fifty-five DGPs will be prepared for the entire country, each one setting out the planning vision for the specific area, and providing guidelines on land use, plot ratio allowable (density), building height, road system, open space to guide both public and private sector development. Each DGP addresses housing needs, as well as community, commercial, industrial, transport and recreational facilities for the population of each area. In all, a total of 55 DGPs will combine to form the overall Master Plan, guiding the detailed development of Singapore.
Development control
The detail master plan enables Singapore to execute effective development control system to regulate land use and development. URA is also responsible for granting planning approvals for private, government and statutory board developments.
In the evaluation of development proposal, URA would evaluate the proposal with respect to the Master plan allowable land use, plot ratio, storey height and other control such as setback, road buffer etc to facilitate orderly development according to the planning intentions as stipulated in the Master Plan and the prevailing control parameters. At the development proposal stage, the plot ratio (i.e. floor area ratio) becomes a dominant measure on the intensity of the land usage that is regulated by the Master plan. Development regulation such as capping the maximum allowable plot ratio (i.e. floor area ratio) for a site would have impact on land prices.
3.2 Land Tenure
About 90% of the total land area of Singapore is owned by the government and its statutory boards. While some are reserved for the various government ministries to discharge their national functions, e.g. education or defense, the remainder is sold to either the various statutory boards or the private sector on mainly leasehold interests up to 99 years. The various government ministries and organs of State use almost two-thirds of State lands.
As a former British colony, the two main types of property title are freehold and leasehold estates. Freehold estates form a small minority of private land holdings in Singapore and are no longer granted by the government. Leasehold is the primary form of land ownership in the country. Leasehold estates are granted by the government, typically for 99-year terms. All HDB public housing owners in Singapore are on 99-year leasehold. That makes up about almost 90% of the total housing stock. This leasehold arrangement separates the housing unit from the land and allows the government to compensate and resettle any lessee if and when the land may be required for development. All government sales sites are also on 99-year leasehold.
3.3 Sales of Sites (SOS) Program
Land sales program provided by the government started in 1967. Since then, it has been the only source of land from the State with dwindling supply of private land. Today, it is the largest source of land supply for all development.
Objective of SOS Program
a) An innovative way of forging partnerships between the Government and the private sector: the Government puts out the land and the private sector provides the financial resources and creative ideas to develop the area;
b) An implementation strategy that ensures that the planning visions are realized since every plot of land is sold with a planning parameters and sometimes urban design requirements. Among the notable examples of redeveloped areas are to sell high density residential sites that converted Tanjong Rhu from a shipyard into a quality waterfront residential area;
c) A means of direct supply to ensure steady release state land supply, and avoid causing big fluctuations in property prices or inefficient speculations.
Currently, there are 3 agents of the SOS program, Housing Development Board (HDB), Urban Redevelopment Authority (URA) and Jurong Town Corporation (JTC). All these agents are appointed by the State to sell state land to private sector. HDB usually sells pockets of land within the HDB new town while JTC sells vacant industrial land to industrialist to build their manufacturing or warehousing plants. URA acts as agent for the State in carrying out land sales for commercial, hotel, private residential and industrial developments. As one of the pioneer and largest land sales agents for the Government, URA releases a steady supply of land for sale to the private sector - a supply which helps to sustain economic growth, and ensures that housing, social, leisure and commercial amenities are provided for. In addition, URA also sells sites for special uses e.g., heavy vehicle parks, conservation shop houses and recreational developments.
Over the past three decades, URA has released 1,345 land parcels, totaling 797 hectares through the Government Land Sales Program. The properties built on these land parcels contributed 35 per cent of Singapore's total commercial space, 39 per cent of the total stock of hotel rooms and 26 per cent of private housing.
3.4 Sales Process
State land sites are usually sold on 99-year leases for commercial, hotel and private residential development, whereas leases for industrial sites are usually for 60 years. The lease tenure for other types of sites varies depending on the uses.
All the sales sites were sold with pre-designated land use and allowable plot ratio. They are sold free of encumbrances and are ready for immediate development. The standard caveat on the lease included a pre-committed completion date (usually 3-5 years) whereby penalty would be levied if the development is not completed by then. These caveats prevent land speculation with holding of land and ensure that the development takes place within a specific time frame to coordinate with the development strategy of the area and also the infrastructure provision such as road network and
public utilities.
The usual sale method is through public tender or First-Price Sealed-Bid Auction system where all bidders simultaneously submit confidential bids on pieces of papers. The site is awarded to the highest bidder. However, small residential land parcels and conservation shop houses are also sold by public auction in the recent years.
Since 1 July 2000, a new land sale approach has been adopted - Reserve List method, whereby sites are launched for sale only if developers indicate interest in them. In brief, if a developer is interested in asking for a site on the reserve list to be put up for sale, he could submit a minimum bid price to the land sales agent. The accepted minimum bid will be made public before the site is launched for sale. At the close of tender, the applicant would be awarded the site if he is the highest bidder else.
3.5 State Land Pricing Approach
For each sales site, the Chief Valuer at the Inland Revenue Authority of Singapore sets a minimum price called the 'reserve price', based on recent transactions. The site is awarded as long as the bid does not fall below 85 per cent of this figure. The 'reserve price' is maintained as state land is part of the nation's reserves and the government reserves the right not to sell state land at below market value.
Under the present system, the Chief Valuer calculates the market value of state land earmarked for residential use by combining two valuation methods. First, he looks at the sale of small plots of state land located within the neighboring estates to the private sector through public tender. He uses the prices paid in these instances as benchmarks.
Chief Valuer also uses the sale prices of flats in the vicinity and works backwards to get a residual value for the land. Starting with the expected selling prices of all the flats to be built on a certain plot, he then deducts the costs of financing and building them. The figure he is left with is called the residual value for the land.
Since the land supply in Singapore has been strongly influenced by non-market forces, the purpose of our study was to understand the determinants of the market land values in a dense and regulated land market such as Singapore.
4. Literature review and synthesis
4.1 Definition of land value/ price
Land price has been commonly used interchangeably with land value as price is a reflection of the value of the land that a developer would place on the use the land could be put into. The underlying concept is that a buyer is going to build something that will be sold in the market, and a feasible land price is determined by the difference between the anticipated future proceeds from the sale and the cost of the project and the required profit.
4.2 Previous studies
4.2.1 Relationship between housing and land price
There were many studies on the end product of residential land -housing. Many authors such as Cao (1997), Pollakowski (1997), Scott (1999) has investigated hedonic, repeat-sales approaches of residential pricing. There is also a wide range of literature that studied various locational, structural, neighborhood, buyers and sellers attributes that influence house prices.
Housing is unlike most other commodities. It is made up of a complex bundle of goods and services that extend well beyond the shelter it provides. Wilkinson (1973) makes the distinction between dwelling specific or structural attributes and location specific attributes. The former pertaining to the physical structure of the property, whilst the latter are concerned with the property's location.
The demand for land is derived from the demand for the output (housing) that
13 Cao, Yong & Chee, Meng On (1997) The price structure of private property in Singapore Nanyang Business School, Nanyang Technological University Singapore
14 Henry 0. Pollakowski and S..M Wachter 1997, Frequency of Transaction and House Price Modelling,
Journal of Real Estate Finance and Economics, 14,173-187
1 Scott Orford (1999) Valuing the Built Environment - GIS and house price analysis, Ashgate Publishing Ltd, England
16
Wilkinson, R.K (1973) "Measuring the determinants of relative house prices", Environment and
can be put on the land. Yu (2001) highlighted that land is an important factor of production as it contributes as much as a 50% to the total project cost in Singapore. Meikle (2001) has found that the price of land in UK, the most significant non-construction element of house prices, has risen at a faster rate than house prices and a much higher rate than construction prices.
The relationship between the land market and the output market is sort of a chicken-and-egg question. Sullivan (1993) concluded that price of a particular piece of land is high because the demand for housing (and the demand for land on which to build housing) is high. The high price of land is the result -not the cause- of high housing prices.
Wheaton (1994) highlighted that empirical research has conclusively established that shortage of urban land supply such as that in Hong Kong will raise metropolitan housing prices. In the absence of legal or zoning restrictions, higher housing prices can induce additional housing output through capital land substitution without increased input of land. In Hong Kong, the shortage of land has caused higher housing prices but not lower housing output. The shortage of land increases the expected higher rents, which is capitalized into higher housing prices. High housing prices then encourages capital land substitution in housing production and result in an increase of housing output. As such, zoning or plot ratio restriction are deemed important characteristics when considering the determinants of land value.
4.2.2 Researches on determinants of land value
There have been many studies about the factors that contribute to the changes in land prices. In the case of land, site- (location) specific characteristics predominate in
17 Yu, Shi Ming & Cheng, Fook Jam (2001) "Determinants of Residential Land Value in Singapore", presented at World Valuation Congress IX(April 2001)
18 Meikle, James( 2001), "A review of recent trends in house construction and land prices in Great Britain Construction Management and Economics" London; Apr/May 2001, vol. 19 (3), pg259-265
19 Sullivan, A.O (1993) "Urban Economics", Richard D Irwin, INC 1993,second edition pg 192-194
20 20 Wheaton, C.W and Peng, Ruijue (1994) "Effect of restrictive Land Supply on Housing In Hong Kong: An Econometric analysis", Journal of Housing Research Vol.5 Issue 2 pg263-291
determining the market price of land. Attiat (1998) shows that pricing land is like pricing goods with mixed attributes. Land is a composite or heterogeneous good. Land has characteristics reflecting not only its location but also other amenities such as the quality of neighborhood and infrastructure. In an exchange economy, the purchase and sale of land parcels of different characteristics establish "implicit" prices for these characteristics.
Earlier research of Adams, Milgram, Green, and Mansfield (1968) developed models to explain residential, commercial and industrial land values (price per acre) as development occurred in Northeast Philadelphia. They tested hypotheses relating to variables for accessibility, state of land (crude proxies for time to expected development), zoning, and plot or property characteristics (size, waterfront location, railroad siding, etc.) They found evidence that several accessibility variables were statistically significant in the residential model, such as distance and travel time to the CBD (negative), distance from a major commercial boulevard (negative) as well as a premium for a location on the commercial boulevard. Distance from public transportation was negatively related to land value. Higher density residential zoning increased land prices relative to single-family zoning.
Guntermann (1997) demonstrated that expectations about the future, as well as many other factors, contribute to changes in land prices. Hushak (1975) identified parcel size, accessibility, zoning, and property taxes as factors explaining variations in the price per acre of urban-rural fringe land surrounding Columbus, Ohio. A follow-up study by Hushak and Sadr (1979) expanded the model and tested it on other land markets with similar results. Chicoine (1981) confirmed the importance of parcel size, accessibility and zoning as well as neighboring land uses on the price of land south of Chicago,
21 Attiat F Ott; Kamal Desai (1998) Land reform: Restitution and valuation in the Republic of Estonia, Assessment Journal; Chicago; Sep/Oct 1998;
22 Adams, F., G. Milgram, E. Green, and C. Mansfield, Undeveloped Land Prices During Urbanization: A Micro-Empirical Study over Time, Review of Economics and Statistics, 1968, 1:2, 248-58
23 Karl L Guntermann (1997) "Residential land prices prior to development ", The Journal of Real
Estate Research; Sacramento; vol 14, issue 1/ 2, pg1 -171997
24 Hushak, L., The Urban Demand for Urban-Rural Fringe Land, Land Economics, 1975, 51:2, 112-23.
25 Hushak, L. and K. Sadr, A Spatial Model of Land Market Behavior, American Journal of Agricultural Economics, November 1979, 61, 697-702.
26 Chicoine, D., Farmland Values at the Urban Fringe: An Analysis of Sale Prices, Land
Illinois.
Ling (1998) identified several factor that included amount of commercial and industrial land, employment in the urban districts in which the sites are located, density and population density per square kilometer in the respective urban district in which the site is located, site area and distance in kilometers of the site from the Bund (the central business district of Shanghai).
The most recent works of Isakson (1997) concluded that factors influencing land value include plot size, location, date of transaction and zoninq. The study also confirms the presence of the plattage effect i.e. the negative relationship between price per unit area and lot size. Bible and Hsieh (1999) uses 150 land sales transacted from 1984 to 1995 to conclude that other than land size, distance to CBD and population size of the region together with zoning could explain variations in land values. Yu (2001) concluded in his paper that in Singapore, the plot ratio and land area are significant factors that explain the variations in residential land prices.
27 Ling Hin Li (1998) Applying the DCF model in China's transitional market The Appraisal Journal; Chicago; Jan 1998;
Isakson, Hans R, 1997 "An Empirical analysis of the determinants of the value of vacant land", The
iournal of Real Estate Research, Sacramento, Vol. 12, issue 2 pg 103-114, 1997
Bible D.S and C. Hsieh, 1999 " Determinants of Vacant land values and Implications for Appraisals, The Appraisal Journal , Vol. LXVII no 2, 264-268
30 Yu, Shi Ming & Cheng, Fook Jam (2001) "Determinants of Residential Land Value in Singapore", presented at World Valuation Congress IX(April 2001)
4.3 Synthesis and Hypotheses formation
The hypothesis was formulated in 3 steps:Step 1: Housing price determinants
Housing = f(structural physical + locational + neighborhood price characteristics characteristics qualities)
[i.e. cost of the physical [I.e. cost of the locational [I.e. cost of the structure such as no of attributes the land brought neighborhood externality, bedrooms, age of building] about, such as proximity such as a high class
to expressways] neighborhood]
Housing price is based on how much one values its structural attributes and locational attributes (Scott Orford 1996). Land price is the greatest cost component in housing pricing and it is indirectly compensated through housing purchases.
Step 2: Land Price is a residual from housing prices.
Land price = f (plot characteristics + locational characteristics + neighborhood qualities)
In a competitive market, land prices represent the residual of housing prices and other capital cost. Deducting all the cost of the structural attributes that are intrinsic to the housing unit itself, what is left is the value of the land. Since land price is a residual from housing price, the land will absorb all the anticipated location rent as the city grows. The land price should then be a function of locational and neighborhood characteristics. The plot characteristics such as the plot sizes, topography and configuration of the site also become an important determinant of land value.
Scott Orford (1999) Valuing the Built Environment - GIS and house price analysis, Ashgate Publishing Ltd, England
Step 3: Land Price should also include expected growth in locational value.
Land price = f (plot characteristics + locational characteristics + neighborhood qualities + expected growth in locational value)
The 3 component of land prices (Wheaton 1996) is made up of
- The agriculture value i.e. discounted value of the perpetual agriculture rent value; Not applicable to urban land market in Singapore with less than 2% agriculture land.
- The current location value i.e. the discounted value of the current commuting cost saved;
And
- The future growth in location value i.e. the discounted value of expected increases in location rent on sites already developed - the development potential of the land.
For the third component, the development potential of the land in Singapore is reflected on the Master Plan. In Singapore, development rights in land are regulated with little room for the private housing developer to vary the timing and/or the intensity of development. The allowable zoning and density have been pre-destined in the public plan for transparency. Rarely does the planning authority allow variance from the plan as the plans are tightly coordinated with infrastructural planning.
Also state land are sold to private developer with a predetermined completion date of about 2-3 years from the date of sale at designated maximum plot ratio and land use. Any increase in plot ratio or changes in land use from the lease caveat would be subjected to the payment of differential premium (i.e. additional land premium for the enhancement of land value). Once the site has been sold and building permission granted, construction would commenced and expected to be completed within the specified period. Also all these state lands sold are on 99-year leasehold and developers would have no advantage from waiting for additional information before deciding the specifications of the residential project. As such, this component of land price
32
Wheaton, William & Dipasquale (1996)" Urban Economics and Real Estate Markets" Prentice Hall 1996, chp 3, pp53-56
(development potential) could be attributed to the allowable zoning and density parameters.
Summary
Land price = f (plot characteristics + locational characteristics + neighborhood qualities + zoning and plot ratio entitlement)
Most studies draw similar conclusion that variables relating to the plot characteristics (size etc), accessibility and zoning were possible determinants of residential land values. Most of these empirical studies were based on US or UK context. But these factors need to be examined within the specific economic, social and political context in the area of study. Different political or institutional system would have significant bearing on the determinants of residential land value in different cities. In a dense and highly regulated land market as Singapore, the impact of the zoning and plot ratio and all other traditional determinants would be important variables in determination of the residential land value. It is the purpose of this study to model these variables to investigate if they have similar significant impact on the variations of the residential land value in Singapore.
5. Operationalization of hypotheses
The purpose of this study is to test various hypotheses relating to accessibility, zoning and plot characteristics and their capitalization into land prices. Since the dependent variable is the individual land values, the independent variables that may be reflected in land values would include those factors that have a more limited or micro geographic effect. These independent variables presumably could explain much of the difference observed across residential land prices within Singapore at any point in time. In order to test the hypotheses, measurable variables would be used to operationalize the hypotheses. The independent variables chosen are categorized into
* Locational Variables * Zoning Variables * Plot variables
5.1 Locational variables
These accessibility variables represent the most important measure of location in the hedonic models. Traditionally, it represented the measurement of bid-rent curve proposed in micro-economics literature. For the purpose of this study, the locational variables are measured by the distance from three nodes - Mass Rapid Transit (MRT) Station, access ramp to the nearest expressway and Central Business District.
- Walking Distance to the nearest Mass Rapid Transit Station
In Singapore, the mass rapid transit is a popular mode of public transportation. Figure 17 gives an overview of the comprehensive MRT network. It is the predominant mode of transport with a modal split (public transport usage - bus and MRT) of 65% for work trips and 51% for all trips. The mass rapid transit stations are usually at the centers of satellite town and they are also amenity nodes where neighborhood shops, bus terminals, schools, recreational facilities and eating establishments congregate. This variable is a proxy for accessibility to public transport and public amenities. As a pull factor, the distance from MRT is expected to have a negative relationship with land