for In-Core Fuel Management Using MCODE
The MIT Faculty has made this article openly available. Please share how this access benefits you. Your story matters.
Citation Romano, Paul K., Benoit Forget, and Thomas H. Newton, Jr.
"DEVELOPMENT OF A GRAPHICAL USER INTERFACE FOR IN-CORE FUEL MANAGEMENT USING MCODE." Advances in Nuclear Fuel Management IV (ANFM 2009) Hilton Head Island, South Carolina, USA, April 12-15, 2009, American Nuclear Society, LaGrange Park, IL (2009). p.1-13.
Publisher American Nuclear Society
Version Author's final manuscript
Citable link http://hdl.handle.net/1721.1/77152
Terms of Use Article is made available in accordance with the publisher's policy and may be subject to US copyright law. Please refer to the publisher's site for terms of use.
DEVELOPMENT OF A GRAPHICAL USER INTERFACE FOR
IN-CORE FUEL MANAGEMENT USING MCODE
Paul K. Romano and Benoit Forget
Massachusetts Institute of Technology Department of Nuclear Science and Engineering 77 Massachusetts Avenue, Cambridge, MA 02139
Email: [email protected], [email protected]
Thomas H. Newton, Jr.
Massachusetts Institute of Technology Nuclear Reactor Laboratory 138 Albany Street, Cambridge, MA 02139
Email: [email protected]
Keywords: In-core fuel management, graphical user interface, MCODE, Python
ABSTRACT
In the present work, a graphical user interface is developed to automate in-core fuel management using MCODE, an MCNP-ORIGEN linkage code. Data abstraction is achieved by means of five object classes that define the run, fuel assembly locations, fuel assemblies, fuel paths, and materials. The GUI and an associated fuel management wrapper were developed in Python, with the PyQt extension being used for GUI-specific features. To validate the fuel management wrapper, a model of the MIT Reactor core was used to run an equilibrium core. The results show that the wrapper performs reliably. Together, these tools will help the staff at the MITR perform in-core fuel management calculations quickly and with a higher level of detail than that previously possible.
1. INTRODUCTION
For many years, physics-based simulations of nuclear reactor designs have been performed using deterministic methods validated by experimental measurements. As high-performance technical computing continues to improve over time, the feasibility of using Monte Carlo methods in lieu of deterministic methods is becoming more attractive thanks to their accuracy and ability to easily model complex geometries. However, as analysts using Monte Carlo methods try to model increasingly complex physical effects such as material depletion through time, the burden of setting up a problem of interest also increases.
The present work details the development of a graphical user interface (GUI) designed to automate much of the work effort that goes into performing in-core fuel management. For such calculations, the GUI interfaces with the MCNP-ORIGEN linkage code MCODE1. Recent improvements2 in MCODE allow control device movement to be explicitly modeled at each timestep, and fuel management operations wherein materials are moved from one region to another can also be specified.
1.1 The MIT Reactor (MITR)
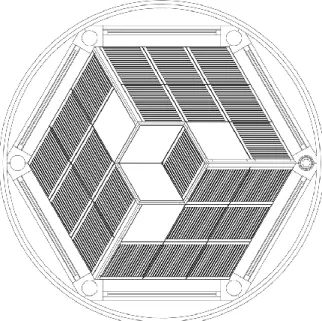
The MITR contains a hexagonal core that contains twenty-seven positions for rhombus-shaped fuel assemblies (colloquially called fuel elements) positioned in three radial rings (A, B, and C) as shown in Fig. 1. The reactor is currently licensed to operate at 5 MW with an up-rate to 6 MW expected soon. Typically, at least three fuel positions are occupied by either an in-core experimental facility or a solid aluminum “dummy” element to reduce power peaking. The remaining positions are filled with standard fuel elements. Each rhombus-shaped fuel element currently contains fifteen aluminum-clad fuel plates with HEU (93% enriched) in an aluminide cermet matrix. The core is light-water moderated and cooled and is surrounded by a D2O reflector. Beyond the D2O reflector, there is a secondary graphite reflector. Boron impregnated stainless steel control blades are located at the periphery of the core on each of the sides of the hexagon.
Fig. 1 Cross-sectional view of an MCNP model of the MITR core.
Due to proliferation concerns, there is a desire to limit the use of HEU in civilian facilities, and thus the few remaining civilian reactors that employ HEU are looking to convert to LEU fuel. While this would not have previously been possible for a small, high power-density core like the MITR due to the inability to achieve criticality using LEU fuel, the prospect for the successful development of high density LEU fuels may make such a conversion possible without a significant reduction in performance parameters.
To ensure that safety margins are met both during and after the transition from a HEU core to a LEU core, it is necessary to perform detailed burnup modeling. This is complicated by the fact that the entire core will likely not be replaced all at once, i.e. several LEU fuel elements will be introduced in each cycle until all the HEU fuel elements have been removed. While our original intent was to perform fuel management calculations using the REBUS-PC diffusion theory code, continuing difficulties in obtaining reasonable multi-group cross-sections led us to ultimately choose to use MCODE with the added burden of developing fuel management capabilities.
As the task of performing detailed in-core fuel management calculations entails setting up huge input files due to the hundreds of separate depletion nodes, doing such a calculation manually is cumbersome and thus prone to human-error. To automate these calculations, two separate pieces of software have been developed. The first is a graphical user interface that allows the user to define all the data in the runs (fuel paths, material compositions, reactor power, depletion times, etc.). The second is a fuel management wrapper which reads the user data from the GUI, creates and runs an MCODE input file for each cycle, and handles the transfer of data between cycles.
Section 2 discusses the abstraction of data which directly influences the development of the GUI. Section 3 describes the graphical user interface, focusing on how the user interacts with it. Section 4 discusses development of the fuel management wrapper. Validation of the code is documented in Section 5. Finally, some conclusions regarding the use of the GUI and fuel management wrapper are presented in Section 6.
2. DATA MODEL AND ABSTRACTION
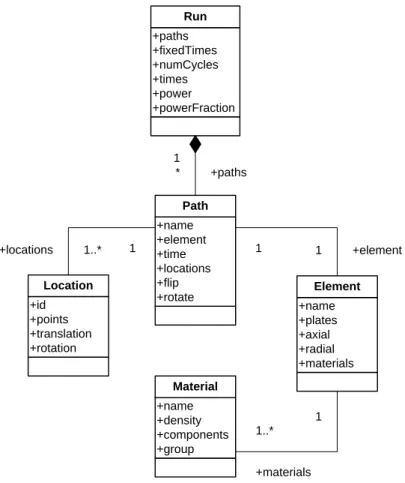
To meet the goal of an interface that would be applicable to more than one reactor type, an object-oriented approach was taken whereby the data and its‟ associated procedures are abstracted. The data model consists of five main classes: Run, Path,
Element, Material, and Location. The Run class is the top-level class that holds all the
data pertinent to a fuel-management run. An instance of the Path class contains information on an individual fuel assembly path, i.e. the physical path that a fuel assembly takes as it is depleted and moved through the reactor, and specifies which fuel element is to be used at the start of path. An instance of the Element class defines a single fuel element, the radial and axial mesh that subdivides the element into separate depletion nodes, and the materials to be used for each depletion node. The Location class describes a fixed physical location that a Path may occupy at any given time. Lastly, the Material class describes a physical material and its constituents.
We summarize the relations between the classes as follows. A fuel Element is assigned to beginning of each fuel Path. Each depletion node in an Element contains a
Material. Additionally, a Location is specified for each cycle in the fuel Path. These
associations are summarized in Fig. 2, a Uniform Modeling Language (UML) class diagram.
+id +points +translation +rotation Location +paths +fixedTimes +numCycles +times +power +powerFraction Run +name +element +time +locations +flip +rotate Path +name +density +components +group Material 1 +paths * 1 1 +element +locations 1..* 1 +name +plates +axial +radial +materials Element 1 +materials 1..*
Fig. 2 UML class diagram for the data modeling of a burn-up run.
We note an important distinction between the classes used in the graphical user interface and those used for the fuel management wrapper. When the burnup run is performed using the fuel management wrapper, every depletion node of each fuel element has a unique material such that even fuel paths that have the same fuel element are still defined by distinct materials. Thus, there is no need for a separate Element class in the data model for the fuel management wrapper.
3. INTERFACE DEVELOPMENT
For the development of the graphical user interface, the Python programming language was chosen thanks to its easy learning curve, conciseness, code readability, and cross-platform portability. There are existing instances of others in the nuclear industry using Python for GUI development, e.g. the work of Touran4. Many Python extensions exist for the specific purpose of GUI development. The GUI widgets were implemented using the PyQt extension, which provides Python bindings for Qt, a popular GUI toolkit that has been used in many high-profile projects.
The GUI source code is divided into nine different modules as follows:
pathEditor.py: Dialog window to edit a fuel path
elements.py: Dialog window to edit a fuel element (and Element class
definition)
materialEditor.py: Dialog window to edit a material
materialDialog.py: Dialog window listing all materials in the problem timeDialog.py: Dialog window to define the cycle times
paths.py: Defines the Path class
materials.py: Defines the Material class geometry.py: Defines the problem geometry
Together, these modules combine for a total of about 1800 lines of source code.
To set up a run, the user would first need to define the cycle times, i.e. the times at which fuel is to be introduced, moved, or removed from the reactor. Then, the user would define the fuel elements and the materials that occupy each node in the element. Once all elements have been created, the user can define the paths and associate them with fuel locations and fuel elements.
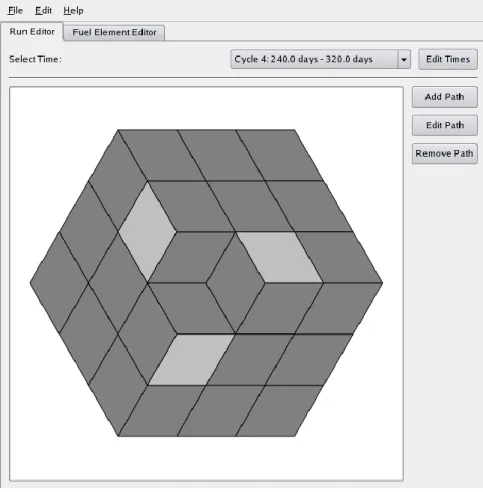
The main window, shown in Fig. 3, for the GUI contains two tabs: one for editing run data and fuel paths and another for specifying and editing fuel elements. The run editor tab displays a layout of the core for a given cycle where those positions shaded in dark gray are occupied by fuel assemblies and those in light gray by dummy assemblies. The user can select a fuel location and add a fuel path, edit an existing path, or remove an existing path. Above the core layout, the user can select the cycle from a drop-down box or click a button to open a dialog window to edit the cycle times, shown in Fig. 4.
Fig. 3 Main window for the graphical user interface.
Fig. 4 Dialog window for editing cycle times.
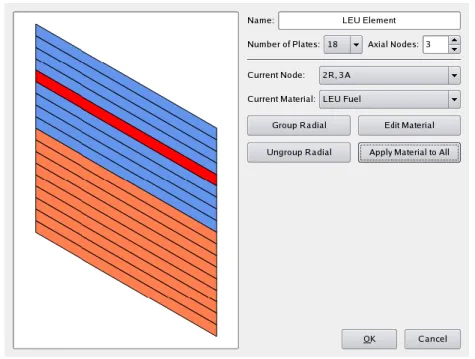
From the fuel element tab on the main window, the user can add, edit, and remove fuel elements. If the user chooses to add or edit a fuel element, a dialog window appears as shown in Fig. 5. From here, the user can adjust the number of axial and radial nodes. Since the fuel assemblies in the MITR have fuel plates, specifying a radial mesh allows multiple plates to share a single material that is depleted (grouped plates are displayed with the same color as in Fig. 5). This is ideal in locations where the power gradient is
small. The axial mesh subdivides each radial mesh node into equal segments. The user can select a particular node using the visual interface and the „Current Node‟ drop-down box and then apply a material using the „Current Material‟ drop-down box.
Fig. 5 Dialog window for specify the radial/axial mesh and assigning materials.
One option on the „Current Material‟ drop-down box is titled „New material…‟ and opens a dialog window when selected. The material dialog window, shown in Fig. 6, allows the user to define a material in terms of its density, isotopes, and the atom/weight percentage of each isotope.
Fig. 6 Dialog window for specifying a material composition.
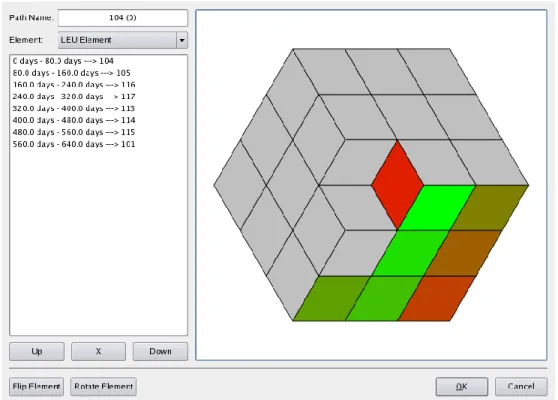
With all the fuel elements defined, the user can then begin to specify the fuel paths for the run. When a user chooses to add or edit a fuel path from the main window, a separate dialog window appears as shown in Fig. 7. From this dialog, the user simply clicks the fuel locations in the order that the fuel is to move from one to another. Additionally, the user can flip or rotate a fuel element at a certain cycle via the buttons at
the bottom left side of the dialog window. A fuel element can be assigned to the fuel path from a drop-down box.
Fig. 7 Dialog window for specifying locations in a fuel path.
Once all the fuel paths have been defined, the run is completely specified. At this point, the user can export the run to an input file that can in turn be read by the MCODE fuel management wrapper. The exported file is an ASCII file that is fairly “intuitive” to read. This makes it easy for the user to make small changes to the input file, e.g. changing materials or cross-sections, without having to do so via the graphical user interface. Of course, the GUI may be the preferred option for changing run data anyway.
4. FUEL MANAGEMENT WRAPPER DEVELOPMENT
There are generally two approaches one can take to perform fuel management operations*. The first approach, which was taken in our prior work2, is to swap material numbers in MCNP every time a fuel assembly is to be moved. This approach has the advantage that the geometry needn‟t be changed in the MCNP input file. However, the downside is that a single fuel assembly is difficult to track from cycle-to-cycle. Additionally, for a core such as the MIT Reactor (MITR) whereby dummy assemblies are utilized, it is not possible for the locations of the dummies to also move from cycle-to-cycle. Thus, it was decided to rather treat fuel management operations by changing the geometry of the MCNP input file for each cycle while keeping the material numbers of each assembly the same.
* By fuel management operation, we mean the physical movement of a fuel assembly from one in-core
While the earlier version of the fuel management wrapper was written in Fortran 90, we have opted again to use Python to maintain consistency with the graphical user interface, as well as for the reasons previously discussed. Python is particularly suited for this task as performing fuel management operations entails creating and manipulating text files and moving data to and from files.
The logic behind the fuel management wrapper is rather simple. First, the wrapper reads the input file exported from the GUI. Based on this, it creates an MCODE input file with the appropriate geometry and places it in its own directory. The wrapper then calls MCODE and waits for the run to finish. After it has finished, the wrapper updates the material compositions of each depletion node based on the MCODE output. With the new material compositions and fuel path data at hand, a new MCODE input file for the next cycle can be created, placed in a new directory, and run. This process is repeated until all the cycles have finished.
In order for this process to work properly, it was necessary to make a small change in MCODE. As time progresses in an MCODE run, MCNP does not track all the isotopes that ORIGEN does because many isotopes are not important as far as neutron absorption rates are concerned and not all ORIGEN isotopes have corresponding MCNP cross-section libraries. Normally, at the beginning of an MCODE run, the only isotopes present in the problem are completely specified by the MCNP data. For our purposes, at the beginning of a new cycle, we want to retain all the ORIGEN isotopes in each material from the previous cycle. MCODE was modified to be able to distinguish whether a material is “fresh” or whether ORIGEN data is already present, i.e. the material has been burned.
5. VERIFICATION AND VALIDATION
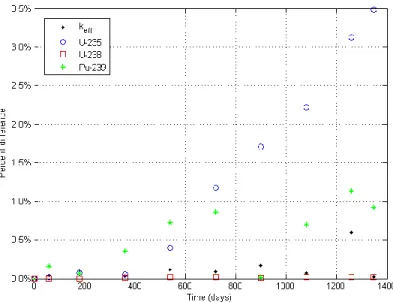
Since MCODE was actually modified to be able to perform fuel management calculations, it is instructive to ensure that the changes give the desired result. As a test, a simple pin-cell was burned in MCODE for 1350 days for two cases. In the first case, all timesteps were run using one MCODE input file. In the second case, an MCODE input file was created for each timestep with material compositions and ORIGEN isotope data files taken from the previous timestep. The percent difference between the multiplication factor and isotope concentrations in the two cases is shown in Fig. 8.
Fig. 8 Difference between multiplication factor and isotope concentrations for two test cases.
While the difference between the U-235 concentrations in the two cases steadily increases with time, one must consider two important facts when interpreting this result. Firstly, since the reaction rates are determined stochastically, running the same case twice may give different reaction rates. Hence, there is an associated uncertainty in the multiplication factor and the isotope concentrations that is not reflected in Fig. 8. In addition, the high burnup of a single pin-cell will result in a very low U-235 concentration over time and thus differences on the order of a few percent are actually negligible. This can be confirmed by looking at the U-235 concentration for the two cases as shown in Fig. 9.
With the MCODE changes validated, the next step is to ensure that the fuel management wrapper also performs as expected. To test the functionality of the wrapper, a 24-element core with all fresh LEU fuel was burned for 640 days with the fuel being moved in the same pattern every 80 days. At each cycle, the three fuel elements in the inner ring (A-ring) were removed and three new fuel elements were placed in the middle ring (B-ring). The dummy elements were placed in rotationally symmetric positions so that after eight cycles, the material compositions in the core would be close to their equilibrium values for this particular fuel pattern. A criticality search on the control blade height was performed at every timestep.
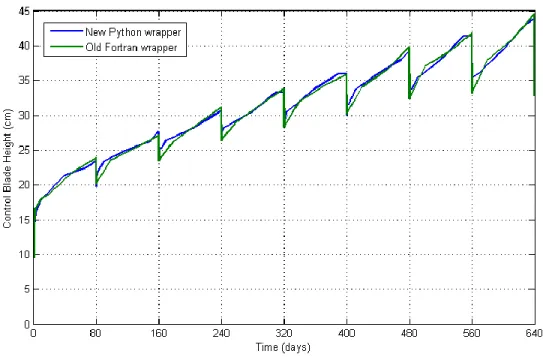
This particular case was also run with an earlier version of the fuel management wrapper written in Fortran that existed before the development of the GUI. As mentioned earlier, the methodology used for performing fuel management operations in the older version was to swap material numbers whenever fuel needed to be moved rather than changing the geometry. A comparison of the control blade height from this run using the Fortran-based wrapper and the new Python-based wrapper is shown in Fig. 10.
Fig. 10 Control blade height in LEU equilibrium core run for old and new fuel management wrappers.
There is a slight disagreement between the two wrappers towards the beginning of each cycle due to the use of longer timesteps in the run using the Fortran-based wrapper. However, the two wrappers do show excellent overall agreement. The behavior of the control blades is just as one would expect. At the beginning of each cycle when fresh fuel is introduced, the blades must be lowered to compensate for the positive reactivity from the new fuel but are quickly withdrawn over the course of the following three days to compensate for the buildup of equilibrium Xenon. The overall trend shows the transition from the fresh core at time zero to the near-equilibrium core at the end of the run.
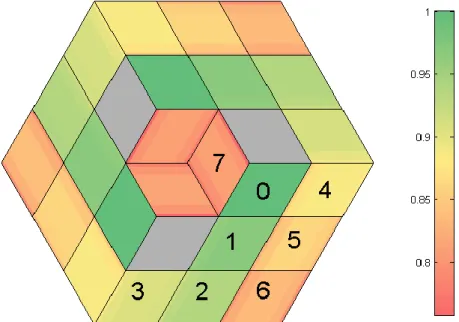
Another metric that we can use to validate this run is the concentration of U-235 in each fuel element. We would expect that those fuel elements that have resided in the core for a longer period of time will have a lower concentration of U-235. This is exactly what is shown in Fig. 11 where the relative U-235 concentration decreases with residence time. The numbers displayed on top of the fuel elements indicate how many cycles each element has previously resided in the core.
Fig. 11 Relative U-235 concentration for LEU equilibrium core.
The equilibrium core run took about two days to run with MCNP running in parallel on six 2.2 GHz AMD Opteron processors.
6. CONCLUSIONS
The graphical user interface and fuel management wrapper described herein will help to automate the onerous task of setting up an input file for performing a fuel management run in MCODE and analyzing the results from a run, all in a manner that is less prone to human error. This will enable studies in support of the MITR conversion project to be carried out effectively and will greatly aid the MITR staff in performing routine in-core fuel management calculations.
The graphical user interface has been tested and shown to work on both Linux and Windows platforms and is expected to work on all other platforms that support Python and PyQt.
Although the GUI and the fuel management wrapper as currently written have a number of features and subroutines that are specific to the MITR, the long-term vision of this project is to have an interface that requires little code modification in order to be used for a variety of different reactor designs. This will require having a standardized reactor template format that the GUI would be able to load in. Short-term improvements to the
code package include the ability to load burned fuel element data into the GUI for use in a new run, the ability to run a calculation wherein each cycle ends when the control device hits a specified stop point, and the ability to allow fission products in the fuel to decay between cycle (since refueling will take several days).
REFERENCES
1. Z. XU, P. HEJZLAR, and M. S. KAZIMI, “MCODE, Version 2.2 – An MCNP-ORIGEN Depletion Program,” Massachusetts Institute of Technology (2006). 2. P. K. ROMANO, B. FORGET, and T. H. NEWTON, JR., “Extending MCODE
Capabilities for Innovative Design Studies at the MITR”, Trans. Amer. Nucl. Soc.,
99, 659 (2008).
3. T. H. NEWTON, JR. et al., “REBUS and MCODE Burnup Modeling of the MITR
for Conversion Studies,” 2008 International Meeting on Reduced Enrichment for
Research and Test Reactors, Washington, DC, Oct. 5-8, 2008.
4. N. TOURAN, “Graphical Automation of REBUS/MC**2 Fast Reactor
Calculations,” 2008 American Nuclear Society Student Conference, College Station, TX, Feb. 28-Mar. 1, on CD-ROM, American Nuclear Society (2008).