Review
Martin Rhême*, John Botsis, Joël Cugnoni and Parviz Navi
Influence of the moisture content on the fracture
characteristics of welded wood joint. Part 1:
Mode I fracture
Abstract: Friction welding is a joining technique for wood
materials. The positive aspects of this technique are
the speed of processing and the absence of chemical or
mechanical agents, but the welded joints are not water
resistant. To understand better the effect of moisture on
the fracture behavior of welded joints, their fracture
char-acteristics have been investigated. The double cantilever
beam specimens were tested, which permit to compute the
mode I energy release rate of a welded joint. The results
confirm the negative effect of moisture on the fracture
properties of the joint. The data concerning the maximal
tensile strength of the joining material were collected by
uniaxial tests and implemented in a finite element model
to establish a cohesive law, which describes the behavior
of welded pieces in terms of moisture content.
Keywords: beech (Fagus sylvatica), cohesive law, FEM,
fracture mechanics, friction welding, moisture content
*Corresponding author: Martin Rhême, Material and Wood
Technologies, Bern University of Applied Science, Bienne, Switzerland, e-mail: [email protected]
John Botsis and Joël Cugnoni: Laboratory of Applied Mechanics and
Reliability Analysis, EPFL, Lausanne, Switzerland
Parviz Navi: Material and Wood Technologies, Bern University of
Applied Science, Bienne, Switzerland
Introduction
Assembling wood pieces is the most essential basis of
mechanical wood technology. There are many different
natural and synthetic adhesives developed to each special
task and there is a good solution for nearly all adhesive
problems of wood (Dunky and Niemz 2002). However, the
synthetic glues give some ecological concern; moreover,
they need a certain time for drying or curing. The recycling
of glued wood is aggravated.
The welding of wood is an alternate process under
development, which connects two wood pieces by the
heat developed during friction without any adhesive. The
adhesion is generated in the interface from the thin layer
of molten wood substances after solidification (Gfeller
et al. 2003). The mechanical performance of the process
is frequently investigated by varying the parameters,
such as welding time and pressure, amplitude of
vibra-tion, and surface quality, and by submitting the welded
specimens to shear test according to DIN-EN (2003) 205
(Gfeller et al. 2003, 2004; Ganne-Chédeville et al. 2005;
Ganne-Chédeville 2008). Ganne-Chédeville et al. (2008)
observed the behavior of double cantilever beam (DCB)
specimens and measured the critical energy release rate
(G
Ic) of a welded joint. The results were in the range of data
of conventional adhesives. Omrani et al. (2009) focused
on the specimens jointed with a 150 Hz frequency welding
and studied the influence of fiber orientation and wood
species on the value of G
Ic. Ganne-Chédeville (2008)
dem-onstrated that the shear resistance of welded joints drops
drastically after 3 h of water immersion. Mansouri et al.
(2009) succeeded to improve moderately the water
resist-ance of wood joints by higher welding frequency. Vaziri et
al. (2010) monitored the evolution of the crack length of
welded specimen during water absorption by X-ray
com-puted tomography. However, the effects of the moisture on
the mechanical properties have not yet been quantified.
There are overviews concerning the fracture
prop-erties of wood (Navi and Tschegg 2009;
Stanzl-Tschegg and Navi 2009). During crack propagation,
the softening behavior is reported and fiber bridging
occurs behind the crack tip. Like the other mechanical
properties of wood, the fracture characteristics are also
influenced by moisture, that is, they tend to decrease
with increasing moisture content (MC) (Pluvinage 1992;
Vasic and Stanzl-Tschegg 2007; Majano-Majano et al.
2012). The maximal value of the stress intensity factor
(i.e., fracture toughness K
Ic) is reached at 16% MC (Liyu
et al. 2003) or between 7% and 13% MC (Kretschmann
and Green 1996). Prokopski (1996) even found an
oppo-site trend of K
Icwith MC of oak and pine (species not
more accurately defined by the authors). Obviously, the
correlation between MC and crack resistance is not clear
in all details.
The mode I fracture (i.e., opening mode) of glued
wood with the DCB specimens is frequently applied due to
its simplicity in processing (Duchanois 1984; Wernersson
1991; Gagliano and Frazier 2001; Conrad et al. 2003;
Früh-mann et al. 2003; Yoshihara 2010). Some authors have
selected the tapered version of the DCB specimens (Scott
et al. 1992; Simon 2001; Qiao et al. 2003) to obtain a linear
variation of the compliance with the crack length and to
have less scattering results.
The present work is aiming at a better understanding of
the behavior of welded wood assemblies in the presence of
moisture. The experimental and numerical studies will be
presented in two articles in terms of the fracture
character-istics of the welded joint as a function of MC. The focus of
the first article is on the mode I loading of DCB specimens
with defined equilibrium MC (EMC), which should be tested
according to an ASTM (2007) standard (D5528-01). The
frac-ture mechanical experiments should be performed
accom-panied by the optical and electron microscopic observations
and numerical simulations. Finite element modeling (FEM)
should be used to construct a model based on cohesive
ele-ments. FEM is a powerful tool to model the failure and
inter-face fracture mechanisms in wood-based materials (Smith et
al. 2007; Landis and Navi 2009). The parameters of the
cohe-sive law will be experimentally established with the help of
DCB and uniaxial tensile tests. The mode II fracture (i.e., in
plane sliding mode) is addressed in part 2 (Rhême et al. 2013).
Materials and methods
Specimen preparation
The fracture behavior of the joints will be studied on DCB specimens and the stress-strain response of the joining material on tensile speci-mens.
DCB specimens
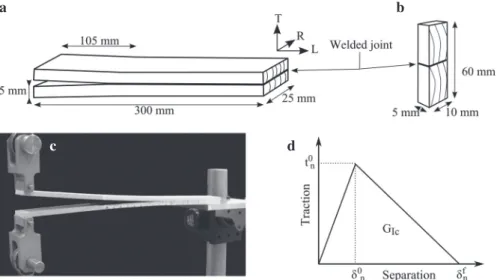
Beech (Fagus sylvatica) wood beams were machined out of the same plank, which was stored in a climatic chamber [20°C/65% relative humidity (RH)]. At EMC, beams with dimensions of 300 × 30 × 5 mm3 (for the L, R, and T directions, respectively) were prepared with a planning machine. For welding, see the next para-graph. To introduce an initial crack in the weld, grease is applied on the pre-crack surfaces to avoid friction and thus welding during the process. The final geometry of the specimen, designed accord-ing to the ASTM (2007) standard (D5528-01), is shown in Figure 1a. Four groups of five samples each were placed into four climatic boxes with different RH. The following saturated salt solutions were used: potassium acetate (RH 22%), sodium nitride (RH 65%), potassium chloride (RH 85%), and ammonium dihydrogen phos-phate (RH 93%). The exact MC was determined on parallel speci-mens by the oven drying method (DIN (1977) 52-183). The following four MC levels were considered: 6.4%, 12.0%, 16.2%, and 22.0%. Once EMC is reached, the dimensions of the specimens were meas-ured and their lateral surfaces were covered with a white brittle paint and vertical thin lines were drawn every millimeter to help track crack propagation during testing. Lastly, aluminum blocks with a through hole were glued on the extremities of the beams to serve as load application pins.
a
b
d
c
Figure 1 (a) DCB specimen before the gluing of the aluminum blocks. (b) Tensile specimen. For both types of specimen, the tangential
direction is perpendicular to the weld plan. (c) Photograph of the DCB specimen in the testing machine. The upper beam is pulled by a constant displacement speed through an articulated fixture (left). A video camera records the pictures of the lateral surface for subsequent measurement of the crack length (see text for details). (d) Traction separation law for the cohesive elements. The maximal traction values (tn0) at damage initiation are determined by the uniaxial traction tests. Note that the area under the curve is equal to the value of the critical energy release rate (GIc) determined by DCB fracture test.
Tensile specimens
The initial wood parts to be welded have the dimensions of 500 × 20 × 30 mm3 (for L, R, and T directions, respectively). The weld-ing occurs on the surface of 500 × 20 mm2. Half of the welded piece served as uniaxial tensile specimens and the other one as torsion specimens described in Part 2 of this work (Rhême et al. 2013). The thickness was reduced by planning to 10 mm, and 5 mm slices were cut with a circular saw. The surface normal to the longitudinal direc-tion was polished with 240 and 800 SiC paper, which lets the cellular structure of the wood appear. This was necessary for digital image correlation (DIC) studies for surface displacement measurements. The conditions for obtaining the specimens EMC were the same as described above. A total of eight specimens were tested per condi-tion.
Welding process
Both DCB and tensile specimens were frictionally welded by a Bran-son M-DT24L linear welding machine. The parameters of the fric-tion step are as follows: time 2.4 s, pressure 1.5 MPa, and amplitude 3 mm. The parameters of the holding step are as follows: time 7 s and pressure 1.5 MPa. More information concerning linear welding and the orbital process is given by Ganne-Chédeville (2008) and Stamm (2005), respectively.
Experimental methods
Fracture testing
The DCB specimens were tested on a uniaxial testing machine (Instron 5848 Microtester; Instron, Norwood, MA, USA) with a 2 kN load cell and constant pulling rate of 2 mm min-1 (see Figure 1c for details). The pictures were taken of the lateral marked surface at regular time intervals during the test with the help of a cam-era Guppy from Allied Vision Technologies (Stadtroda, Germany) equipped with a 50 mm lens. During the test, the load, displace-ment, and photographs of the advancing crack tips were recorded and stored for evaluation. The mass was measured after removing the specimens from the box, because small variation of the speci-men’s MC may occur. The MC loss during test was very small and its effects are negligible. After fracture, the profiles of the fractured surface were measured by optical noncontact profilometry. The fracture paths were used to measure the roughness parameters (Ra and Wt) and their fractal dimension was determined by the box counting method.
Tensile testing
A uniaxial machine was available with a climatic chamber with stable RH and temperature conditions controlled by appropriate sensors. A glass window adapted on the chamber enables to take pictures of the polished surface (perpendicular to the loading direc-tion) during the test. Right before starting the test, the specimen
is clamped in the fixture and the chamber is closed followed by a waiting time of ∼5 min for stabilization of the temperature and RH. The specimen is pulled to failure at a displacement rate of 0.33 mm min-1. After the test, the mass and dimensions of each sample were measured. The natural structure of wood easily enables to measure surface displacements and deduce the strains by DIC by means of the photographs taken.
Finite element modeling
A two-dimensional FEM to simulate the crack propagation in the DCB specimen was constructed with the help of the software Abaqus/CAE. The beams are represented with quadrilateral plane strain elements and the elastic properties for beech. The variation of the properties of the wood with the MC was taken into account through the following relations of Dinwoodie (1989):
Ed = Eref [1+0.015 (uref-u)] (1)
Gd = Gref [1+0.025 (uref-u)]. (2)
Subscript d indicates the direction of the property (L, R, or T) and Eref and Gref are the moduli at a reference MC uref (here, 12% MC). The values of the elastic properties are found in the literature (Koll-mann 1982; Niemz 1993) and are presented in Table 1. According to the results of Hering et al. (2012), the MC seems to have a little effect on the Poisson’s ratios and they will consequently be considered to be constant in this work.
The joint is represented by a layer of cohesive elements gov-erned by a traction separation behavior with linear damage evolution (Figure 1d). These elements have first a linear elastic behavior deter-mined by a stiffness K followed by damage initiation when a maximal stress criterion is reached:
n s t 0 0 0 n s t t t t Maxt t t, , =1. (3)
Subscripts n, s, and t stand for the direction of the nominal stresses when the deformation is purely normal to the interface (mode I) and purely in the first (mode II) and second (mode III) shear directions s, respectively. The Macaulay brackets indicate that no damage is initiated by the pure compressive stresses (Abaqus 2009). The different peak values (tn0, ts0, and tt0) are material properties and are determined by the experimental tests.
In this article, only pure mode I is addressed. Therefore, only the normal stress tn0 is of interest and determined from the data of the tensile test presented in Table 2. The peak value for the shear stresses
Table 1 Reference values of the elastic properties used in the FEM.
Direction Property (GPa)
Eref Gref ν L 14.00 T 1.16 R 2.28 LT 1.08 0.53 LR 1.64 0.45 RT 0.47 0.71
ts0 and t
t0 are established according to the results of the torsion tests presented in Part 2 (Rhême et al. 2013). The joining material is very thin in comparison with the specimen’s thickness; thus, it does not contribute to the global elastic loading during the DCB test. How-ever, in the numerical simulation, the elastic stiffness of the cohe-sive elements cannot be infinite. In this work, it is assumed that the separation value at which damage initiates (δn0) is equal to a 10th of the maximal separation (δnf). Thus, the stiffness of the cohesive element is calculated using Equation (4):
( )
0 2 nIc 9 t
K= 2G . (4)
Results and discussion
Experimental testing
Fracture testing
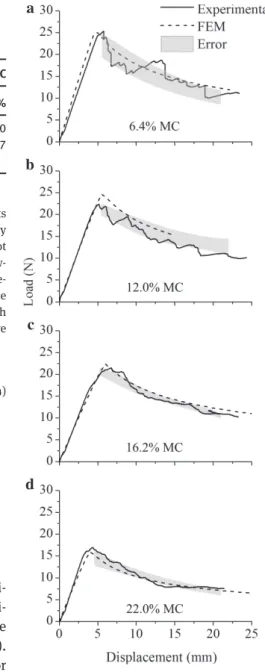
The typical load-displacement curves of the DCB
speci-mens are shown in Figure 2 and the scatter of the
experi-mental curves is illustrated with a gray error zone. The
dashed lines are the results of FEM (see last chapter).
The limits of the error zones are calculated by adding or
subtracting the standard deviation to an average load
value calculated out of four experimental curves at each
displacement. Moisture has mainly two effects. First, the
maximal load peak is smallest at the highest MC (22%);
second, post-peak behaviors are also different depending
on the MC level. Although crack propagation is stable, the
dry specimens (6%) show the intervals of sudden crack
length increment. Such propagation features seldom
occur in the specimen with 12% MC and are totally absent
in samples with 16% and 22% MC.
A scheme of the two parts of a specimen after fracture
at 22% MC is presented in Figure 3 and the scanning
elec-tron microscopy (SEM) photograph of the lower part of a
fractured specimen. The crack propagates at the interface
between wood and the joining material, with frequent
crossing to reach the opposite interface. The roughness
Table 2 Values of maximal tensile strength and critical energy
release rate measured during this work and used in the cohesive law [Equation (3)] and the corresponding MCs.
Properties Data at various MC
6.4% 12.0% 16.2% 22.0% tn0 [MPa] 2.7 2.7 1.9 1.0 GIc mJ2 72 78 72 37
a
b
c
d
Figure 2 Comparison of typical load-displacement experimental
curves (straight lines) with results obtained by FEM (dashed line). The relative error, represented by the gray area, is calculated according to the standard deviation of the experimental data (see text for details).
and fractal analysis of the fractured surfaces do not reveal
differences at different MC levels. The photographs of the
fracture surfaces for the four levels of MC are displayed in
Figure 4, which do not show an effect of MC below 16%.
However, at 22% MC, long wood fibers are visible at the
surface of the joining material (Figure 4). In dry
condi-tions, these fibers are embedded in the matrix and break
during fracture and only short fiber fragments are elevated
above the surface. At higher MC, the fibers are pulled out
from the matrix.
Upper beam
Lower beam
2 mm
300 µm x250
Figure 3 At the top is a schematic representation of the crack path
on a moist specimen (22% MC) after separation of the joint. The photograph at the bottom is a magnification of a detail. The SEM picture shows the transition of the crack path that crosses the joint material from one interface to the other.
Figure 4 Optical light microscopy photograph of the fracture plans for all four different MC. The fracture surface exhibits features
composed of islands and valleys formed by the welded material. The opposite surface has the negative print of these features. At this scale, only the moist specimens exhibits fleecy surface. This is due to long fibers coming out of the joining material.
Energy release rate calculation
The expression of G
Icis given by Equation (5):
( ) 2 Ic
P C a
G
,
2b a
∂
=
∂
(5)
where P is the value of applied load on the specimen at
crack propagation onset, a is the crack length, b is for the
specimen thickness, and C(a) is the specimen’s
compli-ance in terms of crack length. The measured load P and
the applied displacement enable to calculate the
com-pliance corresponding to the crack length a measured
during testing. The values of compliance in terms of a can
therefore be fitted with a power equation for subsequent
processing:
C(a) = C
1a
m.
(6)
Once C
1and m are determined, the derivative is
calcu-lated and inserted in Equation (5) to compute G
Ic.
The points presented in Figure 5 are the average values
of G
Iccalculated in the post-peak region and the error bars
are obtained from the standard deviation of the data.
Although the results are scattering, no R-curve behavior
is seen at any level of MC tested. At the low level of MC,
the G
Icvalues are quite similar, but a strong decrease at
high MC can be noticed. The results are similar to those of
Kretschmann and Green (1996), who investigated the K
IcFigure 5 Evolution of the critical energy release rate (GIc) and the maximal tensile strength of the welded joint in terms of the corresponding MC. 4 3 2 Stress (MPa) 1 0 0.000 0.002 0.004 Strain (-) 0.006 0.008 6.0% MC 11.6% MC 16.6% MC 22.7% MC
Figure 6 Stress-strain curves obtained during the tensile test at
different moisture content.
Figure 7 Close images of the fractured joint (black part in the middle) after the tensile test. Fibers entanglement between the two broken
parts differentiate the dry (left) and moist (right) specimens.
of pine, and the change of fracture properties can be well
expressed as a function of MC by a second-order
polyno-mial expression. Based on this, a maximum of G
Icshould
be at ∼11% MC.
According to the results of Majano-Majano et al.
(2012), the fracture characteristics of a welded wood joint
are quite close to those of thermally treated beech. In
com-parison with the untreated beech, welded joint,
indepen-dently from the MC, requires about three to four times less
energy for the crack to propagate, that is, the joint is the
weakest part in a welded wood assembly.
Tensile testing
The load-displacement curves (Figure 6) obtained from
the tensile specimens become more deviating from
lin-earity at higher MC. Fracture always occurs in the joint,
which make it possible to calculate its maximal tensile
strength. Interestingly, only the high MC specimens
dem-onstrate the discernible damage initiation before fracture,
which is characterized by a relatively flat curve. Fibers
are well visible in the broken interfaces (Figure 7). The
maximal strength values plotted in Figure 5 in terms of MC
illustrate that the maximal strength strongly decreases
with increasing MC above 12%. Apparently, the moisture
also decreases the stiffness as well as the strain to failure
(Figure 6).
The EMC calculated for the tensile specimens is
slightly different than that of the DCB specimens. This
small deviation can be due to the slightly different
environ-mental conditions at the time of weighting the reference
specimens. Supposedly, the influence of this has a
negli-gible effect on the elastic constants (Equations (1) and (2)).
As a matter of fact, the largest MC difference encountered
(0.7% MC) induces a change of 1.3% on the value of the
longitudinal modulus. Therefore, the MCs corresponding
to the DCB specimens are used in the calculations.
Finite element modeling
The maximal strength and critical energy release rate
experimentally measured are inserted in the cohesive law
presented in Figure 1d. Figure 2 shows the
load-displace-ment curves obtained experiload-displace-mentally and those obtained
by FEM (dashed lines). Although the scattering of the
experimental curve can reach 15%, the model describes
well the observed experimental maximal loads and
post-peak behavior. Coureau et al. (2006) and Morel et al. (2010)
demonstrated that the presence of fiber bridging during
wood fracture requires the use of a bilinear damage law.
In the present study, however, a simple linear damage law
was sufficient to model the crack propagation during a
DCB test. This fact shows that fiber bridging effect has not
to be considered, although the optical observations seem
to indicate the presence of fibers on the fractured surfaces
of the wet specimens (Figures 4 and 7).
The decrease of the initial slope on the simulation
curves with increasing MC is due to the elastic moduli
of wood. The different moduli values decrease with MC
according to Equations (1) and (2); therefore, the slope is
steeper in the case of elastic loading under dry conditions.
The differences in the slopes of the simulated curves and
the experimental ones can be explained by the natural
variation of the longitudinal modulus of the wood.
Conclusion
It is possible to determine the critical energy release rate
of the joints at different MC with a DCB test. The influence
of MC on the fracture properties is obvious, because the
specimens with high MC (22%) have G
Icvalues about half
the value of those with low and intermediate MC contents
at 6–16%. The optical observations with MC-dependent
differences support the influence of moisture. The tensile
tests highlight the declining tendency of properties with
increasing MC. Fracture toughness and maximal strength
show a similar trend at high MC. Accordingly, the loss of
fracture toughness is mainly due to the poor performance
of the joining material. A FEM representing the DCB test
configuration was built based on the experimental data of
the DCB and tensile tests. These results show that a linear
cohesive law can model well the behavior of welded wood
joint under the MC conditions examined in this work.
Acknowledgements: The authors acknowledge the
finan-cial support of the Swiss National Science Foundation.
SNF Project Nr. CRSI22_127467/1.
Received September 7, 2012; accepted January 15, 2013; previously published online February 23, 2013
References
Abaqus 6.9 Online Documentation (2009) Dassault System. Conrad, M., Smith, G., Fernlund, G. (2003) Fracture of discontinuous
wood-adhesive bonds. Int. J. Adhes. Adhes. 23:39–47. Coureau, J., Morel, S., Gustafsson, P., Lespine, C. (2006) Influence
of the fracture softening behavior of wood on load-COD curve and R-curve. Mater. Struct. 40:97–106.
ASTM (2007) D5528-01. Standard test method for mode I interlaminar fracture toughness of unidirectional fiber-reinforced polymer matrix composites. American Society for Testing Material. DIN (1977) 52-183. Prüfung von Holz – Bestimmung des
Feuchtig-keitsgehaltes.
DIN-EN (2003) 205. Adhesives – wood adhesives for non-structural applications. Determination of the tensile-shear strength of lap joints.
Dinwoodie, J. (1989) Wood, Nature’s Cellular, Polymeric Fibre-Composite. The Institute of Metals, London.
Duchanois, G. (1984) Mesure de la ténacité et étude du
comportement mécanique des joints bois-colle. Ph.D. thesis, Institut National Polytechnique de Lorraine.
Dunky, M., Niemz, P. Holzwerkstoffe und Leime – Technologie und Einflussfaktoren. Springer-Verlag,
Berlin, 2002.
Frühmann, K., Burgert, I., Stanzl-Tschegg, S.E., Tschegg, E.K. (2003) Mode I fracture behaviour on the growth ring scale and cellular level of spruce (Picea abies [L.] Karst.) and beech (Fagus sylvatica L.) loaded in the TR crack propagation system. Holzforschung 57:653–660.
Gagliano, J.M., Frazier, C.E. (2001) Improvement in the fracture cleavage testing of adhesively-bonded wood. Wood Fiber Sci. 33:377–385.
Ganne-Chédeville, C. (2008) Soudage linéaire du bois: étude et compréhension des modifications physico-chimiques et développement d’une technologie d’assemblage innovante. Ph.D. thesis, Université Henri Poincaré.
Ganne-Chédeville, C., Pizzi, A., Thomas, A., Leban, J., Bocquet, J., Despres, A., Mansouri, H. (2005) Parameter interaction in two-block welding and the wood nail concept in wood dowel welding. J. Adhes. Sci. Technol. 19:1157–1174.
Ganne-Chédeville, C., Duchanois, G., Pizzi, A., Pichelin, F., Properzi, M., Leban, J. (2008) Wood welded connection: energy release rate measurement. J. Adhes. Sci. Technol. 22:169–179. Gfeller, B., Zanetti, M., Properzi, M., Pizzi, A., Pichelin, F., Lehmann,
M., Delmotte, L. (2003) Wood bonding by vibrational welding. J. Adhes. Sci. Technol. 17:1573–1589.
Gfeller, B., Pizzi, A., Zanetti, M., Properzi, M., Pichelin, F., Lehmann, M., Delmotte, L. (2004) Solid wood joints by in situ welding of structural wood constituents. Holzforschung 58:45–52. Hering, S., Keunecke, D., Niemz, P. (2012) Moisture-dependent
orthotropic elasticity of beech wood. Wood Sci. Technol. 46:927–936.
Kollmann, F. Technologie des Holzes und der Holzwerkstoffe. Springer-Verlag, Berlin, 1982.
Kretschmann, D.E., Green, D.W. (1996) Modeling moisture content-mechanical properties relationship for clear southern pine. Wood Fiber Sci. 28:320–337.
Landis, E.N., Navi, P. (2009) Modeling crack propagation in wood and wood composites. A review COST Action E35 2004–2008: Wood machining – micromechanics and fracture. Holzforschung 63:150–156.
Liyu, W., Zhenyou, L., Guangjie, Z. (2003) Wood fracture pattern during the water adsorption process. Holzforschung 57: 639–643.
Majano-Majano, A., Hughes, M., Fernandez-Cabo, J.L. (2012) The fracture toughness and properties of thermally modified beech and ash at different moisture contents. Wood Sci. Technol. 46:5–21.
Mansouri, H., Omrani, P., Pizzi, A. (2009) Improving the water resistance of linear vibration-welded wood joints. J. Adhes. Sci. Technol. 23:63–70.
Morel, S., Lespine, C., Coureau, J.-L., Planas, J., Dourado, N. (2010) Bilinear softening parameters and equivalent LEFM R-curve in quasibrittle failure. Int. J. Solids Struct. 47:837–850. Navi, P., Stanzl-Tschegg, S.E. (2009) Micromechanics of
creep and relaxation of wood. A review COST Action E35 2004–2008: Wood machining – micromechanics and fracture. Holzforschung 63:186–195.
Niemz, P. Physik des Holzes und der Holzwerkstoff. DRW-Verlag, 1993.
Omrani, P., Mansouri, H., Duchanois, G., Pizzi, A. (2009) Fracture mechanics of linearly welded wood joints: effect of wood species and grain orientation. J. Adhes. Sci. Technol. 23:2057–2072. Pluvinage, G. La Rupture du Bois et de ses Composites.
Cépaduès-Editions, Toulouse, 1992.
Prokopski, G. (1996) Influence of moisture content on fracture toughness of wood. Int. J. Fracture 79:R73–R77.
Smith, I., Snow, M., Asiz, A., Vasic, S. (2007) Failure mechanisms in wood-based materials: A review of discrete, continuum, and hybrid finite-element representations. Holzforschung 61:352–359.
Qiao, P., Wang, J., Davalos, J. (2003) Tapered beam on elastic foundation model for compliance rate change of TDCB specimen. Eng. Fract. Mech. 70:339–353.
Rhême, M., Botsis, J., Cugnoni, J., Navi, P. (2013) Influence of the moisture content on the fracture characteristics of welded wood joint. Part 2: mode II fracture. Holzforschung 67:755–761.
Scott, C., River, B., Koutsky, J. (1992) Fracture testing wood adhesive with composite cantilever beam. J. Test. Eval. 21:259–264. Simon, F. (2001) Endommagement et rupture des joints collés
solicitée en traction ou cisaillement. Application au collage du bois. Ph.D. thesis, Université Bordeaux I.
Stamm, B. (2005) Development of friction welding of wood – physical, mechanical and chemical studies. Ph.D. thesis, Ecole Polytechnique Fédérale de Lausanne.
Stanzl-Tschegg, S.E., Navi, P. (2009) Fracture behavior of wood and its composites. A review. Holzforschung 63:139–149. Vasic, S., Stanzl-Tschegg, S. (2007) Experimental and numerical
investigation of wood fracture mechanisms at different humidity levels. Holzforschung 61:367–374.
Vaziri, M., Lindgrend, O., Pizzi, P., Mansouri, H. (2010) Moisture sensitivity of Scots pine joints produced by linear frictional welding. J. Adhes. Sci. Technol. 24:1515–1527.
Wernersson, H. (1991) Fracture characterization of wood adhesive bonds. Paper presented at the 1991 International Timber Engineering Conference, Report TVSM, London. Yoshihara, H. (2010) Examination of the mode I critical stress
intensity factor of wood obtained by single-edge-notched bending test. Holzforschung 64:501–509.