©International Epidemiological Association 1989
The Relationship of Lifestyle to
International Trends in CHO
FREDERICK H EPSTEIN
Printed in Great Britain
Epstein F H (Institute of Social and Preventive Medicine, University of Zurich, Sumatrastrasse 30, CH 8006 Zurich, Switzerland). The relationship of lifestyle to international trends in CHD.lnternational Journal of Epidemiology, 1989,
18 (SuppI.1): 5203-5209.
Three components of lifestyle-nutrition, smoking and alcohol drinking patterns-have been related to rates of decline or increase of coronary heart disease (CHD) mortality in27 countries during the past 10 to 25 years. In almost all of the countries with major falls or rises in CHD mortality, there are, respectively, corresponding decreases or increases in animal fat consumption, with reciprocal changes in the consumption of vegetable fats. Countries with moderate or small mortality declines show variable patterns of fat consumption. The prevalence of smoking is declining among men and remains unchanged or is increasing slightly among women in most countries, suggesting that differences in the rate of decline between countries or between the sexes are not related to an appreciable degree to differences in the change of smoking habits; however, the mortality changes in any individual country are most probably influenced by smoking. The consumption of alcoholic beverages increases almost everywhere and cannot be related quan-titativelyto the secular CHD mortality trends. These findings support in general the presently recommended courses of action for the prevention of premature CHD.
SCOPE
This review of the relationship between lifestyle and coronary heart disease (CHD) mortality trends, with emphasis on the last 10 years, is confined to a consider-ation of nutritional habits, smoking and alcohol con-sumption. It is not implied that these are the only important components of lifestyle that affect secular CHD trends. They are, however, the components that are most amenable to quantification and large-scale international comparisons. Moreover, nutrition and smoking have been established as being key determi-nants of the disease because of a cause-and-effect rela-tionship. With regard to alcohol, it is less clear whether or to what extent a causal relationship exists, but it is nevertheless likely that drinking habits reft.ect patterns of lifestyle that are relevant to the problem.
There exist large amounts of information on nutri-tion, smoking and alcohol collected during one period of time. Data on time trends, however, are more scarce. In this review, attention is limited to available data on trends.
NUTRITION
Itis notoriously difficult to obtain reliable information
Institute of Social and Preventive Medicine, University of Zurich, Sumatrastrasse 30, CH 8006 Zurich, Switzerland.
on nutritional habits, especially over time. The best data come from nutritional surveys in defined popula-tions, but they have been gathered in only a relatively few countries. The present emphasis is on a global view and, for this reason, use is made of the yearly records published by the United Nations Food and Agriculture Organization (FAa). These data are based essentially on food supplies and do not necessarily reft.ect what people actually eat. The limitations of such data are generally well recognized, but they remain a unique and valuable source.
According to present knowledge about athe-rogenesis, the most important single dietary compo-nent responsible for differences in the frequency of the disease is dietary fat. Other important dietary constitu-ents are correlated to a large though varying degree with the amount of fat in the diet. The time trends in the consumption of animal and vegetable fats in 27 countries between 1961 and 1985 are summarized in a set of bar diagrams (Figures l A, B and C), based on FAa data.I There are three charts, according to
whether the countries showed major CHD mortality declines (between 38% and 18%), moderate to no declines (13% to 0%), or increases in CHD mortality (between 11% and 60%). The rates of change, in decreasing or increasing order, apply to coronary (isch-aemic) heart disease mortality among men between 1972 and 1984, based on advance data of the World S203
Figure 1
The trends in the consumption of fats of animal and vegetable origin between 1961 and 1985 in 27 countries
180 Food Supply: Fat per caput per day (grams)
o 80 20 120 140 60 160 100 40 ANIMAL DECLINE USA 38% Australia 37% Canada 30% Belgium 27% Japan 25% New Zealand 23% Finland 21% Netherlands 18% The horizontal lines in the bar diagrams connect 4 time points: 1961-1963, 1969-1971, 1979-1981, 1983-1985.
FiGURE lA Countries with DECLINES in ischaemic heart disease mortality among men between38%and18%during the period 1972-1984.
Health Organization, kindly supplied by Mr K Uemura. The final report of these data- contains slightly different percentages, being based on a dif-ferent time period (1970-1985). Five of the eight coun-tries with major declines (Figure 1A) show, in accordance with expectation from the theory, declines in animal fat consumption, sometimes associated with an absolute or relative increase in fats of vegetable origin. The small amount of vegetable fat in the New Zealand diet is noteworthy. For the US, the FAa data agree well with an assessment ofindividual food intake
in 1977 and 1985, which showed a decline of energy from total fat, amounting to about 5% in men, 4% in women and 3% in children.' The data from Belgium and the Netherlands are puzzling; they show an increase in total fat consumption due to an increase in animal fat. Detailed analyses of nutritional changes in Belgium indicate that the consumption of dairy prod-ucts has decreased, which is associated with an increase in unsaturated fatty acids. These changes would not necessarily be reflected in the overall animal and vege-table fat consumption data, especially since the changes mentioned affected primarily the Flemish-speaking part of the population.' In the Netherlands, there was a steady decline of the intake of dairy prod-ucts between 1947 and 1980, with a decrease in visible fats starting around 1970; other animal foods, how-ever, showed a steady increase beginning in 1947.5
Further data from the Netherlands, collected by
cross-checked dietary histories in the town of Zutphen, indicated only slight changes in nutrient intake between 1960 and 1985 (Kromhout D, personal com-munication) .
Countries with moderate rates of decline or no decline (Figure 1B) tend to show increases in animal fat consumption. In Portugal, total fat consumption is still quite low. The consonant nutrition and mortality pattern in the UK is well recognized. In Scandinavia, the trends have been more favourable in Norway than Sweden' which tallies with the fact that the CHD mor-tality decline in Sweden has been delayed. In Denmark, the absolute reduction in animal fat intake between 1980 and 1984 is actually very small, amount-ing to only 5 grams.I More detailed data from
Denmark indicate little favourable change between 1952 and 1982.5The emerging small declines in CHD mortality in Switzerland, Austria, Iceland and Italy, while encouraging in being in the right direction, should not yet be interpreted in terms of any dietary trends, whether favourable or unfavourable.
In the countries with increasing CHD mortality, the picture is very clear: There are uniformly steep increases in animal fat consumption, with vegetable fat supply remaining constant (Figure 1C). In Poland, another country with increasing mortality (not shown in the figure), total fat consumption in 1984 was lower than that in Hungary-lOS versus 140 grams.' Total animal and vegetable fat supplies changed little in
Pol-LIFESTYLE AND INTERNATIONAL TRENDS IN CHD Figure 1 (continued)
The trends in the consumption of fats of animal and vegetable origin between 1961 and 1985 in 27 countries S205 9% Norway Ireland 0% 10% Italy 2% F.R. Germany 11% Iceland 4% Denmark 11% France Austria 5% United Kingdom 11% Switzerland 6%
Food Supply: Fat per caput per day (grams) 180 160 140 120 100 80 60 40 20 ANIMAL 0 Portugal DECLINE 13% 180 160 140 120 100 80 60 40 20 0 Sweden DECLINE 9%
FIGURE 1B Countries with DECLINES in ischaemic heart disease mortality among men between13%and 0% during the period 1972-1984.
and from 1970 to 1980 and 1984, being, respectively, 101, 114 and 105 grams, and 80, 89 and 82 grams.' These findings are borne out by data from the Institute of Food and Nutrition in Warsaw." However, the pro-portion of calories derived from fat increased since 1970, as reported by Rywiket al.in Section III.
Itis fair to say that countries with marked declines in CHD mortality tend to show a decrease in animal fat and, to a lesser extent, an increase in vegetable fat supply. At the other end of the scale, increases in CHD
mortality are associated with increases is animal and total fat supplies. Where there are apparent excep-tions, they should not be used for questioning the underlying theory but seen as a sign of a need to explain these seeming discrepancies. In the countries with CHD mortality declines in the intermediate range, the picture, as might be expected with a multi-factorial disease, is less uniform. Thus, the data neither unequivocally support the theory or run counter to it in any way. On the contrary, in this range, alternative
Figure 1 (continued)
The trends in the consumption of fats of animal and vegetable origin between 1961 and 1985 in 27 countries
180 Food Supply: Fat per caput per day (grams)
160 Romania 60% Spain 52% Yugoslavia 39% Hungary 38% Bulgaria 20% Greece 18%
o
20 80 60 120 100 140 Czechoslovakia INCREASE 11% 40 ANIMALfIGUREIe Countries with INCREASES in ischaemic heart disease mortality among men between11%and 60% during the period 1972-1984.
explanations, such as improvements in medical care, suggest themselves, with nutritional habits exerting a supplementary influence.
In the interpretation of these nutritional data, it must be remembered that they are relatively crude and discrepancies or weakened associations are to be expected for this reason. At the same time, the variety of consumption trends in opposite directions dispels the frequent criticism that such data are invalid because they are all subject to a similar secular collec-tion bias.
SMOKING TRENDS
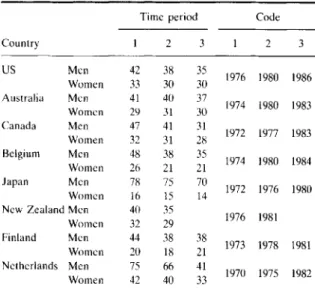
International smoking trends have been assessed in terms of the prevalence of smokers in different coun-tries over time (Tables lA-C). The councoun-tries are arranged in three groups, according to the changes in CHD mortality. Two WHO publications provide the data base."? All eight countries with major CHD mor-tality declines show a reduction in the prevalence of smoking among men from the 1970s into the 1980s (Table 1A); this reduction is most marked in the Netherlands, where the rate was initially very high, as in Japan. However, in the Netherlands, the prevalence in 1982 still ranks highest next to Japan. Among women, declines in the prevalence of smoking are slight to negligible in this group. In the intermediate group of countries (Table 1B), prevalence among men declines in each country, most markedly in the UK
which along with Denmark, originally ranked highest. Declines in women are again slight, with some coun-tries showing increases. There are practically no avail-able data on smoking trends in countries with rising CHD mortality (Table 1C).
Itis apparent from these data that countries differing widely in changing CHD mortality rates have similar secular smoking trends so that changes in smoking patterns cannot account to an appreciable degree for differences in the steepness of the mortality changes.It has been clear for some time that the almost universal declines in CHD mortality among women are unex-plained by women's smoking patterns. None of this means that, in any given country, reduction of smoking in the population will not lead to a reduction in CHD risk! All it means is that factors other than smoking must be responsible in large part fordifferencesin the rate of decline of CHD mortality. Corresponding data, relating rising CHD mortality rates to smoking habits, are presently lacking but will be forthcoming from the MONICA Project. The current data take no account of changes in smoking behaviour in narrower age groups and the lag period between these changes and their effect on CHD.
ALCOHOLDRINKING PATTERNS
As mentioned above, it is not established whether there is a causal relationship between alcohol con-sumption and CHD risk so that it is not certain whether
TABLE1A Time trends in the prevalence of smoking in adults (%). Countries with major declines in CHD mortality.
Time period Code
Country 2 2 3 US Men 42 38 35 1976 1980 1986 Women 33 30 30 Australia Men 41 40 37 1974 1980 1983 Women 29 31 30 Canada Men 47 41 31 1972 1977 1983 Women 32 31 28 Belgium Men 48 38 35 1974 1980 1984 Women 26 21 21 Japan Men 78 75 70 1972 1976 1980 Women 16 15 14
New Zealand Men 40 35
1976 1981 Women 32 29 Finland Men 44 38 38 1973 1978 1981 Women 20 18 21 Netherlands Men 75 66 41 1970 1975 1982 Women 42 40 33
TABLE IB Time trends in the prevalence of smoking in adults (%). Countries with moderate to no declines in CHD mortality.
Time period Code
Country 2 2 3 UK Men 68 46 36 1970 1976 1984 Women 44 38 32 France Men 62 50 1976 1980 Women 33 26 Denmark Men 68 60 57 1972 1975 1980 Women 49 46 44 FRG Men 54 49 44 1973 1978 1984 Women 26 28 29 Norway Men 56 52 46 1970 1975 1980 Women 37 39 39 Sweden Men 55 52 47 1972 1976 1979 Women 34 38 34 Switzerland Men 51 45 46 1975 1979 1981 Women 29 31 29 Austria Men 46 33 1972 1981 Women 13 22 Italy Men 60 53 54 1965 1975 1980 Women 13 17 Ireland Men 49 40 39 1972-3 1978-91981/2 Women 37 31 32
TABLElC Time trends in the prevalence of smoking in adults (%). Countries with increases in CH D mortality.
Time period Code
Country 2 2 Comment Czechoslovakia Men 61 57 1974 1984 One Women 29 14 district Spain Men 58 58 1981 1986 Data for Women 20 23 Catalonia
changes in alcohol consumptionper sewill influence CHD risk. All the same, examination of these patterns is worthwhile in their own right and as a possible indicator of underlying causal mechanisms. Inter-national patterns of alcohol consumption between 1950 and 1970 have been extensively analysed by Sulk-unen" who divided countries into those where wine, beer or spirits is the main source of alcohol. It is evi-dent that consumption in terms of absolute alcohol rose in nearly all countries up to 1970.
In order to obtain a more current picture, changes in alcohol consumption between 1960 and 1981 have been calculated from WHO data" using the same sub-division into countries, with major declines, intermedi-ate declines, and increases in CHD mortality. In countries with major declines (Table2A),it is seen that the consumption of wine, beer and spirits has risen between 1.1 to 6.3-fold, depending on the country and type of alcohol. These data must be seen in conjunc-tion with the absolute baseline consumpconjunc-tion in 1960, shown in the left-hand part of the tables. In all of these non-wine drinking countries, wine consumption has at least doubled or tripled, beer consumption has but modestly increased and spirit consumption has increased to about the same degree (around 1.5 to 2-fold).
In most of the 'intermediate decline' countries (Table 2B), the baseline consumption of wine and spirits tended to be higher than in the 'major decline' countries. In the wine-drinking countries, the con-sumption of wine has declined slightly but it increased from a low level in the others. Spirits have increased to about the same degree as in 'major decline' countries, starting, however, from a higher level of intake. Beer consumption has increased to about the same extent, whether initial consumption was higher or lower. In the countries with increase in mortality (Table 2C), there has been but a little increase in wine consump-tion, with increases in spirit consumption; data on the trends in beer consumption are mostly lacking.
Itis difficult to obtain a comprehensive picture of these trends. Even if there were data in which the total absolute alcohol content derived from the three types of beverages had been combined into one overall measure, its value would be questionable since there are at least some indications that different kinds of alcoholic beverages may have different effects, whether in terms of pharmacological differences or in terms of the personality or gender of the people who drink them. The trends that emerged by 19708 have probably continued, leading to a 'homogenization' of drinking patterns in relation to the types of beverages consumed. In addition, the more recent data (Table 2)
S208
TABLE2A Changes in the consumption of alcoholic beverages between 1960 and 1981 among people aged 15 years and older. Countries with major declines in CHD mortality.
Country USA Australia Canada Belgium Japan New Zealand Finland Netherlands * in 1981. t absolute alcohol. Consumption in 1981, as a multiple of Litres per capita in 1960 consumption in 1960 (consumption in 1960=1.0)
Wine Beer Spiritst Wine Beer Spirits
5.0 83.9 3.0 2.2 1.5 1.4 7.4 145.6 1.1 3.4 1.3 1.4 3.1 89.6 2.3 3.6 1.3 1.9 10.3 147.4 1.1 2.6 1.1 2.4 (4.2)* (20.3)* 1.5 1.6 1.9 35.7 1.9 3.6 2.1 2.2 2.7 34.0 1.6 6.3 3.5 2.1
TABLE2B Changes in the consumption of alcoholic beverages between 1960 and 1981 among people aged 15 years and older. Countries with moderate to no decline in CHD mortality.
Country Portugal UK France Denmark Fed. Rep. Germany Norway Sweden Switzerland Austria Iceland Italy Ireland * in 1981. t absolute alchohol. Consumption in 1981, as a multiple of Litres per capita in 1960 consumption in 1960 (consumption in 1960=1.0)
Wine Beer Spiritst Wine Beer Spirits
119.7 (50.8)* 0.9 2.1 109.1 0.9 5.1 1.3 2.4 171.5 47.1 2.7 0.7 1.2 1.2 4.1 95.2 (1.9)* 5.0 1.8 13.8 122.7 2.4 1.8 1.5 1.5 1.6 33.1 1.8 3.4 1.8 1.1 4.2 39.9 2.9 3.7 1.4 1.2 48.6 93.9 2.0 1.3 0.96 1.3 26.9 92.1 3.2 1.7 1.5 0.6 (8.9)* 2.5 1.4 144.4 1.3 0.7 1.9 96.1 1.2 1.8 2.3
TABLE2C Changes in the consumption of alcoholic beverages between 1960 and 1981 among people aged 15 years and older. Countries with increases in CHD mortality.
Country Czechoslovakia Greece Bulgaria Hungary Yugoslavia Spain Romania * in 1981. t absolute alcohol. Consumption in 1981, as a multiple of Litres per capita in 1960 consumption in 1960 (consumption in 1960=1.0)
Wine Beer Spiritst Wine Beer Spirits
18.3 137.1 1.4 0.96 1.3 3.8 55.9 0.99 (28.2)* 1.8 1.4 39.9 (111.4)* 1.9 1.1 3.3 31.5 2.6 1.2 1.1 70.4 2.8 1.2 1.5 29.7 (60.4 )* 1.5 1.3 1.8
leave no doubt that alcohol consumption is rising in essentially all countries, leaving open whether the rise, in terms of absolute alcohol, is quantitatively different in the three groups of countries. It would not seem, on visual inspection, that the countries with major declines have overall changes in alcohol consumption that are appreciably higher or lower than those in the countries with intermediate declines. The data for countries with increasing rates (Table 2C) are too incomplete even for superficial assessment. On balance, the question of whether changes in alcohol consumption are correlated, either negatively or positively, with changes in CHD mortality cannot be definitively answered in terms of present data.
CONCLUSIONS
Among the lifestyles that are or may be related to secular changes in CHD mortality, nutritional habits, smoking patterns and drinking patterns have been selected for the present analysis. The dietary changes in animal fat consumption during the most recent IS-year period in 27 countries reflect the view that marked declines or increases in CHD mortality are correlated, respectively, with reductions or increases in the intake of animal fats. CHD mortality declines of lesser degree are less obviously related to dietary changes and may be due as much to secondary as to primary prevention. Changes in smoking habits do not help to explain differences in the rates of decline or increase in CHD mortality but have, in all likelihood, contributed to the declines of mortality in the countries in which they have occurred. Changes in drinking pat-terns, in terms of the consumption of wine, beer and spirits, bear no consistent relationship to changes in CHD mortality.
In general, these findings support the present courses of action at the community level toward the primary prevention of CHD. With regard to nutrition, a major need is the establishment of reliable sur-veillance systems of eating habits and eating patterns in representative samples of the population. While the smoking habit becomes less common among men in most countries, the rate of decline is very slow; among women, a real dent remains to be made. Although a causal relationship between alcohol consumption and
CHD risk has not been definitely established, national alcohol consumption trends should be closely monitored. A trend toward increasing consumption is present in most countries; a shift of the alcohol con-sumption curve toward the right will almost inevitably lead to an increase in the number of heavy drinkers, with all its undesirable consequences.10
ACKNOWLEDGEMENTS
Mrs Elisabet Helsing, Regional Officer for Nutrition, WHO (Copenhagen) provided material on nutrition. Dr Roberto Masironi, WHO Programme on Smoking and Health (Geneva), assisted with the latest publi-cations by himself and his colleagues. Data on alcohol consumption were contributed by Dr Frederick S Stinson, Alcohol Epidemiologic Data System, Wash-ington, D.C., and Dr Marcus Grant, Senior Scientist, Division of Mental Health, WHO, (Geneva).
REFERENCES
1Food and Agriculture Organization of the United Nations. 1986 FAG Production Yearbook, Rome, 1987, Volume 40. 2Uemura K and PisaZ.Trends in cardiovascular disease mortality in
industrialized countries since 1950. World Health Stat Q 1988; 41: 155-78.
3United States Department of Agriculture, Human Nutritionallnfor-mation Service, Nationwide Food Consumption Survey 1985, NFCS, CSFII,Reports No. 85-1 and 85-3, Washington, D.C. 4Kornitzer M, De Backer G, Dramaix M and Thilly C. Regional differences in risk factor distributions, food habits and coro-nary heart disease mortality and morbidity in Belgium. lnt Epidemioll979:8:15-21.
5Nutrition Unit, World Health Organization Regional Office for Europe, Healthy Nutrition: Preventing nutrition-related dis-eases in Europe. Copenhagen, (In press). 1988.
6Rothwell K, Masironi R, O'Byrne D. Smoking in Europe. Working
Document WHO/SMO/87.1. Geneva, World Health Organ-ization, 1987.
7Rothwell K, Misironi R. Cigarette smoking in developed countries outside Europe. Working Document WHO/SMO/86.2. Geneva, World Health Organization. 1986.
8Sulkunen P. Drinking patterns and the level of alcohol consumption: An international view. In: (Gibbins R Jet a\. eds.). Research advances in alcohol and drug problems, Vo\. 3. 1976, London-Sydney-Toronto: John Wiley. 1976: 233-80.
9Walsh B, Grant M. Public health implications of alcohol production and trade. WHO Offset Pub\. No. 88. Geneva, World Health Organization, 1985.
10Epstein F H. Alcohol and alcoholism: epidemiological and preven-tive approaches. In: Metabolic Effects of Alcohol (Avogaro P. Sirtori C Rand Tremoli E, eds.) 1979, Amsterdam-New York, Oxford, Elsevier Biomedical Press, pp. 13-26.