POIsketch: Semantic Place Labeling over User Activity Streams
Dingqi Yang
1, Bin Li
2, Philippe Cudr´e-Mauroux
11
eXascale Infolab, University of Fribourg, 1700 Fribourg, Switzerland
2Data61, CSIRO, Eveleigh NSW 2015, Australia
1
{firstname.lastname}@unifr.ch,
2[email protected]
Abstract
Capturing place semantics is critical for enabling location-based applications. Techniques for assign-ing semantic labels (e.g., “bar” or “office”) to un-labeled places mainly resort to mining user activ-ity logs by exploiting visiting patterns. However, existing approaches focus on inferring place labels with a static user activity dataset, and ignore the visiting pattern dynamics in user activity streams, leading to the rapid decrease of labeling accuracy over time. In this paper, we tackle the problem of semantic place labeling over user activity streams. We formulate this problem as a classification prob-lem by characterizing each place through its fine-grained visiting patterns, which encode the visit-ing frequency of each user in each typical time slot. However, with the incoming activities of new users in data streams, such fine-grained visiting patterns constantly grow, leading to a continuously expand-ing feature space. To solve this issue, we propose an updatable sketching technique that creates and incrementally updates a set of compact and fixed-size sketches to approximate the similarity between fine-grained visiting patterns of ever-growing size. We further consider the discriminative weights of user activities in place labeling, and seamlessly in-corporate them into our sketching method. Our empirical evaluation on real-world datasets demon-strates the validity of our approach and shows that sketches can be efficiently and effectively used to infer place labels over user activity streams.
1
Introduction
Semantically understanding human activity is a key ingredi-ent when developing human-aware applications. One criti-cal aspect of this understanding is semantic place labeling, which aims at assigning semantic labels to locations. For example, it is often more useful to know that a place is a bar rather than knowing its GPS coordinates only. By understanding the semantics of previously visited places, one can enable various location-centric applications such as personalized location based services [Yang et al., 2013a; 2013b] and user activity inference [Yang et al., 2015b].
The recent rise of Location Based Social Networks (LB-SNs), such as Foursquare1, made large-scale
spatiotempo-ral user activity data become more accessible. In LBSNs, users share their real-time activities with their social circles by checking in at Points of Interest (POIs), such as a given bar or French restaurant. In practice, the semantic labels of POIs in LBSNs are not always available due to a va-riety of reasons, such as the users’ unwillingness to label them, or some lack of information from service providers. The basic intuition behind automatically inferring POI labels is that POIs of the same type usually share similar visiting patterns, which are encoded by users’ check-ins. For ex-ample, [Cheng et al., 2011a] defines the traffic pattern of a POI as the aggregated check-in frequency in each time slot during a typical time period (e.g., 168 hours in a week), and uses such traffic patterns for place labeling. In that context, most of the recent contributions [Ye et al., 2011; Falcone et al., 2014] try to select the most representative fea-tures from a static dataset of check-ins in order to train dedi-cated classifiers.
However, as an intrinsically online data source, LBSNs continuously capture user activity data (7 million check-ins/day on Foursquare [Blog, 2015]), which makes the exist-ing place labelexist-ing approaches inadequate. Specifically, user dynamics in LBSNs (e.g., check-ins from newly registered users) make features selected on static datasets become less efficient for new POIs, leading to a rapid decrease in accuracy (see for example Figure 4(b) below for an empirical evalua-tion of this effect). Moreover, the high computaevalua-tional costs of existing approaches (e.g., random walks in [Ye et al., 2011]) make them ill-suited for streaming data.
Motivated by those facts, we introduce in this paper a novel approach for semantic place labeling over activity streams by leveraging data sketching techniques. Specifically, instead of using coarse-grained traffic patterns that encode tempo-ral dynamics [Cheng et al., 2011a] only, we consider fine-grained visiting patterns encoding both temporal and user dynamics, captured by the cumulative check-in frequencies of each user-time pairs during a typical time period. Our study shows that such finer-grained patterns yield more ac-curate labels (see Figure 4(a) for details). With large num-bers of check-ins, however, the size of the resulting
fine-1
grained visiting patterns makes the classification become impractical. One key idea to overcome this limitation is to apply sketching techniques [Aggarwal and Philip, 2010; Bachrach et al., 2009] in order to maintain a set of compact and fixed-size sketches of the original fine-grained visiting patterns while still preserving their similarity.
However, applying sketching techniques to our problem faces two challenges. First, our approach needs to be incre-mentally updatable, since the visiting pattern of a POI charac-terized by check-ins continuously grows, which departs from classical sketching techniques that focus on sketching com-plete data instances. Ideally, the new sketch of a POI visiting pattern should be incrementally computed from the former sketch and the newly arrived data. Second, users’ activities are not all equally important when labeling POIs. For ex-ample, check-in data showing less obvious routines are less discriminative for place labeling, and should be given a lower weight during the classification [Wettschereck et al., 1997]. Considering streaming check-ins implies that such discrimi-native weights might have to be dynamically recomputed over time, and more importantly, to be incorporated in classifica-tion with sketches.
To address those two challenges, we propose a data sketch-ing method that creates and incrementally updates sketches from streaming check-in data, while dynamically measuring their discriminability and seamlessly incorporating the result-ing weights into the sketchresult-ing process. Specifically, we re-sort to consistent weighted sampling techniques [Manasse et al., 2010] to approximate the min-max similarity when cre-ating the sketches, which has been proved to be an effective similarity measure for nonnegative data [Li, 2015]. For each incoming check-in at a POI, the sketch is directly updated based on the former sketch and the cumulative frequency of the newly arrived check-ins. To take into account the dis-criminative weight of each user-time pair, we first estimate the entropy weight for individual user-time pairs, and then dynamically incorporate such weights when creating and up-dating the sketches. In such a way, the discriminative weights are seamlessly propagated to the sketches (see Section 3.2 for details).
We evaluate our approach on two real-world LBSN datasets collected from Foursquare in New York City and Tokyo. Our empirical results (see Section 4) show that our approach can not only efficiently create and update sketches for the fine-grained visiting patterns of POIs, but can also ef-fectively preserve their similarity, yielding to very accurate inferred labels.
2
Related Work
Existing work on semantic place labeling mainly leverage three types of user activity data: diary data collected though surveys, continuously sampled data from wearable sensors, and self-reported activity data from LBSNs. Diary data, such as [Krumm and Rouhana, 2013], are collected by asking par-ticipants to fill out a questionnaire covering their visits in a certain time period. Due to this labor-intensive collection process, such datasets are however hard to maintain. Con-tinuously sampled data from wearable sensors usually
con-sist of fine-grained activity logs from various sensor read-ings (e.g., GPS, accelerometer, Bluetooth, WiFi, etc.), such as [Do and Gatica-Perez, 2014]. Although wearable sensors can provide fine-grained and continuous samples of user ac-tivity, obtaining large-scale datasets is difficult due to privacy concerns [Shilton, 2009]. Finally, LBSNs have attracted mil-lions of users reporting their daily activities by checking in at POIs. Previous work on semantic place labeling using LBSN datasets [Ye et al., 2011; Falcone et al., 2014] all try to manu-ally select representative features of visiting patterns based on static datasets, which are subsequently fed into a classifier for inferring the labels. However, the streaming nature of check-in data check-in LBSNs makes such features become rapidly less effective over time. To the best of our knowledge, this paper is the first attempt at addressing the semantic place labeling problem over streaming activity data.
Data sketching techniques were designed to handle mas-sive data, particularly data streams. Their basic idea is to maintain compact sketches allowing to approximate spe-cific properties of the original data. Sketches can power a wide range of applications, including enumerating different kinds of frequency statistics of data streams [Cormode and Muthukrishnan, 2005], or approximating the similarity of high dimensional data (e.g., documents and images) [Wang et al., 2014]. Sketching techniques have also been studied to approximate various similarity measures, including the Jac-card [Broder et al., 1998; Mitzenmacher et al., 2014], cosine [Kutzkov et al., 2015], and min-max [Li, 2015] similarities. In this paper, we leverage data sketching techniques to ap-proximate the min-max similarity between fine-grained vis-iting patterns from user activity streams. Different from ex-isting sketching techniques for min-max similarity that are all applied on complete instances [Manasse et al., 2010; Ioffe, 2010; Li, 2015], we focus on fine-grained POI visiting patterns that are based on continuously updated data. There-fore, we propose a new data sketching approach that creates and incrementally updates sketches from streaming check-in data, and also consider their discriminability in the sketching process.
3
Sketch-Based Semantic Place Labeling
The basic idea behind our approach is to create a concise and updatable sketch of the fine-grained POI visiting patterns over user activity streams in LBSNs, for the purpose of inferring place labels. For a specific POI, its fine-grained POI visiting pattern is represented by a vector V ∈ N|D|, where D is the activity vocabulary including all user-time pairs. The size of D is |U | · |T |, where U and T are the set of users and the set of time slots in a typical time period, respectively. Each element of Vi, i ∈ D encodes the cumulative count of the
corresponding user-time pair i on that POI. In this paper, we define the time slot as hours and the typical time period as a week (i.e., 168 hours in a week), which is a widely adopted method in studying check-in patterns [Yang et al., 2015a]. With the increasing number of users, the size of D rapidly grows. Therefore, in order to efficiently classify POIs (as-signing semantic labels to POIs) based on ever-growing V , our objective is to create and efficiently maintain a compact
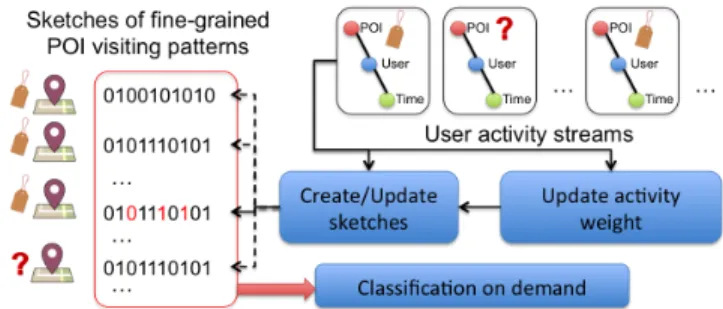
Figure 1: Overview of our approach
and fixed-size sketch S of V to effectively approximate the similarity between V of different POIs, such that the classifi-cation can be efficiently run based on S.
As illustrated in Figure 1, our approach takes user activity streams from LBSNs as input. For each check-in triplet (POI-user-time), we first update the global discriminative weights (see Section 3.2) of individual activities in D, i.e., user-time pairs. Based on the discriminative weights, we then update the sketches for each POI. In order to infer place labels, the classical classification method can then be performed on de-mand. In the following, we first present our updatable sketch-ing method for approximatsketch-ing the min-max similarity, and then discuss how to seamlessly incorporate the discriminative weights in the sketches.
3.1
Updatable Sketching Method
In this section, we present our updatable sketching method to approximate the min-max similarity, which is an effec-tive measure of similarity for nonnegaeffec-tive data [Li, 2015]. Given two fine-grained visiting pattern vectors Va and Vb, their min-max similarity is defined as follows:
SimM M(Va, Vb) = P i∈Dmin(V a i , Vib) P i∈Dmax(V a i , V b i) (1) The proposed sketching method creates sketches Sa and Sb of size K (K |D|) for Vaand Vb, respectively, with the
property that their collision probability is exactly the min-max similarity between Vaand Vb:
P r[Sja = Sbj] = SimM M(Va, Vb) (2)
where j = 1, ..., K. The min-max similarity between Vaand Vbcan then be approximated by the Hamming similarity
be-tween Saand Sb. The computation over S, which is compact and of fixed-size, is much more efficient than that over V , which is a large, ever-growing vector.
Sketch Creation
In order to create S from V , we borrow the idea of consistent weighted sampling [Manasse et al., 2010], which was orig-inally used for approximating min-max similarity for com-plete data instances. Specifically, given a vector V , it applies a random hash function hj on each (i, f ), where i ∈ D and
f ∈ {1, ..., Vi}, and obtains the corresponding hashed value
hj(i, f ). Note that the random hash function hj maps (i, f )
uniquely to hj(i, f ), which follows a uniform distribution
Figure 2: An example of sketch creation
over (0, 1), i.e., hj(i, f ) ∼ U n(0, 1). Then, one element of
S is returned as (i∗j, fj∗) = arg mini∈D,f ∈{1,...,Vi}hj(i, f ). The theoretical results show that:
P r[(ija∗, fja∗) = (ib∗j , fjb∗)] = SimM M(Va, Vb) (3)
In order to further reduce the size of the above sketches, a recent study [Li, 2015] proposed that it is sufficient to only keep i∗j in the above sketches, and also empirically proved the following property:
P r[ija∗= ib∗j ] ≈ P r[(ia∗j , fja∗) = (ib∗j , fjb∗)] (4) Therefore, for a specific random hash function hj, we assign
Sj= i∗j. By applying K independent random hash functions
(j = 1, ..., K), we generate sketch S (with size K) from V (with arbitrary size).
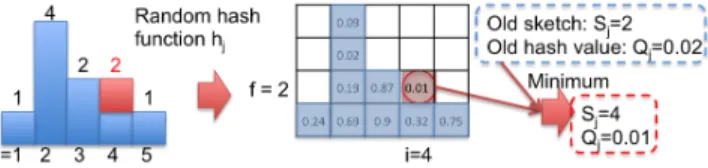
Figure 2 illustrates the sketch creation process. The left-hand side of the figure shows the histogram of a fine-grained visiting pattern V with an activity vocabulary size |D| = 5. By applying a random hash function hj on each (i, f ), we
obtain the corresponding hash values (shown in the blue cells), and then select the cell whose hash value is minimum: (i∗ = 2, f∗ = 3) with a corresponding hash value of 0.02. We hence obtain the corresponding sketch element Sj= 2.
Sketch Updating
As V incrementally grows with the incoming check-in data, our sketching method needs to be updatable. To achieve this goal, besides the sketch S, we also keep a vector Q (of size K) storing the corresponding minimum hash values (e.g., Qj = 0.02 in the above example). For each new check-in
at a POI (i.e., for a user-time pair r), the corresponding Vr
is increased by 1. In case of a new activity r /∈ D, we add r in D, and augment V to include Vr = 1. Then, we only
need to apply the hash function hj on (r, Vr). By comparing
the new hash value hj(r, Vr) with that of the old sketch Qj,
we update Sj = r, iff., hj(r, Vr) < Qj. If Sj is updated, we
also update Qjto its corresponding hash value, i.e., hj(r, Vr).
Figure 3 illustrates the sketch updating process following the previous example. The incoming check-in is added to V4,
re-sulting in a new V4= 2. We thus apply hjonly on (4, 2). By
selecting the minimum hash value between Qj = 0.02 and
hj(4, 2) = 0.01, we update Sj = 4, and the corresponding
Qj = 0.01. With K random hash functions, we maintain
a sketch S of size K and the corresponding minimum hash values Q for each V .
Note that the above updating process requires to access the former value of Vr. As it is continuously growing, we
maintain each V in a compact count-min sketch [Cormode and Muthukrishnan, 2005], which is a fixed-size probabilis-tic data structure (d rows and w columns) serving as a fre-quency table of elements, with an estimated frefre-quency error
Figure 3: An example of sketch updating
of at most w2 with probability 1 − (12)d. We set the
param-eters d = 10, w = 50 to guarantee an error within 4% with probability 0.999.
3.2
Discriminative Weight Consideration
All activities (user-time pairs) in D are not equally important to infer place labels. For example, if a user frequently goes to bars rather than other places on Friday night, we can label an unknown place he visited on a Friday night as a bar with high confidence. Traditionally, with a static dataset, we can mea-sure such discriminability as a discriminative weight, which can be easily incorporated in the inference process. However, with user activity streams, the discriminative weight of tivities might dynamically change; more importantly, the ac-tivity vocabulary D continuously grows. Therefore, we need to dynamically measure the discriminability of the activities and incorporate it seamlessly into the sketching process. To achieve this goal, we first define the weighted min-max simi-laritybetween fine-grained visiting patterns V as follows:
SimW M M(Va, Vb) = P i∈DWi· min(Via, V b i ) P i∈DWi· max(Via, V b i) (5) where Wi is the weight of activity i, i ∈ D. We note that
the discriminative weight Wihere is a global feature weight,
which is different from the “weight” of consistent weighted sampling, which represents the frequency of the data. In this section, we further discuss how to seamlessly incorpo-rate those weights in the sketching process, such that:
P r[Sja= Sjb] ≈ SimW M M(Va, Vb) (6)
where the approximate equality comes from Eq. (4). In the following, we first describe how to compute the weights be-fore turning to their incorporation in the sketching process. Weight Computation
We leverage a widely used weighting function, i.e., entropy weighting [Nakov et al., 2001]. (We note however that our approach is not limited to any specific weighting function.) Specifically, for a given set of place labels, C, we use entropy weighting to empirically measure the uncertainty of place la-bels when observing individual activities. For each activity i in D, we compute its entropy weight Wias follows:
Wi= 1 +
P
l∈Cpl,ilog pl,i
log |C| (7)
where pl,iis the probability that POIs with activity i are
la-beled as l, l ∈ C. Higher values of Wi imply higher degrees
of discriminability for the corresponding activity i. To cal-culate pl,i, we maintain a vector Fl for each place label of
size |D| to record the cumulative frequency of each activity in
D. With each incoming check-in, we update Flaccordingly.
Thus, we are able to empirically compute pl,i= Fl
i
P
l0 ∈CFil0 at any time. Particularly, for each incoming check-in i, only the corresponding Wineeds to be updated. To improve space
ef-ficiency, we also store Flin a compact count-min sketch data structure similar as the one we used for V .
Weight Incorporation in Sketching
We further extend our previous sketching method to incor-porate the discriminative weights W . Our previous sketch-ing method samples one element (i, f ) from V for each hash function hj. The key idea of incorporating W in the
sketch-ing process is to get sample (i, f ) with higher probability for larger Wi, since activity i is more discriminative in the
clas-sification. In the simple case of positive integer weight for W , for the same (i, f ), it is sufficient to generate Wi
differ-ent random hash values hmj (i, f ), m = 1, ..., Wi, and select
the minimum hash value ˆhj(i, f ) = minm=1,...,Wih
m j (i, f ).
In such a way, an activity i with larger weight will have more random hash values and thus have a higher probability to be the minimum (i.e., sampled as Sj), or vice versa. To extend
the above method for positive real weights, we follow the idea of [Chum et al., 2008] and design a new variable fol-lowing the same cumulative distribution function (CDF) with ˆ
hj. The new variable can be generated directly from one
ran-dom hash value only and Wi, rather than Wi random hash
values. Specifically, since hmj ∼ U n(0, 1), we compute the CDF of ˆhjas:
P r[ˆhj≤ x] = 1 − (1 − x)Wi (8)
for x ∈ (0, 1). We assume another random uniformly distributed variable z ∼ U n(0, 1), and formulate its CDF P r[z ≤ y] = y, y ∈ (0, 1) as:
P r[z ≤ 1 − (1 − x)Wi] = 1 − (1 − x)Wi (9) where y = 1−(1−x)Wiis an invertible continuous increasing function (x = 1 − Wip(1 − y)) over (0, 1). By applying the change-of-variable technique on Eq. (9), we obtain:
P r[1 − Wip
(1 − z) ≤ x] = 1 − (1 − x)Wi (10) Since Eqs. (10) and (8) show the same CDF, ˆhj can be
obtained by ˆhj= 1−Wip(1 − z). As (1−z) ∼ Un(0, 1), the
computation can be simplified to ˆhj= 1 − Wi
√
z. As we only care about the ordering of those hash values, we can further simplify the computations via a monotonic transformation, and obtain: ˆ hj = − log z Wi (11) Using Eq. (11), we can efficiently compute the hash value ˆ
hj from one random hash value, rather than generating Wi
different random hash values. More importantly, Eq. (11) can take any positive real weight.
Based on the above derivation, we only need to modify the hashing function in our previous sketching method to incor-porate W . Specifically, for both sketch creation and updating,
Table 1: Dataset statistics
Dataset New York City (NYC) Tokyo (TKY)
Check-in number 129,774 169,033
POI number 5,823 4,228
User number 6,981 2,495
we first update the current weight W , and then compute the hash value for each (i, f ) using ˆhjas follows:
ˆ
hj(i, f ) =
− log hj(i, f )
Wi
(12) where hjis the random hash function in Section 3.1.
We note that the consistent weighted methods proposed by [Ioffe, 2010; Li, 2015] can take positive real number vectors as input, so that the sketch for Eq. (5) can be directly ob-tained by regarding V ◦ W as input, where ◦ represents the element-wise product. However, these sketching methods re-quire to maintain three positive real number parameter matri-ces in memory, each of size K ∗ |D|. The ever-growing ac-tivity vocabulary D makes these methods impractical in our context.
4
Experimental Evaluation
In this section, we conduct a series of experiments to evaluate our approach. We first describe our experimental setting, fol-lowed by our results for assessing both the effectiveness and the efficiency of our approach.
4.1
Experimental Settings
We evaluate our approach on a check-in dataset collected by [Yang et al., 2015a; 2016] for about 18 months (from April 2012 to September 2013). Without loss of generality, we se-lect check-in data from two big cities, New York City and Tokyo, for our experiments. In our dataset, POIs are classified by Foursquare into 9 root categories (i.e., Arts & Entertain-ment, College & University, Food, Great Outdoors, Nightlife Spot, Professional & Other Places, Residence, Shop & Ser-vice, Travel & Transport), which are further classified into 291 sub-categories2. Table 4.1 summarizes the main
charac-teristics of our dataset.
In our experiments, we consider the POIs appearing in the first 9-month check-ins as labeled training data, and the new POIs in the last 9-month data (unseen in training data) as un-labeled testing data. As inferring POI labels is intrinsically a classification problem, we decided to leverage a KNN classi-fier [Mitchell, 1997], which does not require building a model from training data and can always takes the most up-to-date training data for classification. Such properties fit our case of rapidly growing visiting patterns well. It is important to note that our sketching method is not bound to the KNN clas-sifier, and can be used with any classifiers. We empirically set KNN with the five nearest neighbors, and report the clas-sification accuracy on both the 9 root categories (Lv1) and the 291 sub-categories (Lv2). The classification is triggered when 10 check-ins are observed for each POI tested.
2
https://developer.foursquare.com/categorytree
In order to evaluate our approach, we compare it with the following baseline methods:
• Coarse: We calculate the POI similarity based on their traffic patterns [Cheng et al., 2011b] (coarse-grained vis-iting patterns), which is represented by a vector with size |T | where each element is the frequency of check-in in the corresponding time slot. Euclidean similarity is used as similarity measure.
• Fine-Jaccard: We regard fine-grained visiting patterns as binary vectors, and measure their Jaccard similarity. • Fine-MinMax: We measure the min-max similarity of
fine-grained visiting patterns (Eq. 1).
• Fine-MinMax-Weighted: We measure the weighted min-max similarity of fine-grained visiting patterns (Eq.5). • Sketch-Jaccard: We use min-hash sketching [Broder et
al., 1998] to approximate Fine-Jaccard.
• Sketch-MinMax: Our method without discriminative weight (i.e., approximation of Fine-MinMax).
• Sketch-MinMax-Weighted: Our method with entropy weight (i.e., approximation of Fine-MinMax-Weighted).
4.2
Place Labeling Performance
In this section, we evaluate the effectiveness of our approach. We first compare our approach to the baselines, and then show the classification accuracy of different methods over time. Fi-nally, we study the impact of the sketch length on the classi-fication accuracy.
Comparison with other approaches
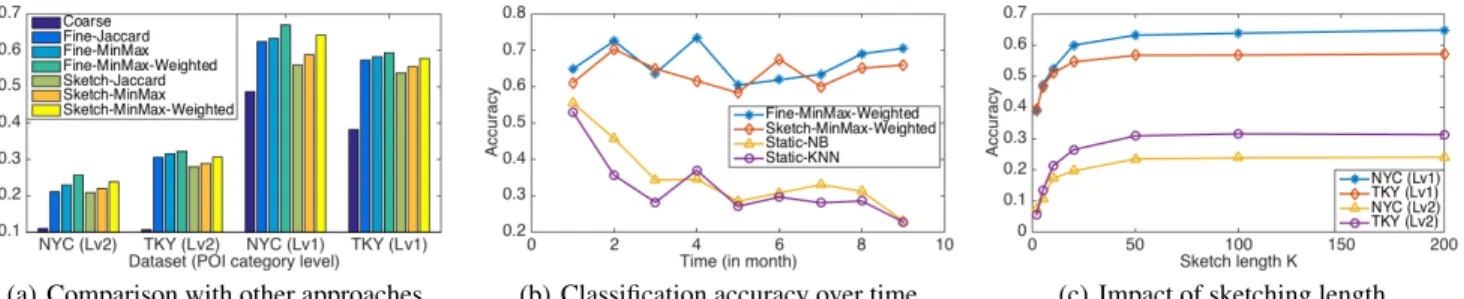
In this experiment, we compare our method to the baseline approaches by fixing the sketch length to 50 for all sketching methods (the impact of sketch length is studied below). Fig-ure 4(a) plots the average accuracy for both datasets on the two level categories. We observe that coarse-grained visiting pattern yields the worst results. Based on the fine-grained vis-iting patterns, classification with weighted max-min similar-ity achieves the best results, which shows the effectiveness of this similarity measure. Our sketching method outperforms all other sketching baselines. Particularly, compared to Fine-MinMax-Weighted, our sketching method can effectively ap-proximate the weighted min-max similarity with only a small loss in classification accuracy (e.g., about 3.3% on average for root POI categories).
Classification accuracy over time
We now study the classification performance of our ap-proaches over time. Specifically, we report the place label-ing accuracy for each of the 9 months, with a sketch length K = 50. We also implement two baseline classifiers trained only on static training data, i.e., Naive Bayes (Static-NB) and KNN (Static-KNN). All methods in this experiment use fine-grained visiting patterns. Figure 4(b) plots the results on NYC dataset and the 9 root levels of categories. (Experi-ments on the TKY dataset and on the 291 sub-categories show the similar results). We observe that our method consistently achieves good results by approximating the weighted min-max similarity over streaming data accurately. However, the
(a) Comparison with other approaches (b) Classification accuracy over time (c) Impact of sketching length
Figure 4: Place Labeling Performance
two classifiers based on static datasets show a rapid perfor-mance decay, which can be explained by two reasons. First, due to the high user dynamics (e.g., varying activity of users, newly registered users) in user activity streams from LBSNs, the fine-grained visiting patterns incrementally evolve. Sec-ond, with the continuously incoming user activities, the dis-criminability of user activities also dynamically changes. The two baselines based on a static dataset fail to capture these features, leading to rapid performance decay.
Impact of sketching length
To study the impact of the sketching length K on classifica-tion accuracy, we vary K within {2, 5, 10, 20, 50, 100, 200}. Figure 4(c) reports the average accuracy of our approach. We observe that the accuracy increases with increasing values of K, which implies that longer sketches can better characterize the similarity between fine-grained visiting patterns. More-over, there is no significant improvement when K gets higher than 50, which means that sketches with K = 50 are suf-ficient to characterize the similarity between V in practice. Therefore, we set the K to 50 in previous experiments.
4.3
Runtime Performance
To evaluate the efficiency of our approach, we investigate the execution time of both check-in data processing and place label classification, w.r.t, the sketch length K, K = {2, 5, 10, 20, 50, 100, 200}. All experiments were conducted on a commodity PC (Intel Core [email protected], 16GB RAM, Mac OS X) running MATLAB3version 2014b.
Figure 5(a) shows the KNN classification time (on log scale). We observe that using sketches can dramatically re-duce the classification time (with an order of 10,000x), since the Hamming similarity between sketches of small size can be much more efficiently computed than the weighted min-max similarity between the fine-grained visiting patterns of larger size. With short sketch lengths, we find little variance in the classification time across different K. The time differences between datasets are mainly caused by the different number of training POIs and the size of the activity vocabulary D in the two datasets. More training data and larger size of D im-plies longer execution times for the KNN classification.
Figure 5(b) reports the processing speed on check-in streams. We observe that the processing speed slightly de-creases with increasing sketch lengths, since larger K val-ues imply a larger number of random hash functions in the
3
http://mathworks.com/products/matlab/
(a) Classification time (b) Processing speed
Figure 5: Runtime Performance
sketching process. For K = 50, our test PC is able to process about 3,200 check-ins/sec on both dataset, which can easily accommodate the current Foursquare check-in stream where the peak-day record shows 7 million check-ins/day [Blog, 2015] (about 81 check-ins/sec on average). Since the sketch length K controls the tradeoff between the processing rate and accuracy (see Figure 5(b) and 4(c)), in practice, one can adjust K to improve accuracy at the expense of the processing rate margin.
5
Conclusions
In this paper, we introduce a novel semantic place labeling approach over user activity streams in LBSNs by leverag-ing data sketchleverag-ing techniques. Specifically, by characterizleverag-ing POIs through their fine-grained visiting patterns, we propose a sketching method to maintain a set of compact and fixed-size sketches to approximate their min-max similarity. More-over, in order to consider the discriminability of user activities for place labeling, we introduce a technique to dynamically measure such weights and seamlessly incorporate them into the sketching process. Based on two real world datasets col-lected from Foursquare, the evaluation results show that our approach can efficiently create and update sketches of fine-grained visiting patterns for the purpose of semantic place labeling.
As future work, we plan to explore user social networks to further improve the accuracy of the labeling, and consider the concept drift problem [Li et al., 2012] over time.
Acknowledgments
This work was supported by the Swiss National Science Foundation under grant number PP00P2 153023.
References
[Aggarwal and Philip, 2010] Charu C Aggarwal and S Yu Philip. On classification of high-cardinality data streams. In Proc. of SDM, pages 802–813. SIAM, 2010.
[Bachrach et al., 2009] Yoram Bachrach, Ely Porat, and Jef-frey S Rosenschein. Sketching techniques for collabora-tive filtering. In Proc. of IJCAI, pages 2016–2021, 2009.
[Blog, 2015] Foursquare Blog. Foursquare
check-in record. Available:
http://blog.foursquare.com/post/130625318273/7-million-check-ins, 2015. Accessed: 2016-01-18.
[Broder et al., 1998] Andrei Z Broder, Moses Charikar, Alan M Frieze, and Michael Mitzenmacher. Mwise in-dependent permutations. In Proc. of STOC, pages 327– 336. ACM, 1998.
[Cheng et al., 2011a] Zhiyuan Cheng, James Caverlee, Kr-ishna Yeswanth Kamath, and Kyumin Lee. Toward traffic-driven location-based web search. In Proc. of CIKM, pages 805–814. ACM, 2011.
[Cheng et al., 2011b] Zhiyuan Cheng, James Caverlee, Kyu-min Lee, and Daniel Z Sui. Exploring millions of foot-prints in location sharing services. Proc. of ICWSM, 2011:81–88, 2011.
[Chum et al., 2008] Ondrej Chum, James Philbin, Andrew Zisserman, et al. Near duplicate image detection: min-hash and tf-idf weighting. In Proc. of BMVC, pages 812– 815, 2008.
[Cormode and Muthukrishnan, 2005] Graham Cormode and S Muthukrishnan. An improved data stream summary: the count-min sketch and its applications. J. Algorithms, 55(1):58–75, 2005.
[Do and Gatica-Perez, 2014] Trinh Minh Tri Do and Daniel Gatica-Perez. The places of our lives: Visiting patterns and automatic labeling from longitudinal smartphone data. IEEE Trans. on Mob. Comput., 13(3):638–648, 2014. [Falcone et al., 2014] Deborah Falcone, Cecilia Mascolo,
Carmela Comito, Domenico Talia, and Jon Crowcroft. What is this place? inferring place categories through user patterns identification in geo-tagged tweets. In Proc. of MobiCASE, pages 10–19. IEEE, 2014.
[Ioffe, 2010] Sergey Ioffe. Improved consistent sampling, weighted minhash and l1 sketching. In Proc. of ICDM, pages 246–255. IEEE, 2010.
[Krumm and Rouhana, 2013] John Krumm and Dany Rouhana. Placer: semantic place labels from diary data. In Proc. of UbiComp, pages 163–172. ACM, 2013. [Kutzkov et al., 2015] Konstantin Kutzkov, Mohamed
Ahmed, and Sofia Nikitaki. Weighted similarity estima-tion in data streams. In Proc. of CIKM, pages 1051–1060. ACM, 2015.
[Li et al., 2012] Bin Li, Xingquan Zhu, Lianhua Chi, and Chengqi Zhang. Nested subtree hash kernels for large-scale graph classification over streams. In Proc. of ICDM, pages 399–408. IEEE, 2012.
[Li, 2015] Ping Li. 0-bit consistent weighted sampling. In Proc. of SIGKDD, pages 665–674. ACM, 2015.
[Manasse et al., 2010] Mark Manasse, Frank McSherry, and Kunal Talwar. Consistent weighted sampling. Technical Report MSR-TR-2010-73, 2010.
[Mitchell, 1997] Tom M Mitchell. Machine learning., 1997. [Mitzenmacher et al., 2014] Michael Mitzenmacher, Ras-mus Pagh, and Ninh Pham. Efficient estimation for high similarities using odd sketches. In Proc. of WWW, pages 109–118. ACM, 2014.
[Nakov et al., 2001] Preslav Nakov, Antonia Popova, and Plamen Mateev. Weight functions impact on lsa perfor-mance. Proc. of RANLP, pages 187–193, 2001.
[Shilton, 2009] Katie Shilton. Four billion little brothers?: Privacy, mobile phones, and ubiquitous data collection. Commun. ACM, 52(11):48–53, 2009.
[Wang et al., 2014] Jingdong Wang, Heng Tao Shen, Jingkuan Song, and Jianqiu Ji. Hashing for similarity search: A survey. arXiv preprint arXiv:1408.2927, 2014. [Wettschereck et al., 1997] Dietrich Wettschereck, David W
Aha, and Takao Mohri. A review and empirical evaluation of feature weighting methods for a class of lazy learning algorithms. Artif. Intell. Rev., 11(1-5):273–314, 1997. [Yang et al., 2013a] Dingqi Yang, Daqing Zhang, Zhiyong
Yu, and Zhu Wang. A sentiment-enhanced personalized location recommendation system. In Proce. of HT, pages 119–128. ACM, 2013.
[Yang et al., 2013b] Dingqi Yang, Daqing Zhang, Zhiyong Yu, and Zhiwen Yu. Fine-grained preference-aware lo-cation search leveraging crowdsourced digital footprints from lbsns. In Proc. of UbiComp, pages 479–488. ACM, 2013.
[Yang et al., 2015a] Dingqi Yang, Daqing Zhang, Longbiao Chen, and Bingqing Qu. Nationtelescope: Monitoring and visualizing large-scale collective behavior in lbsns. J. Netw. and Comput. Appl., 55:170–180, 2015.
[Yang et al., 2015b] Dingqi Yang, Daqing Zhang, Vincent W Zheng, and Zhiyong Yu. Modeling user activity prefer-ence by leveraging user spatial temporal characteristics in lbsns. IEEE Trans. Syst., Man, Cybern., Syst, 45(1):129– 142, 2015.
[Yang et al., 2016] Dingqi Yang, Daqing Zhang, and Bingqing Qu. Participatory cultural mapping based on collective behavior data in location-based social networks. ACM Trans. Intell. Syst. Technol., 7(3):30, 2016.
[Ye et al., 2011] Mao Ye, Dong Shou, Wang-Chien Lee, Peifeng Yin, and Krzysztof Janowicz. On the semantic annotation of places in location-based social networks. In Proc. of SIGKDD, pages 520–528. ACM, 2011.