Natural gas and pricing mechanisms in Europe: What
are the expectations for the coming years?
Bachelor Project submitted for the obtention of the Bachelor of Science HES in Economie d’Entreprise with a major in Commodity Trading
By:
Dimitri VIONNET
Bachelor Project Advisor:
Robert Piller
Geneva, August 19th 2016
Declaration
This Bachelor Project is submitted as part of the final examination requirements of the Geneva School of Business Administration, for obtaining the Bachelor of Science HES SO in the French equivalent of Business Administration – namely in Economie d’Entreprise, with major in Commodity Trading.
The student accepts the terms of the confidentiality agreement if one has been signed. The use of any conclusions or recommendations made in the Bachelor Project, with no prejudice to their value, engages neither the responsibility of the author, nor the adviser to the Bachelor Project, nor the jury members nor the HEG.
“I attest that I have personally accomplished this work without using any sources other than those cited in the bibliography. Furthermore, I have sent the final version of this document for analysis by the plagiarism detection software URKUND using the address supplied by my adviser”.
Geneva, August the 19th
Acknowledgements
First of all, I would like to express my sincere gratitude to all persons who directly, or indirectly, provided questions, comments and criticism regarding this paper as well as people who supported me during this project and during my academic studies at the Haute Ecole de Gestion.
Additionally, I would like to thank my Bachelor Project advisor, Mr. Robert Piller, for his work, dedication and passion to teach commodities and trading. His knowledge and passion for the commodities inspired me and made me want to learn more about the subject matter. That is why I chose this topic and this year, in his class was by far the best experience I had in my academic journey.
Finally, I wish to express my gratitude to all the teachers I had during these 3 years at the HEG. I would also like to thank all my family and friends for always being there for me. Their continuous support will and has always helped me throughout my life.
Executive Summary
In Europe, Natural gas pricing is a very interesting and complex subject. Today the European gas market is about to see a “BIG” change. In order to analyze the natural gas pricing in Europe and its evolution, we first need to understand that the European gas market pricing is divided in two main mechanisms.
On one side we find the Oil-Indexed gas price, which is a long-term contract with some exporting countries like Russia, while on the other side the competitive Hub price based on supply and demand (spot ex: UK NBP and Dutch TTF) located in Europe.
So, this drew to a battle between these two ways of pricing because the importers were buying gas on oil-linked deals that was higher than those paying at spot gas market levels (Hub). Through this decades pricing in Europe is the subject of many conversations, predictions and political debates.
During my last year of Bachelor program, attending classes of “Commodity Trading” helped me to analyze and understand some of the actual debates concerning the commodities. I sow that the natural gas market in Europe was very complex and maybe close to a turning point. That is why, as a student, I have tried to understand this market. Finally, the purpose of this project is to analyze this market and try to understand what could happen with these two ways of pricing and follow the evolution of natural gas pricing in Europe. As well as predict what could happen in the next years taking into account the maximum of factors.
Contents
Declaration ... i
Acknowledgements ... ii
Executive Summary ... iii
Contents ... iv
List of Tables ... vi
List of Figures ... vi
1.
Introduction ... 1
1.1
The natural gas in general ... 1
1.1.1
Definition ... 1
1.1.2
Production and distribution ... 1
1.1.3
Types and forms of Natural Gas ... 2
1.2
History ... 4
1.3
The gas market ... 5
1.3.1
Market structure ... 5
1.3.2
Gas Consumption (EU) ... 5
1.3.3
Production ... 6
1.3.4
Imports in Europe ... 7
1.3.5
Retail and market price in Europe (where traded) ... 8
1.3.6
Key Gas Industry Drivers ... 9
1.3.7
Key Gas Industry Players (By countries) ... 9
2.
The Dynamics for Oil-Indexed and Hub pricing ... 11
2.1
Hubs ... 11
2.1.1
Main Hubs ... 11
2.2
Oil-indexed gas contracts ... 13
2.2.1
Oil-indexed Prices ... 14
2.3
Storage ... 14
2.4
Pricing issues ... 15
3.
European Gas Contracts overview ... 16
3.1
LNG contracts ... 16
3.2
GSPA (Gas Sales and Purchase Agreement) long-term agreements ... 17
4.
The future of gas price in EU ... 23
4.1
Security of Supply ... 23
4.2
LNG vs. Coal ... 23
4.2.1
Combined Cycle Gas Turbine (CCGT) ... 25
4.3
Politic and geopolitics ... 25
4.3.1
The Nordstream II ... 25
4.3.2
Russian dependency ... 27
4.4
Impact of US LNG on Europe ... 29
4.5
A mature market ... 33
4.6
US comparison ... 34
4.7
Hubs under pressure ... 35
5.
Synthesis ... 36
5.1
Expectations and scenarios ... 36
5.1.1
Europe as a battleground ... 36
5.1.2
Renewable ... 36
5.1.3
A converging market ... 36
5.1.4
Climate issues ... 36
5.1.5
Russia as a conductor ... 37
5.1.6
A mature and liquid spot market (gas on gas) ... 37
6.
Conclusion ... 38
7.
Bibliography ... 40
Appendix 1 : Email from European energy commission ... 47
Appendix 2: European gas wholesale prices ... 48
Appendix 3: Platts UK NBP prices ... 49
List of Tables
Table 1 Gas supply chain ... 2
Table 2 LNG processing ... 3
Table 3 The gas market structure ... 5
Table 4 Gas major trade movements for 2015 in bcm ... 10
Table 5 European gas hubs ... 12
Table 6 The Nord stream II ... 26
Table 7 LNG export terminals ... 29
Table 8 European LNG terminals ... 30
List of Figures
Figure 1 Quarterly gas consumption in EU 2011-2015 ... 6Figure 2 LNG and Gas EU imports by sources (in %) ... 7
Figure 3 EU Imports of natural gas by source 2014-15 ... 8
Figure 4 Gas future price (ICE) ... 13
Figure 5 Long-term vs short-term gas prices ... 15
Figure 6 Natural gas equivalence from daily coal generation ... 24
Figure 7 EU imports of gas from Russia by supply route ... 27
Figure 8 Gas production costs ... 28
Figure 9 EU gas prices vs Henry Hub ... 31
Figure 10 Commodities and market liquidity ... 33
Figure 11 Hub development steps ... 34
1. Introduction
1.1 The natural gas in general
1.1.1 Definition
This is a fossil fuel that is used to cook, heat and generate electricity. Behind Coal and Oil, it is the third biggest energy resource used. Natural gas is a fuel with high efficiency and clean burning. It reduces the greenhouse effect, which is one of the main causes for global warming. (Source: Natural gas.org)
Main Use:
• Power generation
• Commercial and residential appliances • Natural gas vehicles
According to The Economic Times: “Natural gas is a mixture of gases which are rich in hydrocarbons. All these gases (methane, nitrogen, carbon and dioxide) are naturally found in atmosphere. Natural gas reserves are deep inside the earth near other solid and liquid hydrocarbons beds like coal and crude oil.”
1.1.2 Production and distribution
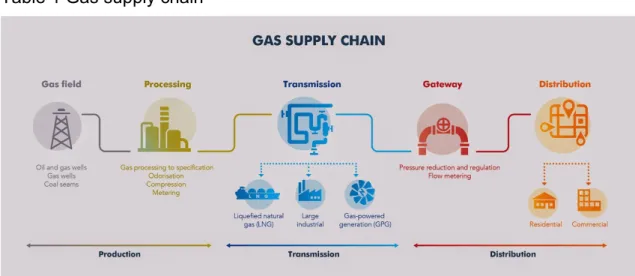
1Here we will see how natural gas is processed. As we can see on the Table 1, there are several steps in order to produce natural gas as a fuel. Every step is essential, from the exploration of the fields to the distribution.
First of all, professionals such as geologists will explore the surface structure of the earth in order to determine the area where there is a good probability to find gas. Once the area is determined, the geologist will proceed to further tests in order to collect more data and information about the potential gas in this area.
After collecting all the necessary information and data, the geologists will confirm that a natural gas spot has been located. Then, after having all the authorizations, they will move on to the extraction phase. The extraction is when all the big machines will come in and drilling experts will dig massive holes until they rich the gas area.
After reaching the gas area, we will have the production. It is important to understand that the gas that comes from the extraction often comes along with various other composites such as; water, stones, oil. This means that it must be cleaned in order to be ready for transportation and pipeline.
This practice includes the following main processes to meet the pipeline quality levels: • Oil and condensate removal
• Water removal
• Separation of natural gas liquids Sulfur and carbon dioxide removal • Odorisation (Security precaution in order to smell the gas)
The transportation is usually via pipeline, truck or big ships in order to be delivered to areas where demand is high. The natural gas can be compressed or liquefied according to the mode of transport. It is usually liquefied via ship and truck, and compressed via pipeline.
After transportation, the natural gas will be stored in big storage areas, where it is put into underground storage facilities for example depleted gas reservoirs, salt caverns, aquifers or above-ground reservoirs.
For the final steps of the delivery, the natural gas will be distributed to end consumers or to local distributor companies. The distribution will be mainly via natural gas pipeline at a large-volume.
Table 1 Gas supply chain
Source: The Australian Energy Market BlogSpot
1.1.3 Types and forms of Natural Gas
2There are different types of natural gas, they all have different characteristics and they don’t have the same state, component and utility. Hereunder are the main types of natural gas and their quick presentation.
The Pipe Natural Gas or natural gas is moving via pipeline, we call it Sales Gas in commerce. It is mostly composed of methane. It is sold to customers to be used as fuel for power generation or for industrial plants.
Natural Gas for Vehicles (NGV) is the form of natural gas that is used as fuel for vehicles. NGV is mainly composed of methane. It is also moved via pipelines to the gas stations. Once at the gas station, gas will be stored at high pressure and then it will be put into gas tanks.
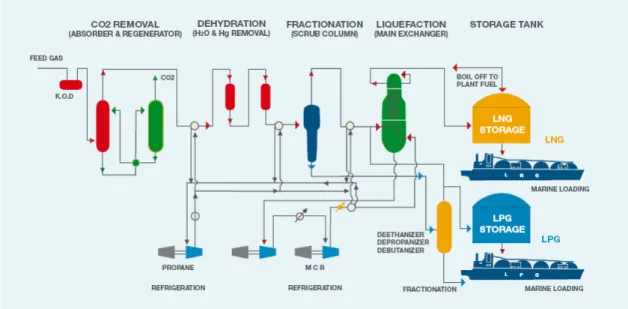
high-One of the most known is the Liquefied Natural Gas (LNG). Normally, the natural gas is transported via pipelines to users. However, the pipelines are very expensive which means that they are more used for small or medium distance. So, the solution for those high costs is LNG, knowing that the cost of transportation via waterway is cheaper than through pipelines.
The gas is liquefied by lowering the temperature to -160°C, (see Tab.2) which causes it to become much smaller in volume, and then we put the gas at atmospheric pressure in designed vessels in order to transport it to customers. (Based on the “ShaleTec” explanation)
Shale gas: it is a gas that is extracted from shale rocks by fracking it. Shale gas is a natural gas that is stuck in shale formations. The Shales are sedimentary rocks made with the accumulation of sediments, which can be big resources of natural gas.
We also call the gas associated or non-associated. Natural gas is regularly found in crude oil. Such natural gas is known as associated gas. This is why associated gas is called “wet gas.”
Finally, there are also reservoirs that contain only gas and nothing else. This gas is named non-associated gas. It comes from reservoirs that are not linked to any known liquid fuel; we call it the “dry gas.” (According to the “Britannica Encyclopedia”)
Table 2 LNG processing
1.2 History
3Natural gas is actually millions of years old. Although, the civilization neither knew nor understood what was natural gas, the discovery was around 1000 before Christ in ancient Greece. When the gas was naturally coming out of the floor surface, sometimes it was meeting some lightning strikes, creating some big fire coming from the earth, which were believed to be divine.
It was in 500 before Christ that the Chinese started to take advantage of this natural reaction. They were transporting this gas coming out of the surface to boil seawater, to separate the salt and make it palatable.
It is only around 1785, in Great Britain that natural gas was commercialized and used to light the streets and houses. In USA, natural gas industry began in 1859, when a former railroad constructor named Edwin Drake dug the first well in Pennsylvania. Drake was extracting oil and gas at more than 69 feet below the surface of the earth.
In 1891, one of the first major pipelines for natural gas was constructed from Indiana to the city of Chicago. This pipeline was unfortunately not really efficient due to technical gap. It is only after the World War II that natural gas really started to expend thanks to the progress in pipe rolling and metallurgy, allowing for a better transportation and a much easier access to this fuel.
In Europe, the modern history of natural gas started in 1959 with the discovery of new fields in Netherlands and in the North Sea. Later around 1980, new pipelines allowed Europe to import some natural gas from Russia and Algeria.
In 1990, new developments in technology made LNG more competitive. This followed with the construction of new LNG terminals around Europe and plans to create new terminals in Europe over the next years. Today, new production techniques allow us to produce natural gas from shale formations.
1.3 The gas market
1.3.1 Market structure
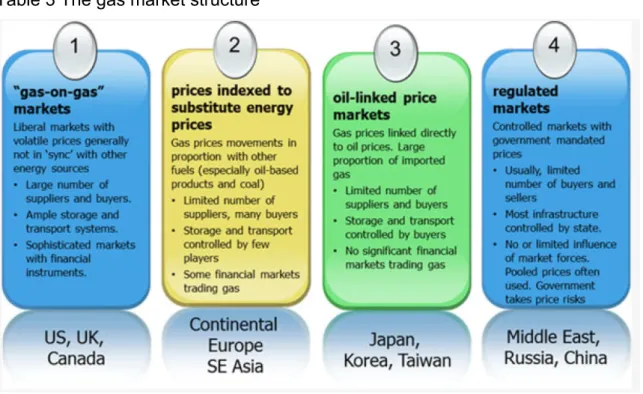
Table 3 The gas market structure
As we can see above on the « Natgas.info » Tab. 3, the European market is very similar to the Asian one. The suppliers are very limited, for example Russia, USA, Norway and Algeria. Also, gas is mostly indexed to other fuels like oil.
If we compare with the US, we can see that the market is more mature and based on a gas on gas pricing. The US market has way more suppliers.
1.3.2 Gas Consumption (EU)
In 2014, according to ACER Market Monitoring Report 2015, in Europe the natural gas consumption was falling by 11% compare to the previous year (2013) to exactly 4,460 TWh (Terawatt hour) meaning 456.53 bcm (Billion Cubic Meter)4.
Today (2016), Natural gas in Europe is representing around 25% of the total energy consumption. Around 26% is used in the power generation sector and more or less 23% in industry. The rest is generally used for heating buildings in the domestic and services sectors. (Source: European commission press release, Memo 16-310)
Furthermore, according to the market observatory for energy of the European Commission’s report, gas demand is not in equal proportion across Europe. Three quarters of the EU’s total gas consumption is only from six western European countries. There is Germany, UK, Italy, France, Netherlands and Spain.
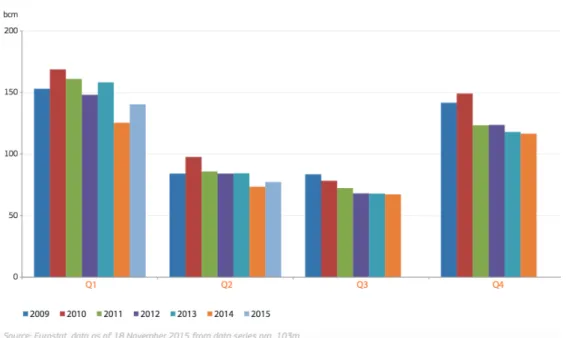
Referring to Figure 1 hereunder, in the first quarter, we can see a 12% increase from 2014 to 2015; the demand continues to rise in the second Quarter. Consumption went up to 77 bcm (Billion Cubic Meter), 5% more than the same period of 2014.
Figure 1 Quarterly gas consumption in EU 2011-2015
As very often, this increase in consumption was due to the weather. In almost all parts of Europe, the 2015 temperatures were much lower than in 2014, and especially in the first quarter.
1.3.3 Production
5In Europe, the total production in 2014 was 152 bcm. The biggest gas field is The Groningen in Netherlands. The Groningen production is generally 39.4 billion cubic meters per year.
According to an article on “Smart grid news”, the gas production went up due to the low temperatures in the first quarter of 2015. However, in the second quarter, production went down to 25 bcm, around 14% less than the same period of 2014.
In Denmark, the 2015 production went up to 7% and in the UK 10%. However, we have seen a big drop in the Netherlands 44% less and Romania 4% less. As a result, in the first half of the year, the European gas production dropped to 5% lower than in the same period of 2014. Finally, we can see that production really depends of the weather, the imports and the temperature.
1.3.4 Imports in Europe
According to Eurostat data, in 2015, the growing consumption and falling production led to 5% increase of Europe imports in the second quarter of 2015, reaching around 68 bcm.
Now speaking about the bill, the estimated gas import bill of Europe was around 74 billion euros in 2014. Then prices went down in 2015, which led to a decrease of around 71 billion euros.
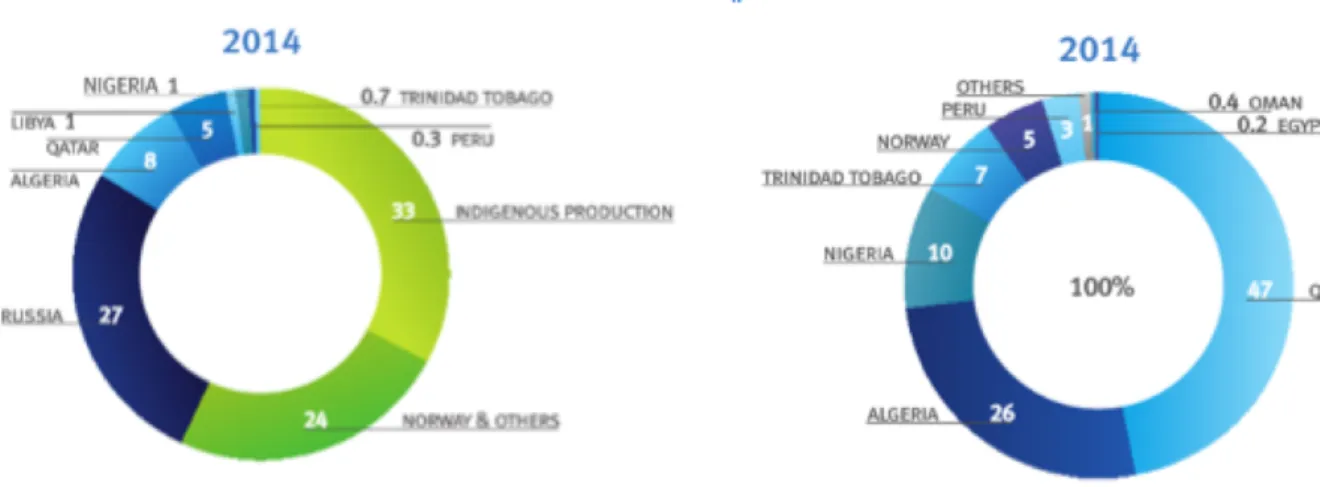
According to the two 2014 graph below (Fig. 2 Eurogas statistical report 2015), we can see how imports are essential for Europe. It is specially Russia for the natural gas with 27% (left graph). Then, in terms of LNG (right graph) we can see that is mostly coming from Algeria and Qatar with more than 73%. Finally, it is also interesting to see that according to Eurogas, imports of LNG covered 15% of total gas imports in 2014. Which is thought to increase significantly.
Referring to this graph below (Fig. 3), it is interesting to see that imports from Russia are kindly decreasing year on year. In my opinion, this might come as a consequence of political climate, which, I will talk about further down. However, the share of Algeria and Libya did not really change and stayed at around 10% of total imports. Finally, LNG and Norway are also both increasing.
Figure 3 EU Imports of natural gas by source 2014-15
Source: Quarterly report - European commission for energy 2015
1.3.5 Retail and market price in Europe (where traded)
According to the “Oxford Institute for energy studies”, depending on the marketplace, the price of natural gas is expressed in Euro (or other currency) per Megawatt hour.
In Europe, Natural Gas is traded on a hub, which means a virtual or physical location where we can exchange various gas volumes or where it is traded at the border before entering the national or European transmission network.
Additionally, gas can be purchased/sold on the traded market or can be contracted through long-term agreements. The European Exchanges give prices discovery, and eliminate credit risks as counterparty.
Wholesale price: Hubs prices of Natural gas in Europe are around 17 Euro/MWh (For
the TTF (Hub), according to PLATT’S).
Hereunder, we have the retail price for November 2015, in €cent/kWh and Euro per MWh.
• Gas retail prices, household customers 6.64 = 66.4 Euro/MWh
• Gas retail prices, industrial customers 3.07 = 30.7 Euro/MWh
It is important to note that in the case of households, all taxes and levies are included; in the case of industry, VAT and other recoverable taxes and levies are not included. (Source: “Europa energy site” document).
1.3.6 Key Gas Industry Drivers
There are many factors that influence the natural gas market. We can identify several major key drivers. They have not all the same impact but they are all important to take into consideration. A brief description of each key driver will be described below. (Sources: Book European Natural Gas Dem. By Honoré Anouk)
Firstly, we can consider the GDP growth of the country. The economic recession of 2008 has directly impacted the demand by reducing drastically the energy consumption. Then, we can also take into consideration the increasing threat of mild weather, knowing that the lower the temperature the more natural gas will be consumed.
It is also important to take into account the facilitation on Europe’s ability to attract LNG cargoes and all the infrastructures allowing the gas imports.
Additionally, based on “Timera energy’s explanation”, the global climate agreements have a big impact on natural gas. When we speak about CO2 emission, natural gas comes directly in mind as one of the cleanest fossil fuels.
Finally, as we will see later on, political relationships have one of the biggest impacts on natural gas. Indeed, countries have long-term agreements for natural gas exchange and potential issues might change the countries’ energy politics.
1.3.7 Key Gas Industry Players (By countries)
6In Europe, there are few sources for natural gas. The main gas players are:
• Russia (Gazprom)
• Norway (Statoil)
• Algeria (Sonatrach)
• Netherlands
• Qatar
For more than 35 years, the Norwegian company Statoil is one of the biggest suppliers of gas in Europe with a market share of around 15% according to their website. Their pipelines are mostly going to UK, Germany, Belgium and France. (Source: Statoil website)
6 Source : Melling, A.J. 2010 Natural gas pricing and its future: Europe as the
The Russian Gazprom, with a market share of about 30%, supplies around 156 billion cubic meters per year to Europe. Inside Europe, the largest gas field is in Groningen in Netherlands.
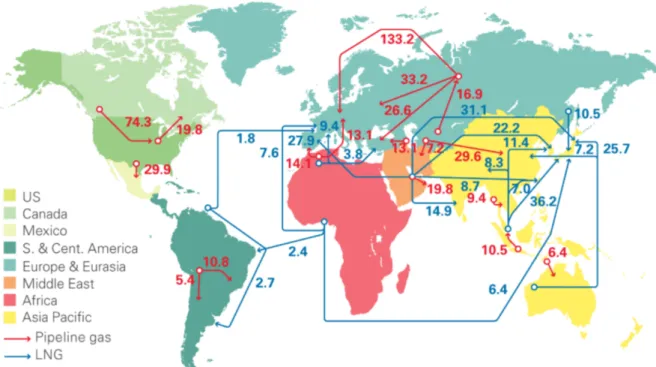
Focusing on Tab. 4, where we can see the major trade movements in bcm. In 2015, we can see that Russia was already the main supplier with more than 133 bcm. Finally, it is interesting to highlight how important is the proportion of LNG coming to EU.
Table 4 Gas major trade movements for 2015 in bcm
2. The Dynamics for Oil-Indexed and Hub pricing
It is important to understand that there are two essential pricing methods that are used for the trade of natural gas. We have the oil‐indexed pricing and the gas‐on‐gas pricing. For the oil-indexed, the price of natural gas is based on oil market spot prices, which vary according to oil supply and demand.
While for the gas‐on‐gas pricing, the price is based on the gas market spot prices, which will in this case vary according to the natural gas supply and demand.
2.1 Hubs
According to the European Regulators’ Group for Electricity and Gas, a hub can be defined as a distribution intermediary point between upstream and downstream. This brings buyers and sellers together to simplify the trade and bring standard and transparent conditions.
In the trading fields with natural gas, the hub can either be virtual, like a virtual point inside a pipeline system, e.g. the National Balancing Point in UK or it can be a physical point, for instance a place where some pipelines are joining together e.g. Belgium Zeebrugge.
Furthermore, trading within a hub allows more transparency on the prices, which gives more trust in the market. The biggest advantages of using a hub as a balancing point are that we are using an already existing mechanism and infrastructures in order to deliver gas and balance the market price taking into account the available storage volume.
According to the Clingendael International Energy Programme (CIEP), in Europe, the hub indexation was more or less between 30% and 55% of natural gas pricing market in 2013. In 2014, it was even more with a percentage of around 60% of the natural gas market.
2.1.1 Main Hubs
Now we will see the main Hubs and a brief description from the « Energyregulators.eu », following:
The PSV in Italy
One of the big advantages of the PSV is that the gas is coming from different sources. Such as; Russia, North Europe, North Africa and LNG import.
The CEGH in Austria
The Central European Gas Hub was founded in 2002 in Austria. The CEGH is a physical hub with a large technical and infrastructure capacity.
The NPB in UK
According to PLATTS, the NBP is located in UK. It is in operation since 1990. The price of this Hub is generally used as a benchmark for the wholesale gas market in EU.
The TTF in Netherland
The TTF is located in Netherlands and it has become bigger and bigger. It is now the second largest, just after the NBP. It is a major benchmark for the natural gas transactions in Europe. (From “Gas Terra” explanation)
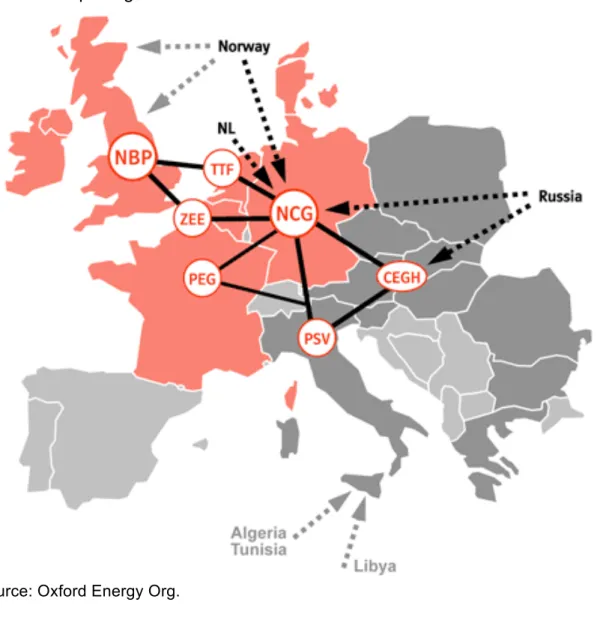
On Tab. 5, we can see the different Hubs as well as the different flows. The most important Hubs are mainly in Eastern Europe, supplied by Russia and Norway.
Hereunder, the prices (EUR/MWh) at the different hubs (Market/Spot) on November 2015 (PLATT’S):
• UK NBP: 17. 759
• Dutch TTF: 17.475
• Austrian VTP: 18.500
• Italian PSV: 19.900
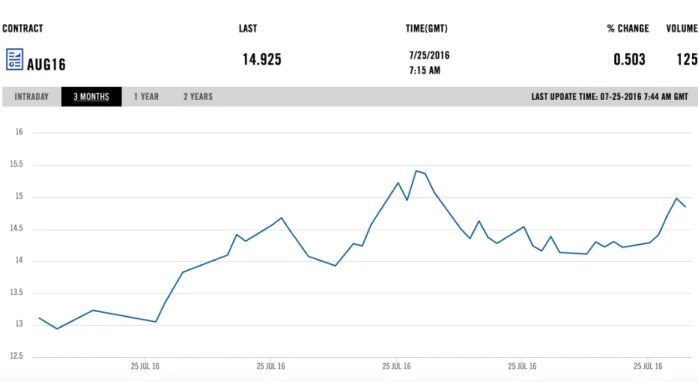
According to the graph below (Fig. 4) from the ICE, we can see that based on a 3 months average, the natural gas future price is kindly increasing. For August 2016, the price of the Dutch TTF is 14.925 Euro/MWh.
Figure 4 Gas future price (ICE)
2.2 Oil-indexed gas contracts
7Oil-indexed started with the Groningen in Netherlands. Sellers had nothing to fix the price and all the oil products were the alternative and substitute fuel so they took it as a benchmark. In the short-term, consumers were switching from oil to gas as natural gas was much cheaper.
Furthermore, during the term of the contract, the seller wanted to be sure that natural gas would be cheaper than the alternatives fuels in order to keep their market share.
To avoid an energy switch from gas to oil products, natural gas price needed to stay constant and don’t diverge too much from the alternative fuels. That’s why it was decided to put long-term gas contract prices linked to oil prices.
Today, the traditional long-term contracts are still in practice and are based on an oil-indexed price since 1970, which is mostly used for import via pipeline but also for LNG. Long-term gas contracts usually include take-or-pay obligations, which require the customer to pay for a certain amount of gas whether they use it, or not. But we will see that later.
We generally use the oil-indexed pricing with the following exports:
• Algeria to Italy, Spain and France
• Algerian LNG to France
• Russia to Germany, France, Belgium, Austria and Spain
• Norway to Germany
2.2.1 Oil-indexed Prices
The NWE oil-indexed prices on November 2015 were around 22.540 (Euro per MWh) according to Platts.
2.3 Storage
8Gas storage are necessary in order to stabilize variations in demand, which can of course change depending on the use for example; the demand for power generation, heating, or industrial use.
It also has a big function in securing the natural gas supply in cases when the demand is exceptionally high for example. The advantage of gas storage is that it is often located near the consumers and it can be available for use in a short time period. (Source: “Commission européenne press release).
Since we can store this commodity, gas inventories are necessary. It gives suppliers more flexibility to deal with consumption changes and also helps to reduce the expensive cost of transportation for importers. It is important to understand that the maximum import volume per day can be inferior to the demand peak, and that’s why storage is essential.
Finally, all these costs reduce the pipeline flexibility. Indeed the costs of an extended pipeline are really high, for that reason gas is usually stored close to the consumption area in order to reduce costs.
2.4 Pricing issues
The two different ways of pricing, oil-indexed and hub (spot) have always been causing diverse issues.
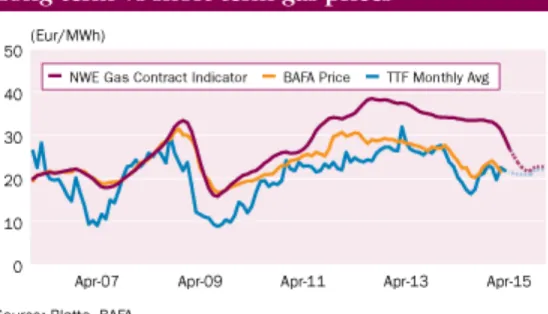
Figure 5 Long-term vs short-term gas prices
According to Fig. 5, if we focus on the NWE (oil-linked price) and the TTF (Hub/Spot price) we can see that in 2008, the financial crisis led to an important disconnection between oil-linked and spot gas prices. The spot prices went down after 2008 due to the gas market being hit by the low demand as a consequence of economic recession. However, the price of oil regained quickly because the oil market is international and so was influenced by a strong demand from big emergent country like China for example. Subsequently, oil-linked gas price was pretty high in contrast to hub/spot price that was still down which led to inequalities.
Because of this phenomenon users were enjoying access to cheaper hub prices while import companies were forced to buy gas at a more expensive oil-linked price. This happened due to the long-term contracts they had with different countries exporting gas in Europe, which caused importers big losses and an urgent need for renegotiations.
3. European Gas Contracts overview
3.1 LNG contracts
LNG sales and purchase agreements according to « Natgas.info »:
LNG contracts are generally based on hub prices. Furthermore, due to the large scale and internationality of the business, LNG contracts necessitate several legal agreements. Indeed LNG contracts (Shipped by the Sea) need more features than pipelines. (Shipping terms for example).
Following, we can see the “unique features” that LNG sales and purchase agreement includes: (Still according to “Natgas.info”)
«Buyer: Typically, Pacific region LNG buyers are large, government-supported, creditworthy gas or power utilities. However, today, many LNG buyers are no longer exclusively large monopoly utilities. Deregulation has created a host of smaller energy suppliers, many of whom are willing to sign LNG contracts and have access to receiving and storage facilities. »
«Price: When companies negotiated the first generation of SPAs (Sales and Purchase Agreements), many of the power plants operated by Japanese utilities were able to use either oil or natural gas to generate electricity, so the price of LNG was linked to the price of oil. Today, prices are often tied to market gas prices, especially in North America and Europe. LNG exporters are forced to accept fluctuating prices linked to market gas prices in the buying country, with or without floor and ceiling prices. »
Shipping terms: Deliveries can be on: (Incoterms)
« Free-on-board (FOB) basis, where the buyer takes ownership of LNG as it is loaded on ships at the export LNG facility. The buyer is responsible for LNG delivery, either on its own ships or ships chartered by the buyer. The contracted sales price does not include transportation costs. »
« Cost-insurance-freight (CIF) basis, where the buyer takes legal ownership of the LNG at some point during the voyage from the loading port to the receiving port. The seller is responsible for the LNG delivery, and the contracted sales price includes insurance and transportation costs. »
« Delivered ex-ship (DES) basis, where the buyer takes ownership of the LNG at the receiving port. The seller is responsible for LNG delivery, and the contracted sales price includes insurance and transportation costs. »
Transfer of title under:
« CIF contract, transfer of title or ownership of the LNG cargo, and associated risks, can legally occur at the regas facility, the international marine boundary, or any other mutually agreeable point on the ship voyage. »
3.2 GSPA (Gas Sales and Purchase Agreement) long-term
agreements
This is the base of long-term contract (oil-indexed) in Europe. According to “Natgas.info”, an independent natural gas information site, the gas sales and purchase agreement (GSPA) is an agreements between a seller and a buyer where they are liable in order to proceed to a transaction. It is generally transported via pipelines and involves strict requirements.
Natural gas info explains as follows:
Term
“The term of a GSA can be as short as one day or as long as the economic life of the field from which the gas is produced. Internationally, especially where a gas development project will have a limited number of potential customers, the terms could reach 20 or 30 years.”
Quantity
“Broadly speaking, there are two distinct types of volume commitments contracts: depletion contracts and the more common supply contracts. Under depletion contracts, also called output contracts, the producing company dedicates the entire production from a particular field or reserve to a buyer. In contrast, supply contracts commit the seller to supply a fixed volume of gas to the buyer for fixed term, typically 20 to 25 years. The seller is responsible for sourcing the gas, either from its own reserves or from third parties, if its own reserves are inadequate to fulfill the obligations.”
Price terms
“Gas must be priced at a level competitive with alternate fuels in the marketplace and provide an adequate return for all parties in the chain. Pricing may be fixed, fixed with escalators, or floating. A fixed price is a set negotiated price over the term of the contract and is usually found in shorter-term contracts. A fixed price with an escalator
is a fixed price that changes by a certain percentage every year or other specified time frame to reflect an inflator or an index of a known variable. Indexing prices
helps to ensure gas price competitiveness to alternate fuels and helps to integrate changes in the marketplace without renegotiating long-term contracts. Most gas contracts in Europe are indexed to the price of crude oil or other liquid fuel products imported by the gas buying country. Alternatively, a floating price varies according to prices reported by unbiased sources, such as newspapers and NYMEX quotations. In this case, the contracts are revalued every month or every week according to the reported prices. Prices, both fixed and floating, may also be limited to a maximum ceiling price or a minimum floor price for the term of the contract. Contracts may also have combinations of fixed and floating prices.”
Delivery obligation
“The terms of delivery may be firm or flexible. Firm delivery implies an obligation by the producing company or seller to deliver the specified quantities over the term of the contract. If the delivery obligation is not fulfilled, the seller may be obliged to pay damages or cover the costs of alternate fuels used by the buyer. Flexible delivery obligates the producing company to make attempts to fulfill the delivery obligation but does not require fulfillment of all the delivery obligations.”
Take-or-pay (TOP) obligations (will be explained in more details later)
“The basic premise of take-or-pay (TOP) is that the buyer is obliged to pay for a percentage of the contracted quantity. This is true even if the buyer is unable or fails to take the gas supplied by the seller, other than due to fault of the seller or force majeure incidents. The seller usually imposes this obligation on the buyer to guarantee a predictable minimum cash flow, and financial institutions involved in the gas field or pipeline development may require these obligations as a condition for financing. “
Delivery point
“This is the physical location where gas is delivered to the buyer. It could be at the gate of the power plant, the hub for a city grid, an interconnection of two pipeline systems, the site of a compressor, international border, or the fence of an LNG plant. This is often, but not always, the same geographic point where custody transfer—transfer of ownership and responsibility-of the gas takes place.”
Gas quality
“The GSA clearly states the quality of gas, including its maximum and minimum heating values (in Btu/MMcf units); maximum level of impurities like oxygen, CO2, SOx, and NOx; the delivery pressure; and water vapor content. If the seller delivers off-specification gas, buyers may be able to demand a discount, a reduction in TOP obligations for the period, or other remedies as specified in the GSA.”
3.2.1 Take or pay clause
Based on the “KS LAW” explanation, a take-or-pay clause is just an agreement where the buyer agrees to:
(1) Take, and pay the contract price for, a minimum contract quantity of
commodity each year (the “TOP Quantity”)
(2) Pay the applicable contract price for such TOP Quantity if it is not taken during
the applicable year.
In general, take-or-pay obligations are based on an annual contract. However the TOP might be used with different time periods (shorter).
In this agreement, the buyer or importer will not be in breach of the contract if he “fails” to take the TOP agreed quantity in the year. Sometimes in the year, the buyer can take zero deliveries without being in a breach of contract. However, at the end of the year, the buyer will have to make the payment on the basis of the difference between the TOP quantity and the actual quantity.
Furthermore, the TOP Quantity is generally not fixed. This quantity depends on the different events that could happen throughout the year. According to the KS LAW newsletter, the TOP Quantity will be modified if:
• The seller failed to make available for delivery;
• Were rejected as they did not meet quality specifications;
• The buyer could not take as a result of force majeure.
Indeed, the buyer is not obligated to pay for a product that is not distributed, also the TOP duty is only applicable if the commodity has the good specifications and finally if there is not a case of force majeure.
3.3 The contract comparison
First of all, as the Oxford Journal explains, it is important to understand that in US, the natural gas markets is mainly based on internal production. On the other hand, in Europe, the markets depend on external producers.
As a result, in USA the markets are less concerned with rivalry and competition than in Europe. Indeed, those different market structures and historical practices result in different implementations of the law and the contracting mechanism.
That is why, in this section, I found interesting to compare two contracts, one contract of LNG with the US9 (Which is the US Law) and another long-term gas contract in Europe10 (Which is the English Law). I have highlighted some differences.
3.3.1 General comparison
« 17.1 Definition of Force Majeure In USA
For purposes of this Agreement, “Force Majeure” means any circumstance whatsoever occurring after the date of execution of the relevant Confirmation Notice which is beyond the reasonable control of the Party affected (“Claiming Party”), acting as a Reasonable and Prudent Operator, that prevents or delays such Party’s performance under this Agreement and such Confirmation Notice. Provided that they satisfy the foregoing criteria, circumstances constituting Force Majeure shall include the following:
(a) Fire, flood, atmospheric disturbance, lightning, storm, typhoon, tornado, tidal waves, earthquake, landslide, perils of the sea, soil erosion, subsidence, washout, epidemic or other acts of God;
(b) War, riot, terrorism, civil and military disturbances, acts of the public enemy, piracy;(…) »
In Europe, we can see that the definition of “Force Majeure” is not as precise as in the US. However, they add a Long-term Force Majeure limit. Which we can understand as the majority of their contracts are based on a long-term basis. They have long-term contract with Russia for example.
In my opinion, the long-terms force majeure limit is positive. Considering that sometimes, a party can use the “Force Majeure” in order not to perform or to avoid paying.
“2.Market Disruption:
Upon the occurrence of a Market Disruption Event as specified in § 15.4
(Definition of Market Disruption Event), the Calculation Agent shall determine an alternative price to which the relevant Individual Contract shall be settled (the "Alternative Settlement Price") according to the applicable Fallback Mechanism contained in the provisions of § 15.3 (Fallback Mechanism).
In the event of a Market Disruption Event, the order of succession of § 15.3 (Fallback
Mechanism) from (a) to (c) shall be binding upon the Calculation Agent. The Calculation Agent can only use the next following Fallback Mechanism provision if the previous Fallback Mechanism provision is not available due to a Market Disruption Event or otherwise as provided in § 15.3 (Fallback Mechanism), as applicable.”
"Transfer of Title and Risk In USA 10.1 Title Transfer
Unless the Confirmation Notice specifies that 10.3 shall apply, the title to, and the risk of loss of any LNG sold under the relevant Transaction shall remain with Seller until
transferred to Buyer as the LNG passes the Delivery Point.”
An important difference is also the « Delivery point », which is not the same. For the contract of LNG, the delivery point is in accordance with Incoterms.
Indeed, pipeline does not allow determining the same delivery point as with a ship. That is why they have to agree on a delivery point at the beginning of the trade.
3.3.2 Pricing comparison
For me, the most important difference is the pricing. For the contract sales price of US LNG, we can see that they use the HH (Henry Hub) as a benchmark. In addition to that, they add 15%, which represents the different costs of export, the liquefaction costs and finally the shipping costs. (Source: ICIS the world's largest petrochemical market information provider).
Furthermore, US LNG contract price is floating as per the previous contract. This way of pricing is reducing the risks of price change, as it is floating and adapted. Compare to that, the price of the European oil-linked contract is fixed. Which increase price change risks.
However, the contract includes a « Market Disruption » clause (As seen on the contract above). This is an advantage for the Buyer as it is possible to adjust the price according to the market actual situation. This clause is often used these days, as pricing is the source of many arguments.
3.4 Gazprom vs. Statoil
The two biggest gas suppliers of Europe are facing new challenges. In 2013, the Gazprom production was 513 bcm vs. 45 for Statoil. Furthermore, Statoil has two times less market shares that Gazprom (According to their websites).
Gazprom is undoubtedly the strongest on the European market but things might be changing. Both are now using different pricing mechanisms. On one side the Hub pricing and on the other side the oil-linked formula.
According to the “Financial Times”, Statoil is now using the European hub prices as a benchmark for almost all of its contracts with Germany, UK, Belgium and Netherland. As a result, Statoil prices are now lower than Gazprom. This might put a lot of pressure on Gazprom’s pricing policy and thereby on the European natural gas market.
3.5 Negotiations
11In long-term oil-linked contract the prices are fixed in the agreement. However it can happen that the price is renegotiated for different reasons like when spot price drops strongly for example.
These price renegotiations between the buyers and the suppliers can be very
complicated sometimes. That is why it is really important to analyze and understand the current situation.
Indeedthe parties usually try to avoid goinginto arbitration and prefer to agree on a new price. Knowing that by the contact, both parties are responsible to regularly review prices and take into account the market evolutions.
4. The future of gas price in EU
4.1 Security of Supply
Based on the European energy commission data, the majority of the gas supplies in Europe comes from importations, which is not diversified, and generally coming from a single country. Any supply interruption would lead to an enormous negative impact for the country.
For that reason, in February 2016, In order to avoid any supply risks. The Commission recommended updatingtheir“Security of Gas Supply Regulation”.
According to the European Energy commission explanation, the characteristics of the regulation are the following:
“Creates a common indicator to measure serious threats to gas security known as N-1. This indicator refers to a situation in which a very important national gas installation such as a production facility or pipeline falls out of operation”
“Defines a supply standard that EU countries must prepare to meet even in the case of a disruption such as N-1. This standard means that countries must be able to supply at least 30 days' worth of gas to private households and other vulnerable consumers like hospitals”
“Requires EU countries to designate an authority specifically responsible for the gas supply”
“Requires the authority to create a Preventive Action Plan which assesses supply risks and proposes preventative measures such as investment in new pipelines”
“Requires the authority to prepare Emergency Plans for dealing with a crisis. These plans should include specific procedures that come into effect during a disruption and ways to coordinate with other national authorities”
“Sets up a Gas Coordination Group to coordinate actions and exchange information between national authorities and industry”
4.2 LNG vs. Coal
For The Economist: “The golden age of gas could just pass Europe by”. Spain and Eastern Europe keep protecting the coal mining, as this energy is still less expensive in order to produce power.
Not really optimistic, The Economist also said: “The near-collapse of Europe’s emissions-trading scheme means there is no realistic carbon price to reward the green advantage of gas over coal in power generation. While, renewables are having large subsidies lavished on them adding public fears over shale to the mix.”
On the other hand, according to “Natural Gas Europe”, an independent specialized website speaking about news, analysis concerns on gas, speaking about the Cop 21. The natural gas industry maintains that gas is a less expensive method to reduce greenhouse gas emissions.
According to “Natural gas Europe”, a natural gas representative said: “Coal
displacement is the low-hanging fruit, when it comes to climate change. “And no one is trying to really grab it, that is to stop using coal for power generation in Europe”. I think
that it illustrates well the current environment.
For example, Germany is generating 44% of its energy via coal making. It is one of the biggest coal consumers in Europe compared to Britain that proposed a coal phase-out within 10 years according to the Foreign policy group article.
Finally, I think that US LNG could be very competitive with coal. It could likely increase the gas consumption in the European market.
In the graph below it is interesting to see how important is the natural gas equivalence from coal generation in Germany, Poland and Turkey. That explains well the current position of Germany regarding the coal consumption.
Figure 6 Natural gas equivalence from daily coal generation
4.2.1 Combined Cycle Gas Turbine (CCGT)
The CCGT is a power plant that produces electricity especially with natural gas. According to Timera energy and ICIS (the world's largest petrochemical market information provider), due to natural gas price fall, UK is starting to use more CCGTs instead of the coal power plant.
In the last five years, low prices of coal were reducing the number of gas power plants. Also, natural gas power plants margins have fallen as CCGTs have been reduced. Which are reducing prospects for the increase of natural gas power plants causing the closure of an important number of gas power plants while investment in CCGTs are disappearing.
However, the low natural gas hub prices are challenging the advantage of coal. Even if we don’t really see de consequences today on the natural gas power plant margins, natural gas is becoming more and more interesting due to his low prices. Of course this has an optimistic impact on the future gas margins.
4.3 Politic and geopolitics
Natural gas is strongly influenced by politics and geopolitics. Here we will try to underline some of the main concerns that influence the natural gas prices.
4.3.1 The Nordstream II
12Russia, Germany, and a consortium of Western European companies are still speaking about the Nord Stream II gas pipeline project. This pipeline in parallel to the Nord stream one could double the total capacity to 110 billion cubic meters per years directly delivering the gas to Germany. However, this project is the source of many disputes. In September 2015, the project agreement was made for 2019. Gazprom’s management is planning an economic recovery in Europe and thanks to that an increase of the demand by 2019. Furthermore, they are planning a big decline on Norway’s gas extraction.
A previous project was called the South Stream but was abandoned. Comparing to the North Stream II, it was also bypassing Ukraine, however, North stream II is targeting new markets in Northwest and West of Europe.
For professor Anis Bajrektarevic, the Modern Diplomacy Advisory Board Chairman:
“This arching pipeline network eliminates any transit bargaining premium from Eastern Europeans and poses in effect a joint Russo-German pressure on the Baltic states, Poland, Ukraine, and even as far as to Azerbaijan and Georgia.”
12 Source : Socor, V. and Geopolitical Minotor. 2015 Nord stream Two: Implications
Table 6 The Nord stream II
Source: Gazprom
As we can see above, The Nord Stream II in yellow will have a capacity of 55 bcm/y traversing the Baltic Sea arriving at the Lubminer Heide gas hub in Germany. It would be bypassing Ukraine and result in Gazprom controlling gas transportation to Western European customers.
According to Forbes magazine, the costs of the project were estimated at 9.9 billion Euros. As we can see on Fig. 7, the Ukraine route is the most used, which would give credit to this huge project. Finally, I think that this would have a positive impact on Europe’s security of supply as the Russian/Ukrainian conflict is putting a lot of pressure on the certainty of the European supply.
Figure 7 EU imports of gas from Russia by supply route
Source: European commission for energy
4.3.2 Russian dependency
13There was a time when Russia was able to influence other countries with its gas supplies. It is still the case, however, the threat is less effective than before.
As we saw previously, Russia represents around 30% of Europe’s gas imports. According to the Oxford Energy Institute, it will take some time to considerably reduce the European dependence on Russian gas. It is thought the situation might not change before 2020.
However, thanks to the arrival of Azerbaijan, the countries that are really dependent of Russia, for example South Eastern Europe, could start to reduce little by little the Russian imports by 2020. Thereafter, it could be the same scenario for central Europe. Nevertheless, it is important to note that with its strong market influence, Russia will still be in a strong competition with all other suppliers whether with pipelines or LNG.
Furthermore, according to the Brown Political Review, speaking about the “European Gas War”, the conflicts between Ukraine and Russia regarding the Crimea annexation will likely change the geopolitical situation in Europe.
Today, Europe is clearly dependent on Russian gas, however since the conflict in Ukraine has intensified, the European Union is thinking about becoming less dependent on the gas coming from Russia. Furthermore, EU has blocked further project of Russian gas imports. As a result, the South Stream project that was supposed to transport the gas through the Balkans was forced to discontinue.
13Source : The Oxford Institute for Energy Studies, Yafimava, Reducing European
Finally, as we can see on Fig. 8 according to the Financial Times, Gazprom is one of the lowest-cost gas producers. Which gives them a big bargaining power, similarly to Saudi Arabia in crude oil.
4.4 Impact of US LNG on Europe
As we can see below, the number of LNG terminals in USA is high. The most are in the US East Coast, which could facilitate the Export of LNG to Europe.
Table 7 LNG export terminals
Table 8 European LNG terminals
Source: Energy Mining Advisory Partnership
As we can see on the map (Tab. 8), the number of LNG terminals in Europe is even higher than in US. According to that, we can see that France has received around 114 LNG shipments in 2015. In the near future, we can predict an important number of imports as per the important number of LNG terminals.
Furthermore, in April 2016, the first gas tanker from Louisiana loaded with U.S. natural gas arrived in Portugal. Poland has also received some US LNG, which could likely agitate the European gas market.
According to the “Energy Mining Advisory Partnership” from London, the main commercial reason for that new US export is that USA keeps increasing the gas production like the shale gas, which automatically reduces the price of natural gas in the US to one-third of European levels. Therefore, they need to avoid this oversupply that will keep lowering the prices.
This graph (Fig. 9) from “BTU Analytics” based on Bloomberg shows the prices of the US LNG to Europe and other prices in Europe like the NBP or the price of long-term contracts. There is an important price difference between the prices in Europe and the LNG coming from the US.
But as seen earlier, prices are kindly converging due to the long-term contract negotiations between Russia and Europe.
Figure 9 EU gas prices vs. Henry Hub
In Europe, according to the « Wall Street Journal » analysis, US gas will start a price war, lowering the price for consumers. Dominated by Russia, European gas market could be a big market for American gas. Thanks to the Shale gas boom, the US is planning to be a serious gas exporter.
A number of long-term contracts have already been signed between Cheniere (an American company engaged in LNG exports) and some European gas companies such as Royal Dutch Shell.
This is why we can really predict that the US will generate a huge price war in Europe putting pressure on Russia. Actually Russia is supplying more or less a third of EU’s natural gas via pipeline. For example Germany is getting 50% and Italy 30% of their gas from Russia.
As we have seen on the graph before, and according to “The Wall Street Journal” analysts: “Russia could cut the prices it charges its European customers to try to chase
According to Gazprom’s deputy chairman Alexander Medvedev, a gas price war is really not planned. However, if the LNG from US is lowering the prices, they will indeed try to reduce their costs in order to reduce the prices.
Still based on the «Wall Street Journal » analysis and according to the agency « Argus Media » numbers, the Liquefied natural gas coming from USA to Europe, costs around $4.30 per MMBTU. If we compare to Russia ($5.80), it is 1.5 dollars cheaper.
Yet, it is important to take into account that pipeline gas prices could be cheaper than LNG. Indeed LNG costs a lot, as it has to be liquefied, shipped and finally regasified after shipping. Based on that, analysts say that Russia could reduce the prices (from pipeline) to below $3.
Lastly, based on a speech from Trevor Sikorski a consultant on energy from London, the impact of US LNG is to be seen on a long-term basis. However, he says that: “The new
LNG will put downward pressure on prices, and losing both volume and value could be a hard pill to swallow for Russia” according to the “Wall Street Journal”.
4.5 A mature market
On the graph below, we can see the different commodities and their market in USA. The natural gas is mature and liquid. That means that there is a lot of exchanges, a high level of competition and margins are low when the market is really mature. However in Europe, it is not the case yet.
The gas market in Europe is kindly converging to the American market. However if I had to place it on the Fig 10, I would put it close to the US Liquefied natural gas as SEMI-LIQUID.
Figure 10 Commodities and market liquidity
Here (Fig. 11) are the different steps for the development of a hub. This is clearly showing the current European market. Indeed, the European hubs are taking time to be developed. The majority of the European hubs are not developed yet.
Figure 11 Hub development steps
Source: Oxford Energy Org.
4.6 US comparison
14First of all prices in USA are expressed in dollars per mmbtu (which means dollar per one million British thermal units) and in Europe, it is one Euro per MWH (Euro per Megawatt hour).
1 MMBtu = 0.29329722222222 MWh
In North America the gas market is pretty mature and it is driven by the Henry Hub (HH) spot price. The really low prices in USA ($4/mmbtu) are the consequence of the oversupply due to the boom in shale gas. This oversupply was also due to the lack of exports from US. However, thanks to the exports now we can see a forward curve in “Contango” in the US.
Like in the US, the European market is also determined on hub prices, as we have seen before with the UK NBP, the Dutch TTF and the German NCG. However, oil-indexed prices still remain in Europe, which is not the case in US.
Figure 12 Use of oil-indexed and hub pricing in EU
On the Fig. 12, we can see the evidence of the oil indexation decrease. In 2010, only 67% of the gas price was indexed to oil compare to 94% five years earlier.
4.7 Hubs under pressure
For “Timera Energy”, Hubs are really getting more and more under pressure. This might be due to the Liquefied Natural Gas market. Because of the falling price in Asia, Europe will be a more attractive market. Indeed, the major reasons of more LNG cargoes going to Europe are the following:
• The seasonal reduction of the LNG demand in Asia
•
New project of LNG thanks to new liquefaction capacity in Indonesia, Colombia and AustraliaAs a result, we might see a risk of price drop in Europe mainly due to an oversupply possibility in the coming years.
5. Synthesis
5.1 Expectations and scenarios
Based on the facts, information and literature search presented in this study, we can make some well-informed predictions for the coming years. These are my thoughts and what I think that could happen.
5.1.1 Europe as a battleground
Europe is becoming a big customer for the natural gas export and there are a few countries that are really exporting to Europe, the major being Russia. However, the US are slowly becoming part of the gas market with their LNG exports.
According to “Fitch Group”, a global leader in financial information. US are very interested in shipping LNG to Europe. Indeed, the cost of the gas, transportation and regasification are below the European spot prices at around USD4/mmbtu (million British thermal units). Which is interesting for them as the NBP spot prices is around USD4.3/mmbtu in the UK.
Based on that, we might see a serious increase in the US LNG imports. More and more LNG cargos are coming to Europe and that might have a big impact on the European natural gas market. Finally, the prices might be a big challenge between USA and Russia as both will try to fight for their market share.
5.1.2 Renewable
15As I have seen on the EIA Working paper, policies that regulate strict control of the emission are likely to encourage a shift from fossil fuel to renewable energy. The rise of renewable energy will probably have a big impact on the energy mix and of course on the natural gas prices.
If those policies are applied natural gas might be falling apart as demand might drop dramatically and prices might follow.
5.1.3 A converging market
16I think that the EU market will kindly converge with the US market. It is very likely that the price of the US gas will increase due to exports, reducing the supply inland and increasing the needs.
On the other hand, market price in Europe will likely decrease. This could be due to the increase of LNG coming from different countries. Indeed, this might create an oversupply in Europe and the prices could drop.
5.1.4 Climate issues
As we have seen before, for example with the COP 21, the climate change is a big concern today. Natural gas is one of the cleanest fossil fuels with a low environmental
In that case, I expect that gas prices might be directly and positively affected due to a serious increase in demand.
5.1.5 Russia as a conductor
17In this scenario we can highlight the bargaining power of Russia. By maintaining high price, Russia will keep the European gas market attractive, most likely resulting on new US LNG projects.
However, if Russia reduces prices, US LNG project might be less profitable and USA might be discouraged which at term, would cause Russia to keep its market share in the European Market. In this case, USA might change to the Asian market that could be more profitable for them.
In addition, I was wondering if USA could be overtaking Russia in terms of market shares. In order to find an answer to my question, I have made a calculation based on different information I have found.
According to EIA (US Energy Information Administration), the Federal Energy Regulatory Commission only allows a certain quantity of gas to be exported. This maximum quantity is 4.16 billion cubic feet18 per day. This would represent around 41 billion cubic meters per year. Then, according to Reuters, we can see that Russia has exported more than 158 bcm to Europe in 2015. As a result, we can see that USA is far from overtaking the Russian machine.
Finally, in case of a price drop, caused by the increasing supply in Europe, Russia will have no interest in changing their long-terms contract, keeping their prices high, ensuring a revenue stream and hedging against spot prices volatility.
5.1.6 A mature and liquid spot market (gas on gas)
The natural gas market in Europe will probably be more liquid and mature in the coming years. As explained by the “Center on regulation in Europe” paper, if a spot market is liquid, we normally use long-term contracts in order to hedge against volatile spot prices, sharing the risks between the counterparties.
However, the long-term contract hedge is not working anymore if we switch to spot price. Market will be more liquid and as a result more volatile. In my opinion, the long-term contract price will kindly converge with the spot market price, but we will not see a drastically transition to a fully “gas to gas” market in the short-term.
Finally, if long-term contracts are fully indexed to the spot price, there will be no interest to keep long-term contracts. Unless to ensure a supply security for Europe.
17 Source: The Oxford Institute for Energy Studies. The impact of lower gas and oil prices on
global gas and LNG markets.