HAL Id: hal-00759668
https://hal.archives-ouvertes.fr/hal-00759668v2
Submitted on 2 Dec 2016HAL is a multi-disciplinary open access archive for the deposit and dissemination of sci-entific research documents, whether they are pub-lished or not. The documents may come from teaching and research institutions in France or abroad, or from public or private research centers.
L’archive ouverte pluridisciplinaire HAL, est destinée au dépôt et à la diffusion de documents scientifiques de niveau recherche, publiés ou non, émanant des établissements d’enseignement et de recherche français ou étrangers, des laboratoires publics ou privés.
Force Distributions in Dense Two-Dimensional Granular
Systems
Farhang Radjai, Michel Jean, Jean Jacques Moreau, Stéphane Roux
To cite this version:
Farhang Radjai, Michel Jean, Jean Jacques Moreau, Stéphane Roux. Force Distributions in Dense Two-Dimensional Granular Systems. Physical Review Letters, American Physical Society, 1996, 77, pp.274 - 277. �10.1103/PhysRevLett.77.274�. �hal-00759668v2�
Force Distributions in Dense Two-Dimensional Granular Systems
Farhang Radjai,1Michel Jean,2Jean-Jacques Moreau,2and Stéphane Roux31HLRZ, Forschungszentrum, 52425 Jülich, Germany 2
LMGC, Université de Montpellier II, Place Eugène Bataillon, 34095 Montpellier Cedex 05, France
3LPMMH-ESPCI, 10 rue Vauquelin, 75231 Paris Cedex 05, France
Relying on contact dynamics simulations, we study the statistical distribution of contact forces inside a confined packing of circular rigid disks with solid friction. We find the following: (1) The number of normal and tangential forces lower than their respective mean value decays as a power law. (2) The number of normal and tangential forces higher than their respective mean value decays exponentially. (3) The ratio of friction to normal force is uniformly distributed and is uncorrelated with normal force. (4) When normalized with respect to their mean values, these distributions are independent of sample size and particle size distribution.
Despite the highly uniform density of a random pack-ing of noncohesive particles, photoelastic visualizations provide a striking evidence of the heterogeneous distribu-tion of contact forces on a scale definitely larger than the typical particle size [1 – 3]. A quantitative characteriza-tion of these distribucharacteriza-tions is relevant both to mechanical processing (compression, compaction, flow, grinding) and fundamental understanding (mesoscopic scales, instability thresholds) of granular media [4– 7].
This Letter is concerned with a numerical study of this problem in confined two-dimensional packings at static equilibrium. We are interested in the statistical distributions PN and PT of normal forces and (absolute values of) friction forces N and T , independently of contact orientations. We also study the distribution Ph
of the dimensionless variable h T yN, which is a measure of friction “mobilization” within the Coulomb range f0, mg, where m is the coefficient of friction between disks. Scaling with sample size and relation among the three distributions will be considered too.
Numerical results will be presented here for four samples of 500, 1200, 4025, and 1024 particles, referred to as samples A, B, C, and D, respectively. Particle radii are uniformly distributed between 3.8 and 7.5 mm in samples A and B, and between 1.5 and 7.5 mm in sample C. Sample D contains 192 particles of radius 1.6 mm, 320 particles of radius 1.05 mm, and 512 particles of radius 0.65 mm. Particles are contained in a rectangular frame composed of one planar base, two immobile walls, and one horizontal plane (the lid) free to move vertically and on which a downward force of 6600 N is applied. The acceleration of gravity is set to zero in order to avoid force gradients in the sample. Particle-particle and particle-base coefficients of friction are 0.2 and 0.5, respectively. All other coefficients of friction are zero.
For this investigation, we have relied on the contact dynamics (CD) approach to the dynamics of perfectly rigid particles with unilateral contacts. Since particles cannot interpenetrate, the allowed configurations of the
system, characterized by a set of inequalities, define a region in the configuration space presenting a large number of edges and corners. Moreover, the basic Coulomb’s law of friction, relevant to most of the granular media of interest, is a nonsmooth law in the sense that friction force and sliding velocity at a contact are not related together as a function. Finally, in the case of collisions velocity jumps occur, so that the evolution is not globally governed by differential equations in the classical sense.
The most commonly used algorithms are based on reg-ularization schemes. In this way, impenetrability is ap-proximated by a steep repulsive potential and Coulomb’s law by a viscous friction law, to which smooth compu-tational methods can be applied. The dominant feature of the CD method is that the conditions of perfect
rigid-ity and exact Coulombian friction are implemented, with
no resort to any regularization. At a given step of evo-lution, all kinematic constraints implied by lasting in-terparticular contacts and the possible rolling of some particles over others are simultaneously taken into
ac-count, together with the equations of dynamics, in order to determine all contact forces in the system. The method is thus able to deal properly with the nonlocal character of the momentum transfers— resulting from the perfect rigidity of particles in contact.
Detailed descriptions of the CD method can be found in the literature [8 – 10]. In relation with the present in-vestigation, we would just like to underline the point that dynamics is an essential ingredient of this approach. It is well known that a granular system at static equilibrium is
hyperstatic; i.e., for given boundary conditions there is a
continuous set of possible contact forces. This is due both to the absence of an internal displacement field ( because of perfect rigidity) and to the nonsmooth character of the friction law [11]. In the CD method, the force network at static equilibrium is determined through the dynamic
pro-cesses from which it relaxed. In other words, as in real
asymptotically as the kinematic energy of the system is dissipated in friction and collisions.
Of course, this does not mean that the statistical dis-tribution of forces is necessarily dependent on the prepa-ration process. The most probable force distribution may well result from the generic disorder of granular systems [3]. However, density is a major control parameter of the mechanical properties of granular materials, and only in the steady state, reached after enough shear-induced vol-ume change, it acquires a rather well-defined value for a given confining pressure [12]. That is why we applied the same procedure to prepare all samples in the same state: Filling the box with particles under gravity, shearing by moving the base horizontally (dilation occurs then), stop-ping shear and applying the confining load on top of the sample, and, finally, setting the gravity to zero and allow-ing the system to relax to equilibrium under the load. Al-though the algorithm is quite efficient compared to other available techniques, the whole procedure requires hun-dreds of CPU hours on a fast Unix workstation (Sparc 20) for each sample.
Figure 1 shows the network of normal forces in sample D. One can observe both large contact-to-contact fluctu-ations and a subnetwork of “force chains” that seem to carry a significant portion of the applied external stress. Forces range from 0.003 to 1127 N, i.e., a range of 6 or-ders of magnitude, which clearly requires a scaling analy-sis. The mean normal force is kNl 249 N and more than 60% of contacts carry a force lower than the mean.
Figure 2 displays semilogarithmic plots of probability distributions PN of normal forces in the four samples. Forces are normalized with respect to their mean in each sample. The normalized distributions coincide over al-most the whole range, and the data for forces larger than
FIG. 1. Network of normal forces in sample D; see Table I. Forces are encoded as the widths of intercenter con-necting segments.
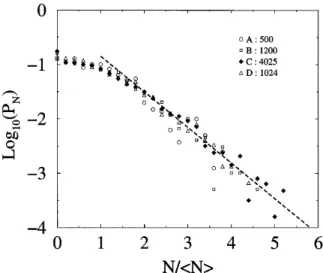
the mean are well fitted by an exponential decay. In order to see the behavior at low forces, we have shown in Fig. 3 the normalized log-log plots of the distribution of the logarithm of the forces. The data for forces lower than the mean have a power-law distribution. We conclude that the normalized distribution of normal forces is inde-pendent of our sample sizes and can be approximated by a power-law decay with a crossover to an exponential cut-off,
PN ~ Ω
sNykNlda, N , kNl,
ebs12NykNld, N . kNl. (1)
We find a 20.3 and b 1.4. It is important to notice the collapse of normalized data on the same distribution in spite of the fact that the size dispersity of particles is not the same in all samples. The mean values seem, however, to depend on size dispersity since they do not scale with system size as shown in Table I. On the other hand, the lack of statistics at low normal forces in sample D as compared to sample B, giving rise to the fluctuations observed in Fig. 3, suggests that the “branching process” generating low forces from the high applied force on the system is more efficient in systems with a continuous distribution of particle sizes.
The semilogarithmic and log-log plots of the probabil-ity distributions of the T are displayed in Figs. 4 and 5. The data are normalized with respect to the mean kT l in each sample, and, as we see, they nicely collapse on the same distribution. This is again essentially a power-law decay with a crossover to an exponential cutoff,
PT ~ Ω sTykT lda0 T , kT l , eb0s12TykTld , T . kT l . (2) We find a0 20.5 and b0 1.
We also studied the probability distribution Ph of h
T yN. This is a uniform distribution except for a small
peak at h m. The uniformity of this distribution may
FIG. 2. Semilogarithmic plots of the probability distributions of normalized normal forces N ykN l.
FIG. 3. Log-log plots of the probability distributions of normalized normal forces NykN l.
be attributed to the random structure of the contact net-work. On the other hand, it is likely that the rather weak singularity at h m is a “signature” of the dynamics of preparation. Indeed, only at sliding contacts is the fric-tion force fully mobilized. If a granular assembly relaxes asymptotically towards static equilibrium, then the set of the last sliding contacts at the equilibrium threshold might remain fully mobilized. We checked that when the sys-tem is sheared by the motion of the basal plane, the peak at h m can rise to 50% of contacts, whereas the dis-tribution remains uniform within f0, mf. Finally, we note that the normal forces for which h m are much smaller than the average, so that the peak may well result also from an imperfect relaxation.
Another important result regarding friction mobilization is the statistical independence of h with respect to
N. Whatever the value of N, friction is indifferently mobilized within the Coulomb range f0, mNg (apart from the above discussed small peak). Such an assumption allows one to relate in a simple way PN to PT. Let
PsN , T d be the joint probability distribution of normal and
friction forces. Since h is statistically independent of N, we may write PsN , T d as a product of PN and Ph times
the Jacobian of the transformation sN, T d ! sN, hd,
PsN, T d dN dT 1
N PNsNdPhshd dN dT . (3)
TABLE I. Number of particles p, number of contacts c, width
L, mean normal force kNl, and mean friction force kT l in our
samples A, B, C, and D. Sample p c L (mm) kNl sNd kT l sNd A 500 806 260 592 51 B 1200 1969 389 213 18 C 4025 6293 620 219 21 D 1024 1498 65 249 23
FIG. 4. Semilogarithmic plots of the probability distributions of normalized friction forces T ykT l.
One may check that integration of the two members of Eq. (3) with respect to N and T over f0, 1`g, with the substitution T hN in the right-hand side together with the constraint h [ f0, mg, implies a normalized Ph
over the Coulomb range f0, mg. Introducing the uniform distribution Phshd 1sf0, mgd in Eq. (3) and integrating
with respect to N over f0, 1`g with the substitution
N Tyh in the right side, we get the following relation
between PN and PT: PTsT d 1 m Z 1` 1ym PNsxT d dx x . (4)
This equation implies that the initial power law of the two distributions PN and PT should be the same: a a0. Moreover, an exponential upper cutoff of normal
forces yields an exponential-integral cutoff for friction forces, i.e., essentially an exponential decay times a slowly varying function. Going back to Figs. 2 – 5, we see that such refinements are out of reach within the
FIG. 5. Log-log plots of the probability distributions of normalized friction forces T ykT l.
statistical precision. On one hand, the cutoff may well be an exponential-integral function. On the other hand, the equality of exponents is consistent with the rough determination of these exponents.
Equation (4) can, however, be directly checked from the data. In Fig. 6 we have plotted both PT and the probability distribution obtained from PN via Eq. (4) for sample C. They are almost the same with a very good precision, although we assumed a uniform distribution of h with no additional peak on the edge h m. This validation of Eq. (4) is also an indirect check of the statistical independence of h with respect to N.
Finally, integration of Eq. (4) with respect to T yields the following relation between the mean values:
kT l m
2 kNl. (5)
This relation is approximately satisfied for our samples, as can be seen in Table I.
In view of these findings, we would like to underline some salient aspects of the problem. One important point concerns the scale of statistical homogeneity of granular systems. Despite local force fluctuations, the present study shows that for a sample as small as 1200 particles the force distributions are clearly defined over several decades. An increase in sample size does nothing but improve statistics. Hence, as far as stress is concerned, the linear scale of statistical homogeneity in a 2D assembly is a few tens of particle diameters. This is what comes out also from the study of anisotropy in angular distributions of contact forces [13,14]. This observation is crucial for a continuum approach to the mechanics of granular media, needed in most of the usual technological problems.
Another point is that only the exponential tail of the distribution of normal forces, comprising nearly 40% of contacts in our simulations, has been observed in
FIG. 6. Log-log plots of the distribution PT of normalized
friction forces and the one obtained by applying Eq. (4) to PN
in sample C.
experiments [3]. Weaker forces are technically difficult to measure, and their distribution has not been observed. The exponential tail has also been obtained through the usual simulation methods [15], and, what is more, a recent theoretical model provides plausible statistical arguments in favor of it [3]. This statistical model is likely to apply only to the subnetwork of force chains, which carries in effect most of the applied external load and in our simulations belongs to the exponential tail. The characteristic force at this scale is essentially imposed by the external load and the ratio of the system size to the largest particle size. On the other hand, the power-law decay of weak forces, if confirmed by other investigators, indicates the self-similar nature of weak contacts that do not belong to the subnetwork of large forces. Indeed, such contacts do not feel the external load, and hence their distribution can give rise to a power law through a self-similar branching process with no intrinsic scale. This observation also suggests that the exponents a and a0 depend on the interparticular friction coefficient m.
We gratefully acknowledge many fruitful conversations with D. E. Wolf. This work has been supported by the Groupement de Recherche “Physique des Milieux Hétérogènes Complexes” of the CNRS.
[1] P. Dantu, in Proceedings of the 4th International
Con-ference on Soil Mechanics and Foundations Engineering
( Butterworths Scientific Publications, London, 1957). [2] T. Travers, D. Bideau, A. Gervois, and J. C. Messager,
J. Phys. A 19, L1033 – 1038 (1986).
[3] C. H. Liu, S. R. Nagel, D. A. Schecter, S. N. Coppersmith, S. Majumdar, O. Narayan, and T. A. Witten, Science 269, 513 (1995).
[4] E. Guyon, S. Roux, A. Hansen, D. Bideau, J. P. Troadec, and H. Crapo, Rep. Prog. Phys. 53, 373 – 419 (1990). [5] H. M. Jaeger and S. R. Nagel, Science 255, 1523 (1992). [6] Disorder and Granular Media, edited by D. Bideau and
A. Hansen ( Elsevier, North-Holland, Amsterdam, 1993). [7] D. E. Wolf, in Computational Physics: Selected
Meth-ods — Simple Exercises — Serious Applications, edited by
K. H. Hoffmann and M. Schreiber (Springer, Heidelberg, 1996).
[8] J. J. Moreau, Eur. J. Mech. A, Solids 13, 93 – 114 (1994). [9] M. Jean, in Mechanics of Geometrical Interfaces, edited
by A. P. S. Selvadurai and M. J. Boulon ( Elsevier Science B. V., Amsterdam, 1995), pp. 463 – 486.
[10] F. Radjai and S. Roux, Phys. Rev. E 51, 6177 (1995). [11] F. Radjai, L. Brendel, and S. Roux, Phys. Rev. E (to be
published).
[12] A. N. Schofield and C. P. Wroth, Critical State Soil
Mechanics ( McGraw-Hill, London, 1968).
[13] L. Rothenburg and R. J. Bathurst, Géotechnique 39, 601 – 614 (1989).
[14] B. Cambou, in Powders and Grains 93, edited by C. Thornton ( Balkema, Rotterdam, 1993).