Publisher’s version / Version de l'éditeur:
Journal of Analytical Atomic Spectrometry, 15, 6, pp. 607-616, 2000
READ THESE TERMS AND CONDITIONS CAREFULLY BEFORE USING THIS WEBSITE. https://nrc-publications.canada.ca/eng/copyright
Vous avez des questions? Nous pouvons vous aider. Pour communiquer directement avec un auteur, consultez la
première page de la revue dans laquelle son article a été publié afin de trouver ses coordonnées. Si vous n’arrivez pas à les repérer, communiquez avec nous à PublicationsArchive-ArchivesPublications@nrc-cnrc.gc.ca.
Questions? Contact the NRC Publications Archive team at
PublicationsArchive-ArchivesPublications@nrc-cnrc.gc.ca. If you wish to email the authors directly, please see the first page of the publication for their contact information.
Archives des publications du CNRC
This publication could be one of several versions: author’s original, accepted manuscript or the publisher’s version. / La version de cette publication peut être l’une des suivantes : la version prépublication de l’auteur, la version acceptée du manuscrit ou la version de l’éditeur.
For the publisher’s version, please access the DOI link below./ Pour consulter la version de l’éditeur, utilisez le lien DOI ci-dessous.
https://doi.org/10.1039/b000496k
Access and use of this website and the material on it are subject to the Terms and Conditions set forth at
Analytical characteristics of a commercial ICP orthogonal acceleration
time-of-flight mass spectrometer (ICP-TOFMS)
Sturgeon, R.; Lam, J.; Saint, A.
https://publications-cnrc.canada.ca/fra/droits
L’accès à ce site Web et l’utilisation de son contenu sont assujettis aux conditions présentées dans le site LISEZ CES CONDITIONS ATTENTIVEMENT AVANT D’UTILISER CE SITE WEB.
NRC Publications Record / Notice d'Archives des publications de CNRC:
https://nrc-publications.canada.ca/eng/view/object/?id=56b44f11-58aa-434f-be49-1fc96f9e173b
https://publications-cnrc.canada.ca/fra/voir/objet/?id=56b44f11-58aa-434f-be49-1fc96f9e173b
Full
Paper
Analytical characteristics of a commercial ICP orthogonal
acceleration time-of-¯ight mass spectrometer (ICP-TOFMS){
Ralph E. Sturgeon,*aJoseph W. H. Lamaand Andrew Saintb a
Institute for National Measurement Standards, National Research Council of Canada, Ottawa, Canada K1A 0R9
b
GBC Scienti®c Equipment Pty Ltd, 12 Monterey Road, Dandenong, Victoria 3175, Australia
Received 18th January 2000, Accepted 21st March 2000 Published on the Web 28th April 2000
Analytical data illustrating the typical response characteristics of a commercial inductively coupled plasma orthogonal acceleration time-of-¯ight mass spectrometer (Optimass8000 ICP-oa-TOFMS, GBC Scienti®c Equipment Pty Ltd., Australia) are presented. With optimum instrument response tuned at mid-mass (103Rh), limits of detection for a suite of elements representative of m/z 9±238 were estimated to be typically 1 ppt; background counts across the mass range averaged 0.5 Hz; sensitivity was 7 MHz per mg ml21(Rh); resolution (FWHM) ranged from 500 (7Li) to 2200 (238U); long-term drift over 700 min was 0.7% h21; abundance sensitivity was 2.861026(low mass side) and 7.461025(high mass side); mass bias ranged from 10% per u at 24
Mg to v1% per u at m/zw80 and isotope ratio precision was demonstrated to be limited by counting statistics when the detector was operated in the pulse counting mode. Matrix effects, while relatively
insigni®cant at 30 ppm NaCl and reaching 60±80% suppression of response at 3500 ppm, had no in¯uence on the measured resolution, mass calibration or isotope ratio accuracy. The instrument faithfully recorded transient signals arising from ¯ow injection sample introduction, from which isotope ratio information free of time skew could be generated.
Introduction
The recent introduction of ICP time-of-¯ight mass spectro-meters (ICP-TOFMS) to the marketplace opens a number of practical advantages for the user, including: enhanced sample throughput and elemental coverage wherein a complete mass spectrum is generated from each ion-gating event; elimination of time (spectral) skew to permit reliable registration of multi-isotope signals from transient sample introduction devices such as laser ablation, ¯ow injection and electrothermal vaporiza-tion; enhanced resoluvaporiza-tion; unlimited use of internal standards without performance compromises; and improved isotope ratio precision capability owing to the high correlation of the noise sources for all isotopes which occur with simultaneous sampling (extraction).
Unfortunately, the small number of laboratories currently operating ICP-TOFMS systems has not yet served to adequately characterize these performance parameters to an extent that permits potential users to comprehensively evaluate them for speci®c applications. Myers and Hieftje1®rst reported on the design and preliminary analytical characteristics of an ICP ion source coupled to a TOF mass analyzer. They concluded that orthogonally gated and accelerated (oa) sampling of the continuous supersonic expansion beam from the ICP provided for greater sensitivity, better duty cycle and higher resolution than was achievable with an axially accelerated (aa) con®guration. The authors utilized post acceleration de¯ection ®elds (steering plates) in an attempt to maintain a perpendicular drift trajectory to the sampled length of the ion beam.1,2 This has been shown to degrade the resolution of the oa-TOF relative to the use of a simple spontaneous drift trajectory wherein the axial velocity of the ion beam is conserved.3±5Additionally, signi®cant mass bias effects, amounting to several percent per mass unit, have been reported with oa designs utilizing steering plates.5It has been
shown that this shortcoming can be largely obviated by simply increasing the length of the sampled ion beam6,7such that the higher energy (higher mass) ions are transmitted to the detector from the trailing part of the ion packet while the lower energy ions are sampled from the leading part (closest to the detector in the beam direction). In this way a more uniform response over the mass range is obtained without the need for a large detector.
Recently, the analytical characteristics of a commercially available ICP-aa-TOFMS instrument (LECO Renaissance) were presented,8,9wherein the enhanced isotope ratio precision which accrues with TOF detection was highlighted. Unfortu-nately, apart from relative signal intensities (analog detection mode used) and precision data, Vanhaecke et al.8present little additional information with which to characterize the perfor-mance of the instrument from the perspective of the general user. Moreover, relatively high analyte solution concentrations were utilized (50±500 ng ml21) throughout the investigation. Tian et al.9provide a more exhaustive, quantitative evaluation of this instrument, presenting ®gures of merit in terms of accuracy, precision, resolution, detection limits, stability and isotope ratio precision. Emteborg et al.10 further pursued evaluation of precision and mass bias for isotope ratio measurement in more detail using this TOFMS system, examining effects of detector voltage, integration window and time on accuracy and % RSD. Analog detection in combination with solution concentrations of 50±220 ng ml21 were studied in an effort to reduce fundamental noise and to avoid both dead time corrections as well as contamination issues. For some elements at high signal intensities, RSDs of v0.05% could be obtained.
One of the more frequently used arguments in favour of TOF detection is the potential for elimination of the effects of drift and multiplicative (¯icker) noise components in the source. Since all ions are sampled simultaneously from the ICP in each cycle of mass analysis, such effects can be compensated by ratioing techniques. Additionally, since the same detector is used (as opposed to multi-collector ratioing instruments), its
{#Canadian crown copyright.
DOI: 10.1039/b000496k J. Anal. At. Spectrom., 2000, 15, 607±616 607 This journal is # The Royal Society of Chemistry 2000
Published on 28 April 2000. Downloaded by National Research Council Canada on 13/11/2015 19:30:40.
noise characteristics should be identical for signal ratioing. In reality, TOF detection provides near-simultaneous measure-ments, provided the mass dependence of the time required for the ions to pass through the ion optics between the skimmer and the ¯ight tube is minimized.
It is the purpose of this study to present data characterizing the analytical performance of a commercially available ICP-orthogonal acceleration-TOFMS instrument (ICP-oa-TOFMS).
Experimental
Instrumentation
The Optimass8000 ICP-oa-TOFMS instrument (GBC Scien-ti®c Equipment Pty. Ltd., Australia), used throughout, has a 260.5 m ¯ight tube ®tted with a re¯ectron ion mirror, as outlined in the schematic presented in Fig. 1. The distance from the tip of the sampler ori®ce to the center of the oa extraction region is 33.5 cm. The instrument is equipped with an ion blanker located at the ®rst space focus point downstream of the oa where ions of the same m/z are tightly bunched in space and time. A software selected voltage pulse applied to a series of strip electrodes produces a transient ®eld designed to de¯ect a selected narrow range of m/z from the ¯ight path. Multiple m/z regions are user selectable.
Samples were introduced using a concentric nebulizer (Glass Expansion Pty. Ltd., Camberwell, Victoria, Australia) coupled to a 70 ml thermostated (15 ³C) cyclonic spray chamber (Glass Expansion). Liquid uptake rate was controlled by selection of the instrument peristaltic (12 roller) pump speed and arbitrarily set for approximately 0.5 ml min21. Ion detection is achieved by utilizing the discrete dynode electron multiplier (ETP, Ermington, NSW, Australia) in simultaneous pulse counting and analog signal collection modes. Instrument settings are summarized in Table 1. Data were stored in Microsoft Access
®les and subsequently exported to Microsoft Excel spread-sheets for manipulation.
For the purpose of generation of ``transient'' signals, a simple ¯ow injection manifold was constructed around a Model 5020 manually actuated 6-port low pressure sample injection valve (Rheodyne, Cotati, CA) ®tted with a 35 ml
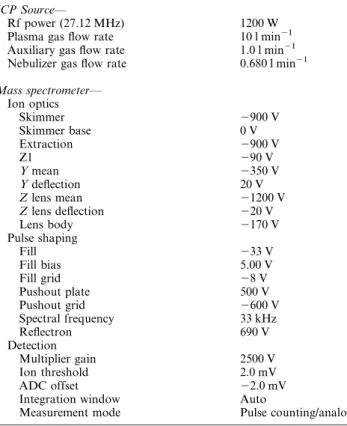
Fig. 1 Schematic outline of the GBC Optimass8000 ICP-oa-TOFMS instrument. Table 1 ICP-TOFMS operating conditions
ICP SourceÐ
Rf power (27.12 MHz) 1200 W Plasma gas ¯ow rate 10 l min21
Auxiliary gas ¯ow rate 1.0 l min21
Nebulizer gas ¯ow rate 0.680 l min21
Mass spectrometerÐ Ion optics Skimmer 2900 V Skimmer base 0 V Extraction 2900 V Z1 290 V Y mean 2350 V Y de¯ection 20 V Z lens mean 21200 V Z lens de¯ection 220 V Lens body 2170 V Pulse shaping Fill 233 V Fill bias 5.00 V Fill grid 28 V Pushout plate 500 V Pushout grid 2600 V Spectral frequency 33 kHz Re¯ectron 690 V Detection Multiplier gain 2500 V Ion threshold 2.0 mV ADC offset 22.0 mV
Integration window Auto
Measurement mode Pulse counting/analog
608 J. Anal. At. Spectrom., 2000, 15, 607±616
sample loop. Te¯on tubing and ¯angeless ®ttings (UpChurch Scienti®c, Oak Harbor, WA) were used to connect the system to the nebulizer. A stand-alone Gilson Minipuls 3 peristaltic pump (Villiers Le Bel, France) propelled samples at a ¯ow rate of approximately 0.3 ml min21. This accentuated the roller-induced pulsations from the pump and resulted in the FWHM of the analyte signals being of the order of 6 s with full baseline width of approximately 15 s. Data were collected for 20 s at intervals of 250 ms.
Reagents and standards
Distilled deionized water (DDW) was obtained from a NanoPure (Barnsted, UK) puri®cation system. High purity HNO3 and HCl were prepared in-house by sub-boiling distillation of the reagent grade feedstocks using a quartz still housed in a Class 10 fume cupboard. Stock solutions of the various elements were prepared by dissolution of the pure elements or their high-purity salts (Alfa Aesar, Ward Hill, MA) in acid followed by dilution with DDW and storage in pre-cleaned screw capped polypropylene bottles.
All test solutions were prepared in a Class 10 laboratory clean room. The instrument was located in a routine laboratory. A multi-element stock solution, containing Be, Co, Rh, La, Ce, Ho, Bi and U at concentrations of 10 mg ml21, was used to prepare a 1 ng ml21 solution of the analytes containing 0.25% (v/v) HNO3 which was used for the estimation of detection limits.
Isotope ratio measurements were undertaken using a series of multielement solutions at concentrations of 0.1, 1.0, 2.0, 10, 100 and 500 ng ml21containing Mg, Cu, Ag, Ce, Y, Pt, Tl and U. Ten replicate measurements were taken of each sample solution using integration times of 0.2, 1.0, 2.0, 5.0, 10.0, 20.0 and 50 s in order to assess the precision of isotope ratio measurement and the in¯uence of counting statistics on the results. Mass bias was calculated as the difference between the measured and expected ratio.
The effect of matrix interference on response from analytes in a multielement solution containing 5 ng ml21U, Pb, Te, Cd, Ga, Ge, Yb and 10 ng ml21Be was examined. A series of these analyte solutions containing varying amounts of a seawater matrix was prepared by diluting NASS-5 Open Ocean Seawater reference material (NRCC, Ottawa) 10-, 100-, 1000-, 10000-and 100000-fold with 0.25% (v/v) HNO3.
High and low mass abundance sensitivity was estimated from measurements of signal intensities from a solution containing 50 pg ml21Sr, 500 pg ml21Zr and 1 mg ml21Y. A 1 s acquisition (integration) time was suitable for this purpose. Multielement solutions containing Ag, Ce, Cu, Ir, Mg, Pt, Tl and Yb at concentrations of 1, 10, 100 and 1000 ng ml21were prepared for introduction with the sampling loop to generate transient signal data.
Procedures
Instrument tuning was optimized at mid-mass range and based on peak count response from Rh. Conditions, summarized in Table 1, achieved a sensitivity of 7 MHz per mg ml21 (mass integrated peak) and a resolution (FWHM) of 1460. Mass calibration was achieved using responses from 23.99Mg, 102.91
Rh and207.98Pb.
Detection limits were calculated from the measured sensitiv-ities (using a 1 ng ml21 solution) and estimated standard deviations of the blank consisting of 0.25% (v/v) HNO3. For this purpose, a signal acquisition time of 10 s was set and 10 replicate measurements were acquired. Instrument background (Hz) across the mass range was estimated from 10 replicate 10 s data acquisitions obtained during nebulization of the blank solution; measurements at m/z values of known potential contaminants (Na, Mg, etc.) were avoided.
Long-term stability of the instrument was examined by running a multielement solution containing 2 ng ml21 of the analytes used for isotope ratio measurements. Data were collected overnight at a frequency of one sample per min for 700 min using a signal acquisition time of 10 s.
Isotope ratio precision was evaluated from a series of measurements on a multielement solution for which the integration (acquisition) time was varied between 0.2 and 50 s and whose concentrations ranged from 0.1 to 500 ng ml21. In all cases, 10 replicate 10 s measurements were taken, from which the experimental % RSD of the ratio of two or more isotopes of each element was compared with the theoretical count limited statistic.
Matrix effects arising from the presence of increased concentrations of NaCl (along with some Ca and Mg arising from the seawater) were evaluated by normalising the response from each sample to that obtained from a matrix-free solution of the analytes. Eight replicate 5 s integrations were made of each solution.
``Transient'' signals were generated by manual introduction of discrete 35 ml volumes of sample using a ¯ow injection system interfaced to the instrument. Isotope ratio information was evaluated with this mode of sample introduction, as was calibration stability and linearity of response.
Results and discussion
This study was undertaken in an effort to characterize this technique from a typical user's perspective; to provide unbiased performance information with ICP-oa-TOFMS that may serve to guide interested users in assessing its potential for speci®c applications and to highlight the current shortcomings of this approach to detection for ICP-MS. It is to be noted that all experiments were recorded under instrument conditions which were ®rst optimized with respect to both peak height sensitivity and peak shape (resolution) for response from 103Rh. Ion blanking (application of a transverse voltage de¯ection pulse to prevent unwanted ions from reaching the detector) was activated to cover the m/z range 10±22, as well as 28±42 and 75±85, thereby minimizing response from14Nz
,16Oz ,17OHz
, 18H
2Oz,28N2z,30NOz,32O2z,40Arz,41ArHzand80Ar2z whenever possible during measurements.
An important advantage of oa-TOFMS is the minimization of the spread of initial ion velocities in the beam drift direction (average velocity is zero) which serves to increase the achievable resolving power. Resolution, de®ned as the full width at half maximum intensity (FWHM), ranges from approximately 500 for 6Li to at least 2200 for 238U under compromise tuning conditions (although a resolution of 2400 can be selectively achieved for 103Rh). Resolving power decreases towards low mass due to the constant contribution of the detector pulse width and jitter of the timing electronics.11 In all cases, tuning was achieved by altering the voltages applied to all tuning elements with the exception of the re¯ectron, which was maintained at 690 V throughout. Unfortunately, the practical advantages of such resolution are minimal for the user. Potential cases, where advantage may be taken of this aspect of instrument performance relative to a standard quadrupole machine, relate to the elimination of isobaric interference from NOH on the measurement of31P, wherein a practical resolution of 967 is required and attainable, and that of28Si to be discerned from14N2wherein a resolution of 958 is required.
Limit of detection and background
Fig. 2 illustrates typical LODs and background count obtained for a number of elements representative of the mass range of interest. In all cases, the integration window (time window or mass width window), although operator selectable, was used J. Anal. At. Spectrom., 2000, 15, 607±616 609
Published on 28 April 2000. Downloaded by National Research Council Canada on 13/11/2015 19:30:40.
with default parameters speci®ed by the manufacturer which varied from 0.108 amu at Be to 1.000 amu at U. Detection limits were based on a 3sb criterion wherein the standard deviation of 10 replicate 10 s integrations of 0.25% (v/v) HNO3 in DDW were acquired followed by a measure of the sensitivity of each isotope of interest using a 1.0 ng ml21 multielement standard solution in 0.25% (v/v) HNO3. In general, LODs are comparable to those reported for many quadrupole-based instruments operating with much higher sensitivity12and are approximately an order of magnitude lower than those recently reported by Tian et al.9using an ICP-aa-TOFMS instrument. Relatively low background counts are achieved across the mass range. The absence of a direct line-of-sight geometry between the sampled beam and the detector, coupled with ef®cient removal of neutrals from the drift region, minimize scatter and secondary ion generation, thereby reducing this parameter. It should be noted that, as the instrument was optimized for 103
Rh, LODs could likely be improved for Be and Co if tuning was undertaken in the low mass range. It is possible to achieve a 6-fold increase in sensitivity for 24Mg by retuning the instrument at this m/z. Under compromise conditions, the sensitivity rises rapidly from 0.4 MHz per mg ml21at m/z 9 to 3.5 MHz at m/z 60, reaching 7 MHz per mg ml21at m/z 103, whereupon it remains approximately constant to m/z 209. Long- and short-term stability
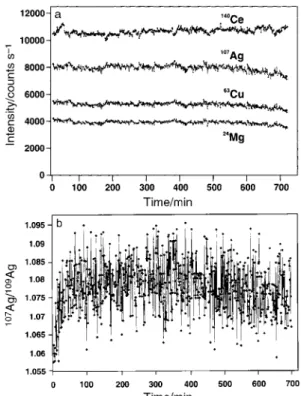
Short-term stability (20 measurements taken over a 20 min interval) was characterized by an approximately 1% RSD. A series of measurements on a multielement solution containing 2 ng ml21Mg, Cu, Ag, Ce, Y, Pt, Tl and U was run unattended overnight and the resulting long-term drift in the data evaluated. Fig. 3a illustrates results obtained for cerium, silver, copper and magnesium. Data collection started 1 h after the plasma was ignited, the instrument tuned and the method set up. Over the course of 700 min, during which time a single 10 s integration was made at 1 min intervals, signal intensity drifted an average of 0.7% per h downward for Ag, Cu and Mg and upward by 0.2% per h for Ce. Silver presents the worst case scenario, with the majority of the drift occuring rather quickly during the ®nal 3.5 h. Fig. 3b illustrates the long-term stability of the 107Ag/109Ag ratio. Following an initial 20 min period of data collection, ratio stability becomes quite good; as expected, ratioing eliminates the effect of drift on the response and a second isotope of an element serves as an ideal internal standard. Without applying any mass bias correction factor to the data, the average isotope ratio from all 700 data points for Ag is 1.078¡0.007 (true value: 1.0764). The average of the last 10 data points (®nal 10 min of signal acquisition) is 1.076¡0.007, demonstrating that instabilities in residual factors which may lead to changes in the ratio with time, such as mass bias and mass calibration drift, are negligible over a period of nearly 12 h of continuous operation. It is interesting to note, however, that instability over a much shorter time scale, of the order of a few minutes, occurs as a result of intermittent noise unequally in¯uencing the isotopes of interest. This gives rise to the spiked appearance of the ratio data
evident in Fig. 3b, similar to that reported by Begley and Sharp13 who identi®ed the source of such ¯uctuations as instabilities in the mass calibration and mass bias of their instrument. Mass calibration was observed to be extremely stable; drift in the position of the mass peak of any given isotope was never more than 0.02 amu over a continuous 7 d period of operation. However, short-term ¯uctuations in the ion optic voltages may give rise to altered isotope transmission ef®ciencies creating ¯uctuations in mass bias; this aspect of instrument performance requires further study. Data presented in Fig. 3b for silver are typical of that for all other elements investigated.
Abundance sensitivity
Abundance sensitivity for quadrupole instruments is typically v161026 on the low mass side and v161027 on the high mass side.12Using89Y as the ``perturbing'' isotope, abundance sensitivity was evaluated at88Sr and90Zr. An intense peak from 89
Y (2.2 MHz) was generated by the introduction of a solution containing 1 mg ml21 Y. Fig. 4 illustrates the signal arising from concurrent introduction of a 50 pg ml21solution of Sr, permitting calculation of the contribution of the leading edge of the 89Y peak under the 88Sr peak (equivalent to the introduction of a solution containing 4 pg ml21 Sr) and a measure of the abundance sensitivity to be 2.861026 at a resolution of 1450. A similar, direct measurement on the high mass side using a 1 mg ml21 solution of Y containing 500 pg ml21 Zr was not possible due to ringing in the pulse counting detector circuit. This problem was minimized by application of the ion blanking system to attenuate the response from Y. Under these conditions, a clear tailing in the signal is evident on the high mass side of89Y, yielding an elevated background under the 90Zr peak, estimated to be equivalent to 140 pg ml21 90Zr and yielding an abundance sensitivity of 7.461025. It may be argued that the use of the ion blanker to attenuate the unwanted (m21) signal intensity does not permit calculation of a standard abundance sensitivity that may be used for comparison with a quadrupole machine.
Fig. 2 Limit of detection and background for compromise tuning at
103Rh: & LOD,
e background.
Fig. 3 Long-term signal stability for (a)140Ce,107Ag,63Cu and24Mg
using pulse counting with a 2 ng ml21 solution and 10 s integration
every minute; and (b) long-term stability of107Ag/109Ag ratio under
above conditions.
610 J. Anal. At. Spectrom., 2000, 15, 607±616
Clearly, the ion blanking system can be used to such advantage. An alternative means of interpreting the data under such conditions may lie with the calculation of an equivalent concentration at the (mz1) mass which, for90Zr is, as stated above, 140 pg ml21. This results in a calculated high-mass abundance sensitivity of 1.461024for this particular situation. A quick survey of relative peak intensities generated for the four isotopes of Zr in one spectral scan, displayed in Fig. 4b, reveals that they follow the expected abundance pattern, i.e., 5 : 1 : 1.5 : 1.5 for Zr 90 : 91 : 92 : 94, with little perturbation arising from the use of the ion blanker at m/z~89.
Despite the fact that abundance sensitivity is inferior to that obtained with a quadrupole based system,12the full spectrum capability of the TOFMS is advantageous in that it quickly permits ``on-line'' calculation of any correction required as a consequence of ®nite abundance sensitivity for any element pairs.
Isotope ratio precision
If the majority of non-random ¯icker noise is removed by isotope ratioing and signal averaging, the counting statistic would likely be precision limiting, as dictated by Poisson statistics. Any remaining ¯uctuation in the ratio then likely
comes from mass bias and mass calibration instabilities.13With TOFMS, each spectrum acquired represents signals from ions extracted from the plasma during the same time interval, formed from identical plasma and sample introduction events.
Fig. 4 (a) Low mass abundance sensitivity as exempli®ed by detection of 50 pg ml21 88Sr (FWHM resolution~1457) in the presence of
1 mg ml21 89Y: (i) pulse counting, abundance sensitivity~2.861026;
(ii) analog detection. (b) High mass abundance sensitivity as exempli®ed by detection of 500 pg ml21 90Zr in the presence of
1 mg ml21 89Y: pulse counting, abundance sensitivity~7.461025(note:
blanker system used to attenuate response from89Y for high mass experiment).
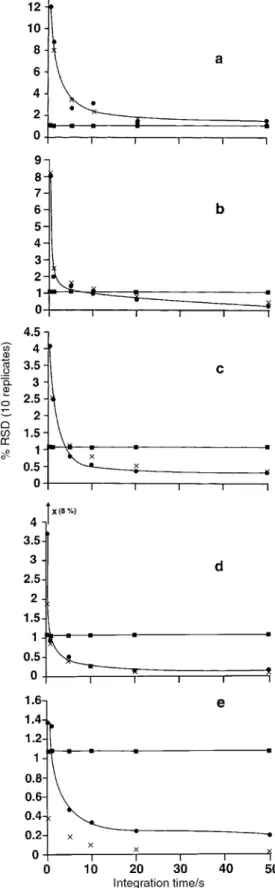
Fig. 5 Effect of signal acquisition time on isotope ratio precision for
107
Ag/109Ag: (a) 0.1 ng ml21; (b) 1.0 ng ml21; (c) 2 ng ml21; (d)
10 ng ml21; (e) 500 ng ml21. Data re¯ects average of 10 replicates.
$, Experimental precision; 6, calculated statistical limit of expected ratio precision based on total counts for each isotope; &, calculated ratio (not corrected for mass bias or background).
J. Anal. At. Spectrom., 2000, 15, 607±616 611
Published on 28 April 2000. Downloaded by National Research Council Canada on 13/11/2015 19:30:40.
As a consequence, TOFMS should be able to achieve excellent precision for any number of elemental isotope pairs in a single acquisition, subject to statistical limits wherein the acquisition time must allow suf®cient ions to be detected (e.g., ten 10 s integrations on a 1 ng ml21solution of an element having an isotope ratio of 1, to result in a 0.1% RSD14,15).
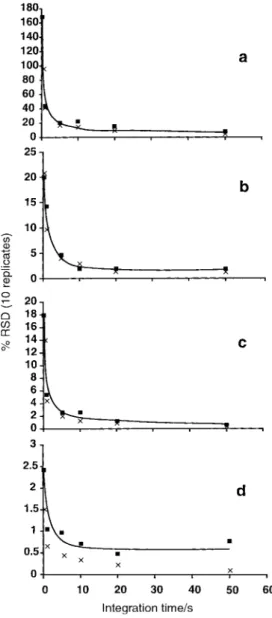
Figs. 5 and 6 illustrate ratio data obtained for Ag and U, these elements presenting two extreme examples for isotope ratio determination. Whereas the natural abundance of the silver isotopes is near unity and ideal for the purposes of demonstrating counting statistic limitations at any analyte concentration, the 235/238 ratio for U is 1022, which may require a combination of pulse counting and analog detection if the analyte solution concentration is higher than 5 ng ml21.
At concentrations of 0.1, 1.0, 2 and 10 ng ml21, pulse counting detection of both the 107 and 109 isotopes of Ag occurs. Beyond 10 ng ml21, the analog detection circuit is operative for both isotopes (cross-over is currently set at 25 kHz; a 7.5 ns detector dead time was accounted for in the software). It is evident from Fig. 5 that the % RSD of the isotope ratio can, in general, be modelled quite well with a shot noise limited statistic and, for any given concentration, the isotope ratio precision generally improves as the [acquisition
time]1/2 or as the [analyte concentration]1/2 for a given acquisition time. At a concentration of 500 ng ml21, there appears to be instabilities in the analog circuit, as the statistical limit of the precision is not achieved under any conditions due to the presence of some uncharacterized noise source. Accuracy of the107Ag/109Ag ratio is maintained in all cases with isotope ratios (not corrected for mass bias nor background) calculated from the average of the 6 integration periods (0.2, 1,5, 10, 20 and 50 s) for concentrations of 0.1, 1.0, 2.0, 10.0 and 500 ng ml21 being 1.06¡0.02, 1.076¡0.003, 1.075¡0.004, 1.071¡0.006 and 1.076¡0.003, respectively (accepted value 1.076416).
For uranium, both isotopes can be measured using the pulse counting mode for concentrations of 0.1 and 2.0 ng ml21. In such case, the %RSD for the measured ratio is tracked quite well by the Poisson statistic. At a concentration of 10 ng ml21, 235
U is measured using the pulse counting mode and238U is measured using the analog circuit. The consequence is that not only is there degradation in the precision with which the ratio is measured, but the ratio is inaccurate, probably a consequence of inappropriate calibration of the cross-over from the pulse counter to analog detector modes. Finally, at 500 ng ml21, both isotopes exhibit suf®cient intensities to permit measure-ments in the analog mode only. It is evident from the data in Fig. 6 that isotope ratio precision in this mode is better than that achieved in the mixed detector mode, but that inaccuracy is again present, i.e., 0.0051¡0.0001 vs 0.0073¡0.0001 at 2 ng ml21. This may arise as a result of an incorrect ADC offset voltage for this detector (Table 1) which would compromise the intensities of the235U isotope signi®cantly more than that of the238U isotope.
Table 2 summarizes the isotope ratio precisions obtained using different acquisition times for 1.0 and 10 ng ml21 multi-element solutions, respectively. In general, it is evident that precision improves with increase in either integration (acquisi-tion) time or analyte concentration, typically following a square root dependence on either parameter. Isotope ratio precisions of the order of 1% RSD can be achieved with a 1 ng ml21solution concentration using modest 10 s acquisition times, irrespective of the number of ratio pairs considered. Precisions can be improved to 0.2% RSD using a 10 ng ml21 analyte solution and 50 s acquisition time. This level of precision is comparable to that currently available with most quadrupole-based instruments using similar integration times12,15and is similar to that recently reported by Tian et al.9for their aa-TOF-MS instrument, although the latter was achieved using analog detection with solution concentrations an order of magnitude higher than employed in this study. It is noteworthy that the precision of some isotope pairs (Ag, Ce and Tl) actually degraded when acquisition times of 50 s were used. The reason for this is not clear at this time; detector saturation is not an issue and pulse counting was utilized for the 1.0 ng ml21 solution. This is consistent with observations made in connection with the data reported in Fig. 3b. Similar reversals in precision have also been noted with data obtained using an ICP-aa-TOFMS instrument.8
Mass bias
Mass bias is the deviation of the measured isotope ratio from the actual value, which arises because the sensitivity of the instrument varies with mass due to differences in ion transmission ef®ciency. Utilizing data obtained in the above experiment permitted a mass bias response curve to be generated, which is shown in Fig. 7. In the case of uranium, a natural abundance was assumed to be present in the laboratory prepared sample solution. The mass bias per mass unit is typical of that reported for quadrupole- and sector-based instruments15and at mid-mass (Ag) amounts to 0.12%. By retuning the system (normally optimized for103Rh) at the
Fig. 6 Effect of signal acquisition time on isotope ratio precision for
235
U/238U: (a) 0.1 ng ml21; (b) 2.0 ng ml21; (c) 10 ng ml21; (d)
500 ng ml21. Data re¯ects average of 10 replicates. &, experimental
precision; 6, calculated statistical limit of expected ratio precision based on total counts for each isotope.
612 J. Anal. At. Spectrom., 2000, 15, 607±616
low mass end, based on response from Mg, the mass bias at m/z 24 could be reduced from 11% to as little as 1%. It has been suggested8that mass bias in a ICP-oa-TOFMS system is likely much higher than that in an aa-TOF system because of the residual perpendicular (to the drift direction) velocity compo-nent of the sampled ion beam. Even in the absence of steering plates to alter beam trajectory, no deleterious effects are evident in the mass bias performance of this instrument, which is comparable to that reported by Tian et al.9for their aa-TOF instrument.
The effects of matrix concomitants on mass bias are discussed below.
Matrix effects
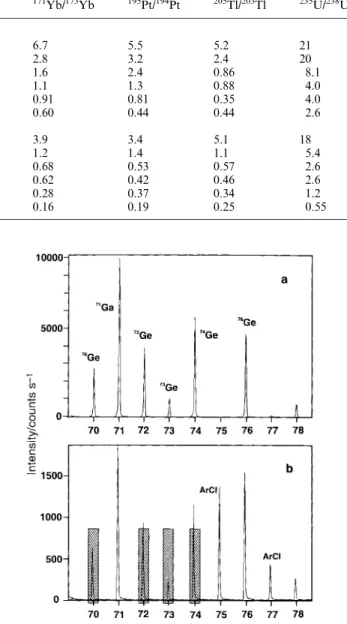
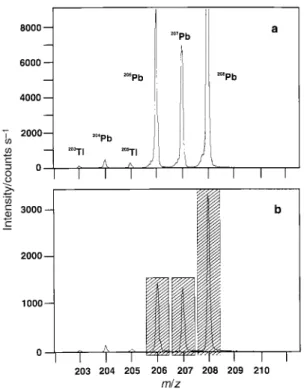
The in¯uence of increasing concentrations of NaCl on response from a number of elements selected to span the entire mass range is summarized in Fig. 8 (not shown are responses from Cd and Ge in an effort to simplify the display). The effects noted are due to non-spectral interferences, except for a perturbation of the125Te isotope intensity due to polyatomic isobaric88Sr37Clz
ion present in the diluted seawater matrix. No attempt was made to minimize the matrix effect by retuning the instrument or changing the nebulizer gas ¯ow rate. In general, the severity of the effect follows in the order TewBewGawPbwYbwU, with signals from U being least perturbed. No general trend can be discerned; the above order is neither that predicted from a classical space charge model of interference nor that attributed to ionization of the sodium producing an easily ionized element interference. The effects noted may be a convolution of these and other unappreciated factors. Figs. 9 and 10 show mass spectral scans centered on Ge and Pb, respectively, for signals generated from solutions containing disparate amounts of matrix. It is clear that increasing the concentration of NaCl by 10,000-fold has no
Table 2 Isotope ratio precision for varying acquisition times (%RSD,n~10)
Time/s 25Mg/24Mg 65Cu/63Cu 107Ag/109Ag 140Ce/142Ce 171Yb/173Yb 195Pt/194Pt 205Tl/203Tl 235U/238U
1.0 ng ml21 0.2 1.8 13 8.1 6.4 6.7 5.5 5.2 21 1.0 1.1 5.4 2.0 3.3 2.8 3.2 2.4 20 5.0 0.47 1.5 1.5 2.6 1.6 2.4 0.86 8.1 10 0.37 1.5 0.95 1.1 1.1 1.3 0.88 4.0 20 0.28 1.0 0.61 0.47 0.91 0.81 0.35 4.0 50 0.11 0.72 0.23 0.54 0.60 0.44 0.44 2.6 10 ng ml21 0.2 1.2 5.2 3.7 3.7 3.9 3.4 5.1 18 1.0 0.32 1.2 0.96 1.5 1.2 1.4 1.1 5.4 5.0 0.13 0.79 0.52 1.2 0.68 0.53 0.57 2.6 10 0.11 0.31 0.26 1.0 0.62 0.42 0.46 2.6 20 0.06 0.39 0.15 0.78 0.28 0.37 0.34 1.2 50 0.04 0.26 0.17 0.28 0.16 0.19 0.25 0.55
Fig. 7 Mass bias characteristics of an oa-TOF instrument: $, calculated mass bias for compromise tuning at103Rh; 6, mass bias with instrument tuned at m/z 24.
Fig. 8 In¯uence of NaCl matrix on the normalized response from U, Pb, Te, Ga, Y (5 ng ml21) and Be (10 ng ml21). Eight 5 s integrations
were averaged for each element: &235U;
e69Ga; #9Be; %208Pb;
r
174
Yb; $125Te.
Fig. 9 Mass spectral scans centered on Ge for solutions containing 5 ng ml21Ge and (a) 0.35 mg ml21NaCl and (b) 3500 mg ml21NaCl.
Note suppression of response due to NaCl and appearance of ArCl. Resolution (FWHM) at m/z 76~1497.
J. Anal. At. Spectrom., 2000, 15, 607±616 613
Published on 28 April 2000. Downloaded by National Research Council Canada on 13/11/2015 19:30:40.
signi®cant in¯uence on either the mass calibration of the instrument (within the time frame of the experiments) or the resolution such as to alter the integration window.
One means to minimize matrix interferences is the use of internal standards to compensate for changes in response. If the matrix suppression effect on ion transmission ef®ciency is not uniform, however, compensation by such means will be ineffective. Clearly, the ideal internal standard is another isotope of the same element. The effect of increasing the matrix on the isotope ratio is illustrated in Fig. 11 for several elements. With the exception of the 125Te/128Te pair (due to isobaric interference from increasing amounts of88Sr37Cl), the in¯uence of the NaCl is completely obviated by ratioing. The average ratios (n~6, uncorrected for background or mass bias) are: 1.479¡0.27% for 69Ge/71Ge; 0.466¡1.3% for 206Pb/208Pb; 0.442¡0.50% for 171Yb/174Yb; 0.207¡1.2% for 125Te/128Te; and 0.00713¡1.3% for235U/238U.
Transient signals
The isotope ratio precision which accrues even for short acquisition times suggests good performance by the instrument for the measurement of transient signal information. Fig. 12 illustrates data obtained for several representative isotopes generated during the introduction of a 35 ml volume of a 10 ng ml21 concentration of a multielement standard. Inte-grated full mass spectra were obtained every 250 ms over a total measurement period of 20 s (80 points). The average duration of the event, expressed as the FWHM of the ``transient'', is approximately 6 s. The sample introduction rate was suf®-ciently low that the pulsations of the peristaltic pump rollers can be clearly discerned. With an uptake rate of the DDW
Table 3 Isotope ratio and precision for transient sample introduction; 35 ml volume sample loop Concentration/ng ml21 1 10 100 1000 25 Mg countsa 18 98 942 9553 25Mg/26Mgb 20.7¡4.2 0.89¡0.28 0.87¡0.05 0.87¡0.02 % RSDexp 575 31 5.3 2.8 % RSDtheorc 36 14 4.4 1.4 65 Cu counts 33 342 3350 24094 63Cu/65Cu 2.5¡0.9 2.2¡0.2 2.11¡0.08 1.45¡0.41 % RSDexp 35 7.7 3.6 28 % RSDtheor 21 6.5 2.1 Ð 107Ag counts 88 1081 7829 31084 107 Ag/109Ag 1.12¡0.27 1.09¡0.08 1.10¡0.03 1.10¡0.04 % RSDexp 24 7.3 2.7 3.2 % RSDtheor 15 4.4 1.6 0.8
aTotal counts between 1.5 and 10 s of transient.bAverage ratio calculated from (n~34) 250 ms signal integrations across the transient (not
cor-rected for background or mass bias).cStatistical limit of precision based on total signal counts, all data obtained with pulse counting detection.
Fig. 10 Mass spectral scans centered on Pb for solutions containing 5 ng ml21Pb and (a) 0.35 mg ml21NaCl and (b) 3500 mg ml21NaCl.
Resolution (FWHM) at m/z 208~2231.
Fig. 11 Effect of increasing concentration of NaCl on isotope ratios obtained from solutions containing 5 ng ml21Ge, Pb, Yb, Te, U and
10 ng ml21Be. Eight 5 s integrations were averaged for each element:
# 69Ge/71Ge; % 206Pb/208Pb;
r 171Yb/174Yb; $ 125Te/128Te; & 235U/238U.
Fig. 12 Transient signal pro®les for the FI introduction of a 35 ml loop of a solution containing 10 ng ml21of the analytes of interest. Data
collected at intervals of 250 ms over a 20 s measurement period.
614 J. Anal. At. Spectrom., 2000, 15, 607±616
carrier solution of 0.3 ml min21, the introduction of a 35 ml volume of analyte solution should take about 7 s; the full-width of the signals (approximately 15 s) is a consequence of the dispersion of the sample in the carrier line (approximately 40 cm long) as well as the wash-in and wash-out characteristics of the spray chamber.
Calibration curves were constructed for each isotope based on a measure of the total integrated counts under the corresponding transient peaks. Linearity over the concentra-tion range used (1±1000 ng ml21) was achieved with pulse
counting detection provided the measured intensity did not result in detector saturation. Examples of such data are summarized in Table 3, wherein it is evident that the signal for the less abundant 25Mg isotope provides for linear response over the full concentration range examined (the consistency of the 25Mg/26Mg ratio also points to linearity in the 26Mg response) but those for Cu and Ag indicate non-linearities at concentrations exceeding 100 and 10 ng ml21, respectively.
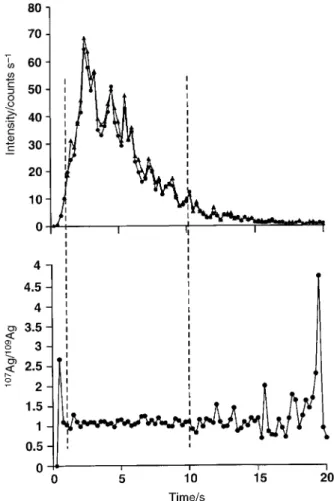
Fig. 13 shows data for the107Ag and109Ag intensities as well as their corresponding ratio as a function of time during the transient. Although a TOF mass analyser does not detect ions of different m/z simultaneously, all ions within a given extraction volume are pulsed into the drift tube at the same time. The good temporal correlation of the intensities for the two isotopes is evident and it is seen that their corresponding ratio remains invariant in time provided suf®cient numbers of ions are detected to permit a reliable measurement; outside the central portion of the signal the intensities over the leading and falling edges beyond the 2 and 10 s cursor limits are too small to generate sensible ratio data. This is further illustrated for several isotope pairs by the data in Fig. 14, encompassing the time period between 2 and 10 s wherein a reasonable signal-to-noise ratio characterizing the transient can be found for the introduction of a 10 ng ml21solution. Despite the small signal intensities, averaged isotope ratios (calculated at 250 ms intervals, n~33) across the selected portion of the transient have associated precisions on the order of 2% (Tl)±8% (Cu) RSD.
The in¯uence of the analyte concentration on the count limited precision expected for several representative isotope ratio pairs is summarized in Table 3. The selection was based on elements for which pulse counting detection was used for both isotopes of interest over the majority of the full concentration range (1±1000 ng ml21). As discussed earlier, the response is linear for Mg over the full concentration range, whereas those for Cu and Ag are non-linear as the concentra-tion approaches 100 ng ml21 and the signals are clearly saturated at 1000 ng ml21. Under conditions for which the detector is not saturated for either isotope, their ratio remains relatively invariant as the analyte concentration increases, but the precision of their determination is enhanced, the latter tracking the precision predicted by a counting statistic limit reasonably well. Clearly, the methodology is thus well-suited to the application of isotope dilution or use of other internal standards for calibration purposes.
Conclusions
The full versatility of the Optimass8000 ICP-oa-TOFMS has clearly not been exploited in the present study. Nevertheless, suf®cient performance information has been generated to permit several conclusions to be discerned. The instrument is well-suited to the acquisition of transient signal information and, although currently limited to an 8 ms temporal resolution for full mass scan events, this is more than suf®cient for applications with FI, ETV and various chromatographic sources of analyte introduction. Mass discrimination and low mass abundance sensitivity are comparable to those reported for quadrupole-based instruments but high mass abundance sensitivity is quite inferior. The problem at present appears to be related to detector ringing. Sensitivity is inferior to current quadrupole-based instruments, but the low background count rate still permits low pg ml21detection limits to be achieved. This sensitivity limitation ultimately restricts the precision of isotope ratio measurements at low concentrations and short measurement times, since counting statistics have been shown to govern the RSD of the measured ratios when pulse counting is employed. Limited sensitivity may also place restrictions on transient signal acquisition parameters in that compromises
Fig. 14 Isotope ratios (uncorrected for background or mass bias) calculated across the central portion of the signal pro®le arising from the FI introduction of a 35 ml volume of a 10 ng ml21 solution of
analytes: % 107Ag/109Ag (1.09¡0.08); r191Ir/193Ir (0.60¡0.02); &
65Cu/63Cu (0.45¡0.35) and ©203Tl/205Tl (0.42¡0.01).
Fig. 13 Signal transient for FI introduction of a 35 ml volume of a solution containing 10 ng ml21 107Ag and109Ag and the corresponding
isotope ratio. Cursors delineate the region over which signal intensities are suf®cient (for silver) for reliable calculation of ratios: +107Ag; $
109Ag.
J. Anal. At. Spectrom., 2000, 15, 607±616 615
Published on 28 April 2000. Downloaded by National Research Council Canada on 13/11/2015 19:30:40.
must be made in setting the time resolution of events so as to ensure realistic count rates during each ion gating event. As an example, to achieve a 10% precision of measurement, a minimum of 100 counts must be accumulated for any analyte, integrated over the course of the event. If the time resolution required is 100 ms, the solution concentration of the analyte currently needs to be w0.1 ng ml21. For faster events, the concentration must be increased to maintain the same % RSD. It is evident that the introduction of ef¯uents from gas chromatographic sources eases this restriction considerably due to this enhanced ef®ciency of sample introduction. These advantages have recently been exploited by Leach et al.17
It remains to investigate residual sources of noise which appear to limit ratio precisions achievable with long integration periods, as well as to examine more closely factors governing the long-term stability of these ratios. Analog detection with this instrument currently does not serve to enhance isotope ratio precision to the levels expected when using high analyte concentrations.
Acknowledgement
The authors thank Lindsay Moore and Peter Sanders (GBC Scienti®c Equipment Pty Ltd.) for their support of, and numerous suggestions for, this study.
References
1 D. P. Myers and G. M. Hieftje, Microchem. J., 1993, 48, 259.
2 D. P. Myers, G. Li, P. Yang and G. M. Hieftje, J. Am. Soc. Mass Spectrom., 1994, 5, 1008.
3 M. Guilhaus, J. Am. Soc. Mass Spectrom., 1994, 5, 588. 4 M. Guilhaus, V. Mlynski and D. Selby, Rapid Commun. Mass
Spectrom., 1997, 11, 951.
5 J. Coles and M. Guilhaus, Trends Anal. Chem., 1993, 12, 203. 6 D. Bandura and R. Peile Paper No. 277 presented at the XXX
Colloquium Spectroscopicum Internationale, 21±25 September, Melbourne, Australia, 1997.
7 M. Guilhaus, D. Selby and V. Mlynski, Mass Spectrom. Rev., 2000, 19, 65.
8 F. Vanhaecke, L. Moens, R. Dams, L. Allen and S. Georgitis, Anal. Chem., 1999, 71, 3297.
9 X. Tian, H. Emteborg and F. C. Adams, J. Anal. At. Spectrom., 1999, 14, 1807.
10 H. Emteborg, X. Tian, M. Ostermann, M. Berglund and F. C. Adams, J. Anal. At. Spectrom., 2000, 15, 239.
11 J. N. Coles and M. Guilhaus, J. Am. Soc. Mass Spectrom., 1994, 5, 772.
12 A. Montaser, J. A. McLean, H. Liu and J.-M. Mermet, in Inductively Coupled Plasma Mass Spectrometry, ed. A. Montaser, Wiley-VCH, New York, 1998, pp. 1±31.
13 I. S. Begley and B. L. Sharp, J. Anal. At. Spectrom., 1994, 9, 171. 14 G. M. Hieftje, D. P. Myers, G. Li, P. P. Mahoney, T. W. Burgoyne, S. J. Ray and J. P. Guzowski, J. Anal. At. Spectrom., 1997, 12, 287. 15 K. G. Heumann, S. M. Gallus, G. Radlinger and J. Vogl, J. Anal.
At. Spectrom., 1998, 13, 1001.
16 K. J. R. Rosman and P. D. P. Taylor, J. Anal. At. Spectrom., 1998, 13, 45N.
17 A. M. Leach, M. Heisterkamp, F. C. Adams and G. M. Hieftje, J. Anal. At. Spectrom., 2000, 15, 151.
616 J. Anal. At. Spectrom., 2000, 15, 607±616