HAL Id: hal-00908765
https://hal.archives-ouvertes.fr/hal-00908765
Submitted on 5 Mar 2014
HAL is a multi-disciplinary open access
archive for the deposit and dissemination of
sci-entific research documents, whether they are
pub-lished or not. The documents may come from
teaching and research institutions in France or
abroad, or from public or private research centers.
L’archive ouverte pluridisciplinaire HAL, est
destinée au dépôt et à la diffusion de documents
scientifiques de niveau recherche, publiés ou non,
émanant des établissements d’enseignement et de
recherche français ou étrangers, des laboratoires
publics ou privés.
Blind Source Separation Methods Applied to Muscle
Artefacts Removing from Epileptic Eeg Recording: A
Comparative Study.
Amar Kachenoura, Doha Safieddine, Laurent Albera, Gwénaël Birot, Fabrice
Wendling, Lotfi Senhadji, Isabelle Merlet
To cite this version:
Amar Kachenoura, Doha Safieddine, Laurent Albera, Gwénaël Birot, Fabrice Wendling, et al.. Blind
Source Separation Methods Applied to Muscle Artefacts Removing from Epileptic Eeg Recording: A
Comparative Study.. RITS 2011 (Colloque National Recherche en Imagerie et Technologies pour la
Santé), Apr 2011, Rennes, France. pp.1708.1-1708.3. �hal-00908765�
Blind source separation methods applied to muscle artefacts removing from
epileptic EEG recording: A comparative study
Amar kachenoura
(1,2), Doha Safieddine
(1,2), Laurent Albera
(1,2), Gwénaël Birot
(1,2), Fabrice
Wendling
(1,2), Lotfi Senhadji
(1,2), Isabelle Merlet
(1,2)1 INSERM, U642, Rennes, F-35000, France;
2 Université de Rennes 1, LTSI, Rennes, F-35000, France. Abstract: Electroencephalogram (EEG) recordings are often contaminated with muscle artifacts. These artifacts obscure the EEG and complicate its interpretation or even make the interpretation unfeasible. In this paper, realistic spike EEG signals are simulated from the activation of a 5 cm2 epileptic patch in the left superior temporal gyrus. Background activities and real muscle artifacts are then added to the simulated data. We compare the efficiency of Empirical Mode Decomposition (EMD), Independent Component Analysis (ICA) and Blind Source Separation based on Canonical Correlation Analysis (BSS-CCA) to remove muscle artifacts from the EEG signals. The quantitative comparison indicates that the EMD approach exhibits a better performance than ICA and BSS-CCA
,
especially in the case of very low Signal to Noise Ratio (SNR). Keys words: ICA, BSS-CCA, EMD, interictal spikes, epilepsy, muscle artefacts removing.I. INTRODUCTION
Epilepsy is common brain disorder characterized by abnormal neuronal firing in the brain. The activities of these neurons can be monitored by electroencephalogram (EEG). Interictal spikes recorded during the periods between seizures are the great importance for diagnostic purposes, since it can help the clinicians both to guide further explorations such as intracerebral implantation or to assist surgery. Nevertheless, the surface EEG signals have, typically, very low amplitude and hence they are severely contaminated by various noises and artifacts, such as broken wire contacts, ocular movements, electrocardiogram, muscular activity (electromyogram, EMG), etc. Thus, one of the challenging tasks in EEG signal processing, is how to extract very weak, brain signals hidden by noise and artifacts usually of higher amplitude. Among all these artfacts, the removing of muscular activity seems to be particularly difficult [1]. This can be essentially attributed to the fact that: i) EMG is spatially and spectrally distributed, ii) some muscular activity, such as facial EMG is sensitive to cognitive process, and iii) in comparison to other artefacts, EMG exhibits less stereotyped response.
Minimizing muscular artefacts from the acquired multi-channel EEG can be considered as a blind source separation problem (BSS), which can be defined as the
estimation of the original sources that generate the multi-channel EEG signals, without a priori (or very little) knowledge about the sources and the mixing process. According to the assumptions made on the sources, the problems of blind estimating the primary sources from a set of observations can be solved using different signal processing methods [2]. We focus, in this paper, on three different techniques, namely, Independent Component Analysis (ICA) [3], BSS using Canonical Correlation Analysis (BSS-CCA) [4-6], and Empirical Mode Decomposition (EMD) [7-8]. More precisely, we aim at showing how EMD performs, to remove muscle artifact from the real life interictal spikes EEG simulations, as compared to ICA and BSS-CCA.
II. MATERIALS AND METHODS
II.1- Problem formulation: In the case of EEG, BSS
assumes that electrical activities recorded at the level of surface electrodes can be considered as a static linear mixture of elementary sources [9] so that the linear observation model below holds:
[m] =
∑
P psp[m] + [m] = [m] + [m]p= 1
x a ν As ν (1) where
s
[ ]
m
is a P-dimensional vector called source vector,A
is(
N × P
)
mixing matrix andνννν
[ ]
m
is a N-dimensional additive noise. The objective of BSS is to recover the primary source vectors
[ ]
m
and/or to identify the mixing matrixA
from the observed vectorx
[ ]
m
without a priori knowledge of the sources and the mixing process, by assuming a few assumptions on the source signals.
II.2- Independent component analysis: The concept of
ICA was introduced by Herault and Jutten [10], especially in order to solve the BSS problem. In the mid 90s, Comon presented a mathematical formulation of ICA [3]. During the past 25 years a wealth of algorithms have been proposed [2] and ICA-based methods have now been extensively and successfully applied to solve many practical real-life problems (see [2] for details). More precisely, assuming the linear observation model of equation (1), ICA consists in looking for an overdetermined
(
N × P
)
mixing matrixA
(i.e. P is smaller than or equal to N) and a P-dimensional sourcess
[ ]
m
which components are the most statistically independent as possible. In other words, the goal of ICAis to find a
(
P× N
)
, full rank, separator matrix,W
, such that the output signaly
[m]
= Wx
[m]
is an estimate of the source vectors
[m]
. Note that in this work, we use the COM2 algorithm [2] which is based on a maximization of a contrast functions derived from Higher Order (HO) cumulants of the data.II.2- Canonical correlation analysis: Originally proposed by [4], CCA is a method searching for a basis vectors for two sets of variables such that the projections of the two variables onto this basis are maximally correlated. Borga et al. [5] showed that CCA can be applied in BSS, and proposed a new algorithm (BSS-CCA) to solve the problem presented in equation (1) by forcing the sources
s
[ ]
m
to be mutually uncorrelated and maximally autocorrelated. To do so, let's consider the observed vectorx
[ ]
m
and its temporally delayed version[ ]
m
=
[
m
−
1]
z
x
. The BSS-CCA algorithm finds the linear combination ofx
[ ]
m
that is maximally correlatedwith the linear combination of
x
[
m
−
1]
. Now, construct two new linear combinationsb m
[ ]
andc m
[ ]
such that:[ ] =
[ ] +
+
[ ] =
[ ]
[ ] =
z[ ] +
+
z[ ] =
[ ]
⋯
⋯
1 N 1 N T x 1 x N T 1 Nb m
w x m
w x m
m
c m
q z m
q z
m
m
x zw
x
q z
(3)The problem is to find the weight vectors
w
xandq
x thatmaximize the correlation,
ρ
, betweenb m
[ ]
andc m
[ ]
by solving the following maximization problem:( , )
(
)(
)
max ρ
=
x z T x xz z T T w ,q x xx x z zz zw
R q
b c
w
R w
q R q
(4)with
R
xxandR
zzthe autocovariance matrices ofx
andz
respectively, andR
xzthe crosscovariance matrix ofx
andz
After some manipulations, demixing matrix,W
, such thaty
[m]
= Wx
[m]
is an estimate of source vectors
[m]
can be easily calculated by solving the eigen-matrix equationR
xx−1R R
xz zz−1R w
zx x=
ρ
2w
x, where the eigen-valuesρ
2are the squared canonical correlation and the eigen-vectorsw
xare the columns of the demixing matrixW
.II.3- Empirical mode decomposition: Empirical Mode
Decomposition (EMD) was originally introduced in the late 90s to study water surface wave evolution [7]. EMD can be considered as an emerging technique in signal processing with a very important research topics and development in various fields [7, 8], Hurst exponent estimation [3], etc. EMD can be viewed as a method which splits a given signal into a set of AM-FM components. The latter components, referred to as the Intrinsic Mode Functions (IMFs), are estimated using an iterative procedure called sifting process. Let
{ [ ]} = { [ ]}
x m
a m
0 be a signal to decompose. The sifting process to estimate the kth IMF(1
≤ ≤
k
K
)
can besummarized as follows:
1. Initialization taking
d
k,0[ ] =
m
a
k -1[ ]
m
for every m. 2. Computation of the mean envelopeM
{
d
k, j[ ]}
m
. 3. Extraction of the details{
d
k, j+1[ ]} = {
m
d
k, j[ ]} -
m
{
M
{
d
k, j[ ]}
m
.4. Incrementation of j and go to step 2, repeat until
{
d
k, j+1[ ]}
m
is designated as an IMF.Several EMD methods have been proposed in the literature, depending on the way the mean envelope
{
d
k, j[ ]}
m
M
is calculated. The 2T-EMD method proposed in [8] is used hereafter. This method differs from the other approaches by its computational lightness and its algorithmic simplicity. It also enables both mono and multivariate decompositions without any change in the core of the algorithm.III. PERFORMANCE COMPARISON
III.1- Data generation: The main goal of this subsection
is to explain how we obtain synthetic but realistic data for comparing the above BSS methods in the particular context of epileptic interictal spikes. The simulated EEG data (one observation is displayed in figure 2), are generated using a realistic head and source model as described in [11]. 31-Channels EEG data were simulated from a single distributed source of 5cm², referred to as "patch" in the following, located in the left superior temporal gyrus. Hyper-synchronous spike-like activities generated by a neural mass model are assigned to the patch whereas uncorrelated background activities are attributed to the remaining part of the cortex. 50 trials of these simulated EEG are generated for the study. A different muscle activity issued from real EEG data is added to each trial.
III.2- Performance criterion: The performance of the
three BSS methods, namely COM2, BSS-CCA and 2T-EMD, are evaluated by computing the following normalized mean-squared error (NMSE):
[ ]
( )[ ]
(
)
[ ]
(
)
ˆ
=
∑ ∑
∑
i 2 J M j i i j=1 m=1 x M 2 i m=1x m - x
m
NMSE
J
x m
(5)where
x m
i[ ]
is the original EEG observation on the ith electrode (EEG without muscle activity),ˆ
x
i( )j[ ]
m
is the reconstructed surface EEG after denoisingfrom the j
thrun,
J is the number of Monte Carlo runs and M is the data length.III.3- Simulation results: Before discussing the obtained
the ICA components accounting for the artifact removing is based on visual inspection and the signal was reconstructed, excluding the components related to the artifact, ii) for the BSS-CCA method, the selection of artifactual sources was based on thresholding criteria on the autocorrelation curve of the canonical components [6], and iii) as far as the EMD method is concerned, the IMFs of interest are selected using EMD-WAV procedure presented in [12] that was reported to exhibit a high performance on synthetic and real signals, and has the advantage of not needing either a reference signal or an a priori information about the noise.
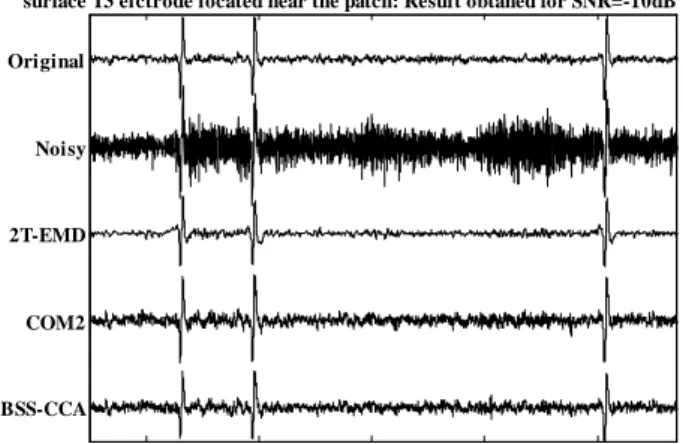
Figure 1 shows the results obtained at the surface electrode T3, (facing the patch) in the case of SNR=-10dB. Clearly, the 2T-EMD has a better behavior than COM2 and BSS-CCA. This result is confirmed in Table 1 where the NMSE computed at the output of COM2, BSS-CCA and 2T-EMD methods, as a function of SNR, is depicted. Indeed the reconstruction error of 2T-EMD is lower than those of ICA and BSS-CCA, especially for lower SNR. BSS-CCA COM2 2T-EMD Noisy Original
surface T3 elctrode located near the patch: Result obtaned for SNR=-10dB
Fig.1The obtained surface EEG on surface electrode T3 at the output of 2T-EMD, COM2 and BSS-CCA.
-25dB -20dB -15dB -10dB -5 dB 0 dB
BSS-CCA 0.8661 0.5922 0.3664 0.2161 0.1245 0.0711
COM2 0.6186 0.4230 0.2617 0.1543 0.0889 0.0508
2T-EMD 0.3936 0.3080 0.2079 0.1217 0.07361 0.0528
TABLE 1: The NMSE, calculated from EEG of electrode T3, at the output BSS-CCA, COM2 and 2T-EMD.
methods.
IV. DISCUSSION - CONCLUSION
In this paper we present a study comparing the ability of EMD, ICA and BSS-CCA to remove muscle artifacts from EEG signals. Simulations of realistic epileptic EEG signals (interictal spikes) have been used to quantitatively compare the different algorithms. The results indicate that the EMD method as a performant tool to the remove muscle artifacts. Nevertheless, despite very promising
finding, a careful evaluation of the method on more realistic synthetic EEG data and the application of the method on clinical data must be performed in the future.
REFERENCE
[1] B. W. McMenamin, A. J. Shackman, L. L. Greischar, R. J. Davidson, Electromyogenic artifacts and electroencephalographic inferences revisited, Neur- Image, vol. 54, pp. 4–9, 2011.
[2]. L. Albera, P. Comon, L. Parra, A. KarfoulL, A. Kachenoura, L. Senhadji, Biomedical applications, in
Handbook of blind source separation, P. COMON and C.
JUTTEN, Eds. Academic Press, 2010.
[3] P. Comon, Independent Component Analysis, a new concept ? Signal Processing, Elsevier, vol. 36, no. 3, pp. 287–314, 1994.
[4] H. Hotelling, Relations between two sets of variates,
Biometrika, vol. 28, pp. 321–377, 1936.
[5] O. Friman, M. Borga, P. Lundberg, H. Knutsson, Exploratory fMRI analysis by autocorrelation maximization, NeuroImage, vol. 16, no. 2, pp. 454–464, 2002.
[6] W. De Clercq, A. Vergult, B. Vanrumste, W. Van Paesschen, S. Van Huffel, Canonical correlation analysis applied to remove muscle artifacts from the electroencephalogram, IEEE Transactions on Biomedical
Engineering, vol. 53, no. 12, pp. 2583 – 2587.
[7] N. Huang, Z. Shen, S. Long, M. Wu, H. Shih, Q. Zheng, N.-C. Yen, C. Tung, H. Liu, The empirical mode decomposition and the hilbert spectrum for nonlinear and non-stationary time series analysis, Proc. of the Royal
Society A: Mathematical, Physical and Engineering Sciences, pp. 903-995, 1998.
[8] J. Fleureau, J. C. Nunes, A. Kachenoura, L. Albera, L. Senhadji, Turning Tangent Empirical Mode Decomposition: a framework for mono and multivariate signals, IEEE Transactions on Signal Processing, DOI: 10.1109/TSP.2010.2097254, 2010(to appear).
[9] C. J. James, C. W. Hesse, Independent component analysis for biomedical signals, Physiological measurement, vol. 26, no. 1, pp. 15–39, 2005.
[10] B. Ans, J. Herault, C. Jutten, Adaptative neural architectures: Detection of primitives, in COGNITIVA’85, pp. 593–597, Paris, France, 1985.
[11] D. Cosandier-Rimélé, J. Badier, P. Chauvel, F. Wendling, A physiologically plausible spatio-temporal model for depth-EEG signals recorded with intracerebral electrodes in human partial epilepsy, IEEE Transactions
On Biomedical Engineering, vol. 3, no. 54, pp. 380–388,
2007.
[12] Y. Kopsinis, E. Aboutanios, D. A. Waters, S. McLaughlin, Development of EMD-based Denoising Methods Inspired by Wavelet Thresholding, IEEE
Transaction. on Signal Processing, vol. 57, no.4 ,pp.