1
Case Studies on Companies that Delisted from US and Relisted in China By
Yuan Tian
B.S. Electrical Engineering, Tsinghua University, 2013
SUBMITTED TO THE MIT SLOAN SCHOOL OF MANAGEMENT IN PARTIAL FULFILLMENT OF THE REQUIREMENTS FOR THE
DEGREE OF
MASTER OF SCIENCE IN MANAGEMENT STUDIES AT THE
MASSACHUSETTS INSTITUTE OF TECHNOLOGY
JUNE 2020
© 2020 Yuan Tian. All Rights Reserved.
The author hereby grants to MIT permission to reproduce and distribute publicly paper and electronic copies of this thesis document in whole or in part
in any medium now known or hereafter created.
Signature of Author______________________________________________________________ MIT Sloan School of Management
Certified by_____________________________________________________________________ Christopher F. Noe Senior Lecturer of MIT Sloan School of Management
Thesis Supervisor
Accepted by___________________________________________________________________ Jacob Cohen Senior Associate Dean for Undergraduate & Master’s Program
2
Case Studies on Companies that Delisted from US and Relisted in China By
Yuan Tian
Submitted to the MIT Sloan School of Management on May 8, 2020, in partial fulfillment of the requirements for the degree of
Master of Science in Management Studies
Abstract
China concept stocks, the stock in a company that operates in mainland China and listed in the US, are becoming the largest group of non-native listed stocks in the US in terms of market value. This paper reviews the peaks and troughs of China concept stocks listed in the US in the past two decades, analyzes the reasons why Chinese companies have had to raise funds in the US, the benefits of an IPO in US stock market, and their post-IPO stock performance. In order to evaluate whether Chinese stocks listed in the US are successful or not, this paper tracks the status of 283 stocks that listed in the US from 2000 to 2019, uncovering the abnormal fact that nearly 1/3 of them ultimately delisted from US stock market.
For the delisting stocks, this paper analyzes the effect of financial fraud at some companies and its overall negative impact on China concept stocks. The signal effect of fraud is so significant that over 80 companies claimed
privatization under reputational pressures while only 8 companies were forced to delist due to financial fraud. Finally, this paper discusses the future of China concept stocks in the US and proposes some advice for Chinese companies .
3
Contents
1. Background of Chinese and US Stock Market ... 4
1.1 US Stock Market ... 4
1.2 Global Investors’ Interest in Chinese Firms ... 4
1.3 Limited and Immature Chinese Stock Market ... 5
1.4 Strong Motivation to List in US ... 6
1.4.1 High Requirements and Regulations ... 6
1.4.2 Broader Shareholder Base and Investment Expertise ... 7
1.4.3 Limited Source of Capital... 7
1.4.4 High Growth Start-ups ... 8
1.4.5 Variable Interest Entity (VIE) ... 8
2. Literature Review ... 9
3. Highs and Lows of China Concept Stocks ... 12
3.1 Pre-2000 Time Frame ... 13
3.2 Chinese Three Musketeers in 2001 ... 13
3.3 From 2004 to Financial Crisis ... 14
3.4 Crisis of Frauds in 2010 ... 14
3.5 Fintech Newcomers since 2016 ... 15
4. Characteristics of Delisted China Concept Stocks ... 16
4.1 Short Selling Crisis Due to Financial Fraud ... 19
4.2 Chinese Bully Stock Market since 2015 ... 21
4.3 Other Motivations for Delisting ... 22
4.3.1 Under Valuation Due to Insufficient Information ... 23
4.3.2 Management Buyout ... 23
4.3.3 Sino-US Trade Friction and Restriction ... 24
5. Case Studies on China Concept Stocks ... 25
5.1 Case Study——Shenzhen Mindray ... 25
5.2 Case Study——United Family Healthcare ... 27
5.3 Case Study——Luckin Coffee ... 29
6. Conclusions ... 31
Acknowledgements ... 32
References ... 33
Appendix... 35
4
1. Background of Chinese and US Stock Market
China concept stocks are US-listed companies that operate in Mainland China.
1.1 US Stock Market
The US stock market is the largest and most efficient in the world. The market capitalization of all US exchanges is currently $34 trillion, compared to the rest of the world’s $44 trillion [1]. The average daily trading volume on US
exchanges is over $500 billion, and quarterly trading volume accounts for more than 60% of the world’s total [2].
The US stock market is not only the biggest, but also the safest market for investing. It benefits from advanced trading technologies, transparent
regulation, a standardized system for financial disclosure, and legal protections for investor rights. The US stock market is also dominated by sophisticated professional investment institutions. These facts all contribute to the US stock market being one of the most expensive in the world, along with Switzerland, Japan and the Netherlands. In 2018 Q4, the average P/E ratio in the S&P 500 was 18.94 compared to 15.02 in the MSCI Emerging Markets [3][4].
1.2 Global Investors’ Interest in Chinese Firms
US investors’ interest in Chinese companies began in earnest in 1997. When the Asian financial crisis hit the Hong Kong and Singapore stock markets, many Chinese companies demonstrated strong performance on those exchanges during that time. Since then, more and more Chinese companies have begun to seek financing through listing on foreign stock exchanges, primarily in the US. In 2000, the first wave of Chinese issuers started going public in the US. One notable listing happened in 2005 when Baidu (NASDAQ: BIDU) launched its
5
IPO at $27 and closed on its first day at $122.54, hitting an intraday high of $151.21 and making it the most successful ADR IPO on NASDAQ in that year
[5]. Nine years later, Chinese e-commerce giant Alibaba was listed on the
NYSE, raising $25 billion in the largest IPO in history at that time. It opened at $92.70, a 36.3% increase from its issue price of $68, and closed its first day at $93.89 [6].
1.3 Limited and Immature Chinese Stock Market
It is interesting to note that many of China’s companies in the Fortune 500 are only listed on foreign exchanges and not available for domestic Chinese investors. There are several reasons for this controversial phenomenon.
First, the Chinese stock market is still in its infancy and the performance of firms is not fully reflected in terms of the stock prices. While China’s GDP grew by 8% annually between 2001 to 2012, the Chinese stock buy-and-hold annual return on equity is 1.32%, a negative return considering the inflation rate of 2.51% during that period [7].
Second, the Chinese stock market is dominated by retail investors with 75% of stocks held by retail investors. However, only 20% of stocks in the US stock market are held by retail investors [8]. According to a 2014 survey by the Southwestern University of Finance and Economics, 6 8% of new investor households in China had less than a high school degree, which results in most trading being conducted based on speculation rather than informed valuations or decisions [9]. The risk aversion of retail investors also presents a challenge for issuers by making panicked selling in downturns more likely.
6
Lastly, the process of a domestic IPO can be unpredictable and cumbersome because of the high regulation pressure from the China Securities Regulatory Commission (CSRC). The financing needs of fast-growing Chinese companies are so enormous that the domestic equity market for providing capital could be overwhelmed. As a result, the CSRC restricts the timing of IPOs and issu ance of shares. The distortion on stock issuances and pricing has made the average underpricing ratio of IPOs in China the highest in the world. For example, the average first-day return on Chinese domestic IPOs in 2009 was 138%, far more than European IPOs (less than 30%) and US IPOs (17%) [10].
1.4 Strong Motivation to List in US
Due to the immaturity of the domestic stock market, Chinese firms have had no choice but to list abroad in order to raise sufficient capital. In 2019, the market capitalization of Chinese companies listed on major U.S. exchanges was $1.3 trillion, almost the same as that of Canadian-listed companies [11]. Chinese
issuers have considered factors apart from market liquidity when deciding to cross-list in the US.
1.4.1 High Requirements and Regulations
A more transparent legal system, more reliable accounting standards, more stringent listing requirements, and stronger regulatory agencies are primary reasons that Chinese companies select to cross-list in the US. Cross-listed companies adapt to US rules by creating more professional boards of directors, employing greater accounting conservatism, providing more transparent information disclosure, and generating higher investment efficiency than their domestic counterparts [12]. Doidge, Karolyi and Stulz (2004) find that overseas listed firms become bonded to the stricter regulatory environment in the US and
7
thus they are likely to have better visibility and coverage in the financial press, which may lead them to expropriate less [13].
1.4.2 Broader Shareholder Base and Investment Expertise
According to risk management theory, broadening the shareholder base for a firm’s securities can lead to risk sharing and thus a lower cost of capital. Jayuraman, Shastri, and Tandon (1993) point out that cross listing should be associated with an increase in the variance of returns on the dually listed security, since informed traders are likely to trade in both markets [14]. Listing abroad also reduces thresholds for foreign investors who are interested in benefiting from Chinese companies. These market frictions include foreign currency cost, foreign transaction cost, foreign investment restrictions, and information disadvantage (foreign investors may not know much about domestic issuers). Listing abroad is an easy way to solve these frictions.
Pagano, Roell, and Zechner (2002) claim that US exchanges attract high-tech and export-oriented European firms with rapid expansionary plans [15]. With the expertise and superior knowledge about the high-tech industry, analysts in the US can better assess the share value of a high-tech company. This may lead to greater availability of equity financing for these high -tech firms. Therefore, high-tech firms are more likely to list on US exchanges.
1.4.3 Limited Source of Capital
The majority of retail investors are more willing to invest in large state-owned companies because of their aversion to risk. Medium and small private
companies cannot get stable financial support because the Chinese stock market is very volatile and sensitive to rumors and inside information . In addition, state-owned banks limit access to bank loans for small and medium -sized
8
companies, preferring instead to lend to larger, better-capitalized enterprises. This mismatch in supply and demand for Chinese bank capital has led many smaller companies to seek equity financing in the US.
1.4.4 High Growth Start-ups
There is an obvious trend that there are more and more Chinese high -tech startups listing in the US stock market. If a startup chooses to list in China, the VC investment can be illiquid and typically held for 3 -8 years [16]. Will,
Sabrina, and Ran (2017) find that there is a correlation between long waiting periods and depressed VC investment in China [17]. However, the US capital
market provides a possibility of rapid IPO. For instance, Pinduoduo (NYSE: PDD) took only three years to IPO in the US, and Luckin (NASDAQ: LK) was even faster, only two years. The entrepreneur has reached a milestone, and the investor has successfully exited. This is a win-win outcome.
1.4.5 Variable Interest Entity (VIE)
A VIE is an entity controlled by a company by means other than a majority of voting rights [18]. The VIE structure is common among Chinese high-tech companies, including internet giants like Sina—which in 2000 became the first US-listed Chinese company using a VIE—and Alibaba. These companies have accepted foreign venture capital and private equity investments through a VIE structure. The entrepreneur can enjoy the control of the firm despite owning little equity. However, companies with a VIE structure are prohibited from listing and trading in China. If these companies want to go back to the domestic market, they must divest their foreign currency assets and dismantle the VIE structure. These conditions make it very difficult for these companies to raise domestic capital.
9
2. Literature Review
Earlier research mainly focuses on China concept stocks before 2010. Cheung, Jing, Lu, Rauc, and Stouraitisa (2009) point out that the first Chinese company listed in US stock market can be traced back to 1983, and investors bought China concept stocks in order to participate the enormous growth of Chinese economy
[19]. Fernald and Rogers (2002) implicate that there is a price gap between the
foreign share and the domestic share. In order to attract foreign investors, some China concept stocks offer deep discounts intentionally so that foreigners can pay 75% less than domestic residents. Luo and Jackson (2012) work on the backdoor listing of Chinese companies. Since 2005, the Chinese IPO market was frozen for years because of the reform of split-share structure launched by the CSRC, aiming at transferring all non-tradable shares into tradable shares. Facing this challenge, many Chinese firms found special ways to get listed in the US market. The Public Company Accounting Oversight Board (PCAOB) claims that more than 150 Chinese companies have listed their shares through reverse mergers instead of direct IPO process [20].
Chinese researchers started to focus on China concept stocks since 2010. Wang (2013) mainly analyzes the motives for the privatization of Chinese stocks. He suggests that it was difficult for foreign investors to understand the profit model of Chinese companies. He also points out that the short-selling mechanism and strict supervision on financial fraud have forced a large number of small and medium-sized Chinese companies to delist between 2010 and 2012 [21]. Qian
(2018) mainly studies the financial fraud of China concept stocks. He implicates that the delisted companies due to financial fraud are mainl y small and medium-sized companies instead of the mainstream companies. These small companies
10
use reverse acquisitions and very clumsy methods in conducting financial fraud. However, the responsible accounting firms failed to show audit independence and colluded with these companies to commit fraud, which caused great damage to the reputation of the whole of China concept stocks. As a result, the China 30 index fell from 1200 points in 2011 to the 600 points at the end of 2012 [22].
Yang (2018) concentrates on the practice of VIE structure in Chinese companies. Although the VIE model is widely used among China concept stocks, there are legal regulation risk, enterprise risk, and information disclosure risk, which requires founders to take effective control and to set important clauses of the investment agreement before adopting VIE structure [23].
Deng (2018) compares the different paths for Chinese stock companies to return to A-share listing. Direct IPO, backdoor listing and China Depository Receipts (CDR) are the three main forms of returning. He recommends that companies should consider factors such as length of time, amount of funds, foreign exchange management, and information disclosure in choosing right path of returning [24].
Zhao (2018) introduces the advantages and disadvantages of CDR . He declares that CDR has paved the way for China concept stocks to return to A shares, but the regulatory risks and liquidity deficiency of CDRs will bring additional risks to the A share market, which is the reason why the CSRC has not approved the issuance of CDRs [25].
A Shenzhen stock exchange study (2017) reviews the characteristics and stock returns of six relisted China concept stocks. It points out that the return of China concept stocks significantly improves the performance as well as valuations of
11
share companies, and promotes competition and development within the A-share market. However, such returns also bring regulatory pressures on foreign exchange and share sales in the secondary market in the short run. [26].
This paper mainly studies the market performance of China concept stocks after 2010, especially the two major delisting waves. The rapid development of the Chinese economy has spawned a large number of Chinese companies to go public in the US, but due to backdoor IPOs and lack of collaboration between PCAOB and CSRC, several small and medium-sized enterprises conducted financial frauds and caused many China concept stocks to get shorted and delisted. Many US investors had a bias on Chinese stocks, resulting in sell-offs and undervaluation. A great many Chinese companies signed privatization deals because of the trust crisis and undervaluation rather than financial frauds.
Mining the motivation of delisting companies and the subsequent financial performance can be a good proof of whether these companies are actually guilty of financial frauds. At the same time, seeing the phenomenon of Chinese companies continuously going overseas for financing, the CSRC is also constantly carrying out policy reforms to attract Chinese stock companies to return to the Chinese stock market. Studying the behavior of these financial fraud companies can also help the Chinese government to better prevent such financial misbehaviors.
The rest of the paper is structured as follows. Section 3 presents the historical listing waves of China concept stocks in the past two decades. Section 4 focuses on the delisted stocks’ performance and motivations for delisting. Section 5 gives specific examples of delisting stocks, including financial performance before
12
delisting and financial performance after relisting back in Chinese market . Section 6 concludes.
3. Highs and Lows of China Concept Stocks
This paper studies the financial performance of China concept stocks – companies that are based in China (including Hong Kong and Taiwan) and listed on US exchanges (NYSE, AMEX, and NASDAQ, excluding PINK exchange or OTC exchange). The rapid development of the Chinese economy spawned a large number of Chinese companies going public in the US, but many ultimately delisted. Mining the motivation of delisting companies and their subsequent financial performance can provide evidence on the cost-benefit tradeoff of foreign listing for Chinese companies, offering potentially useful insights to managers as well as regulators.
My sample consists of all companies from the China concept stocks list provided by SINA Finance that listed on the three major US stock exchanges
[27]. For example, AMC Entertainment, the movie theater chain, is a Chinese
concept stock because it is controlled by a company in China but trades on the NYSE. I collect accounting and stock price data for my sample companies from Thomson Reuter Datastream and Wharton Research Data Services (WRDS). I use this data to measure key financial ratios like the return of capital
investment (ROIC). I also use this data to measure stock price performance over time following the IPO. I exclude companies without available data. My final consists of 283 companies. The complete list is contained in Appendix I.
13
Figure 1. Number of listing stocks (From 1992 to 2019) [28]
3.1 Pre-2000 Time Frame
The first wave of companies that looked for global financial support were state owned enterprises (SOEs). For example, China Eastern Airlines listed on the NYSE in 1997, and PetroChina listed in 2000. These companies were large and required more capital than the Chinese stock exchange could offer at the time. These stocks were also selected as the representatives for China by the government. As a result, these companies have been stable even through several financial crises, including the 1997 Asian financial crisis.
3.2 Chinese Three Musketeers in 2001
The second wave of China concept stocks occurred in 2000.These companies were mainly internet companies, represented by the “Three Musketeers” Sina (NASDAQ: SINA), Sohu (NASDAQ: SOHU) and Netease (NASDAQ: NTSE). Different from SOEs, these private companies were short of capital, and they treated the US stock market as a crucial resource for their development. At the same time, foreign investors were becoming more interested in Chinese
14
companies because of the strong performance after 1997 and the huge Chinese market. The “Three Musketeers” successfully issued their stocks in 2000, but the internet bubble burst shortly afterward, and their stock prices fell to nearly zero. Both investors and Chinese companies were so disappointed that foreign IPOs of Chinese company ceased for three years.
3.3 From 2004 to Financial Crisis
In 2004, markets around the world had recovered from the dot.com bust and the effects of 9/11. Investors regained their interest in Chinese companies, which resulted in the third wave of Chinese concept stocks. The optimism for Chinese concept stocks at this time came from China’s growing economy and
confidence in China’s future development. This boom continued into 2005 and 2006 and reached its climax in 2007. There were 31 Chinese companies that completed their US IPOs in that year. Even though the financial crisis broke out in US market in 2008, Chinese concept stocks did not universally collapse , and some of them even performed better than market indexes. The number of US IPOs by Chinese companies fell slightly in 2009 but began to pick up again in 2010. In addition to the companies in the technology, media, and telecom sectors, real estate, pharmaceutical, food, and ener gy companies also began to list in the US.
3.4 Crisis of Frauds in 2010
With the number of China concept stocks growing, some low-quality firms found their way to raise money. Beginning in 2011, some of these companies were the subject of negative research reports by investors like Muddy Waters and Citron, who had shorted the stocks. Some of the short seller allegations turned out to be true. Not only were the companies mentioned in the reports
15
negatively affected, but the reputation of all China concept stocks suffered. Investors began to turn away from Chinese concept stocks due to financial fraud and poor management. The crisis of confidence resulted in the second low period of Chinese stocks listing on the US market.
It was not until China and the US signed a joint regulatory memorandum on financial fraud in 2012 that Chinese stocks began listing in the US again. However, rebuilding the reputation of Chinese concept stocks was still a long and tedious process. Fortunately, two technology firms, Alibaba (NYSE: BABA) and JD (NASDAQ: JD), had very successful listings in 2014. This success was attributable, in part, to the companies adopting many international best practices on corporate governance and financial oversight.
3.5 Fintech Newcomers since 2016
The fourth wave of Chinese concept stocks was represented primarily by
fintech and mobile services companies and began in 2016. In 2017, peer to peer lending (P2P) boomed and attracted a significant amount of private equity and venture capital funding. Investors and entrepreneurs hoped to use the
momentum of the P2P boom to complete an IPO as soon as possible. However, it was difficult for these startups to meet the strict requirements of the CSRC for domestic listing. As a result, these companies chose to go publ ic in the US, and a record number, 47, listed in the US in 2017.
In summary, the growth in Chinese stocks listing in the US over the last 30 years can be described as uneven. Periods of prosperity were interrupted by economic downturns or scandals. Over the same period, the type of listed companies has also become more diversified beyond technology, media, and
16
telecom into healthcare, education, consumer goods, finance, and other industries.
4. Characteristics of Delisted China Concept Stocks
Despite the successful financing in the US stock market, many Chinese stocks have encountered problematic issues such as underestimated market value, stalled financing, and short-selling crises ever since listing. As a result, many Chinese companies had to announce delisting.
Nearly one third of thesample,80 stocks, have delisted from NYSE and NASDAQ. Ten stocks were force to delist by the SEC because of financial fraud and inability to follow regulation. Other stocks delisted through privatization or PE buyouts. Exhibit 1 shows a complete list of the delisted stocks along with current status and reason for delisting.
TIC List Date Delist Date Years Status Note
1 CNIT 08/06/1992 08/06/2001 9.00 Out of business
2 AMCN 10/16/1995 02/12/2002 6.25 Out of business
3 CELM 01/29/2010 03/30/2011 1.17 Still operating Forced
4 CRTP 08/03/2009 06/24/2011 1.83 Still operating Forced
5 CHBT 10/23/2008 07/01/2011 2.67 Out of business Fraud
6 CABL 07/30/2008 07/28/2011 2.92 Out of business Forced
7 WATG 08/09/2007 09/12/2011 4.08 Still operating Fraud
8 APWR 01/22/2008 09/26/2011 3.67 Out of business
9 KEYP 09/15/2010 10/07/2011 1.00 Out of business Fraud
10 CIIC 08/12/2008 11/18/2011 3.25 Out of business Fraud
11 ABAT 10/09/2007 11/30/2011 4.08 Out of business Fraud
12 FEED 08/29/2007 12/19/2011 4.25 Acquired
13 CCGM 09/28/2007 02/21/2012 4.33 Out of business Forced
14 SCEI 06/14/2010 05/18/2012 1.92 Out of business
15 WUHN 07/18/2008 06/15/2012 3.83 Still operating
16 CAST 10/29/2007 06/25/2012 4.58 Out of business Fraud
17 TUDO 08/17/2011 08/24/2012 1.00 Acquired
18 DID 11/03/2009 12/17/2012 3.08 Out of business
19 FMCN 07/13/2005 05/24/2013 7.83 Relist 002027.cn
20 HOGS 12/27/2007 06/27/2013 5.50 Out of business
17
22 SVN 11/20/2009 07/08/2013 3.58 Acquired
23 SCR 04/20/2007 12/24/2013 6.67 Still operating
24 SPRD 06/27/2007 12/24/2013 6.42 Acquired
25 CEDU 12/11/2007 04/24/2014 6.33 Still operating
26 GA 11/01/2007 07/21/2014 6.67 Relist 002558.cn
27 CHDX 08/18/1994 09/30/2014 20.08 Acquired
28 HMIN 10/26/2006 12/17/2014 8.08 Acquired
29 PWRD 07/26/2007 07/29/2015 8.00 Relist 002624.cn
30 CMGE 09/25/2012 08/11/2015 2.83 Relist 00302.hk
31 GOMO 11/22/2013 11/18/2015 1.92 Out of business
32 GAME 09/25/2009 11/19/2015 6.08 Relist 002602.cn
33 WX 08/09/2007 12/11/2015 8.33 Relist 603259.cn
34 VIMC 11/15/2005 12/21/2015 10.08 Relist 600770.cn
35 MR 09/26/2006 03/03/2016 9.42 Relist 300760.cn
36 YOKU 12/08/2010 04/06/2016 5.25 Acquired
37 BONA 12/09/2010 04/11/2016 5.33 Still operating
38 MCOX 10/26/2010 04/15/2016 5.42 Out of business
39 DATE 05/11/2011 05/16/2016 5.00 Still operating
40 LONG 10/28/2004 06/01/2016 11.58 Acquired
41 XUE 11/02/2010 06/06/2016 5.58 Relist 000526.cn
42 TAOM 06/09/2011 06/23/2016 5.00 Out of business
43 KUTV 08/17/2010 07/12/2016 5.83 Acquired
44 QIHU 03/30/2011 07/18/2016 5.25 Relist 601360.cn
45 NPD 11/09/2007 08/04/2016 8.67 Out of business
46 EJ 08/08/2007 08/15/2016 9.00 Relist 02048.hk
47 DSKY 08/07/2014 09/08/2016 2.08 Relist 01119.hk
48 DANG 12/08/2010 09/21/2016 5.75 Still operating
49 MOBI 12/10/2010 11/17/2016 5.92 Still operating
50 EFUT 10/31/2006 01/12/2017 10.17 Acquired
51 VISN 12/06/2007 03/06/2017 9.25 Still operating
52 TSL 12/19/2006 03/14/2017 10.17 Still operating
53 KZ 07/09/2004 04/17/2017 12.75 Still operating
54 STV 10/05/2007 05/16/2017 9.58 Out of business
55 SYUT 04/12/2007 05/16/2017 10.08 Still operating
56 JFC 07/16/1992 07/11/2017 24.92 Still operating
57 GSOL 05/01/2000 08/29/2017 17.25 Acquired
58 ZPIN 06/12/2014 10/02/2017 3.25 Still operating
59 XNY 11/23/2010 03/04/2018 7.25 Still operating
60 NQ 05/05/2011 03/13/2018 6.83 Out of business
61 SPIL 09/07/2000 04/18/2018 17.58 Still operating
62 ZX 05/12/2011 06/18/2018 7.08 Still operating
63 YGE 06/08/2007 07/03/2018 11.00 Still operating
64 JASO 02/07/2007 07/17/2018 11.42 Relist 002459.cn
65 KONE 05/14/2010 09/19/2018 8.33 Out of business
66 BSPM 04/23/2010 09/19/2018 8.33 Still operating
67 LKM 03/14/2018 12/20/2018 0.75 Out of business
18
69 CCCR 08/13/2013 01/16/2019 5.42 Out of business
70 KANG 04/09/2014 01/22/2019 4.75 Still operating
71 EHIC 11/18/2014 04/10/2019 4.33 Still operating
72 SMI 03/17/2004 06/13/2019 15.17 Still operating
73 BORN 06/11/2010 06/19/2019 9.00 Still operating
74 YGTY 02/05/2018 07/29/2019 1.42 Out of business
75 CCIH 10/01/2010 09/06/2019 8.92 Out of business
76 CLDC 07/13/2016 09/06/2019 3.08 Out of business
77 CNTF 05/06/2005 09/19/2019 14.33 Out of business
78 AUO 05/23/2002 10/01/2019 17.33 Still operating
79 HPJ 06/19/2008 11/01/2019 11.33 Still operating
80 PPDF 11/10/2017 11/28/2019 2.00 Still operating
Exhibit 1. Name list of delisted companies (As of 12/31/2019) As shown in Exhibit 1, these stocks are divided by four categories:
(1) Still Operating (29 companies): These companies are currently still in business despite delisting in the US.
(2) Out of business (26 companies): These companies went bankrupt after delisting because their businesses proved to be unsustainable.
(3) Relist (14 companies): These companies chose to delist because they want ed to relist in China or Hong Kong.
(4) Acquired (11 companies): These companies either became targets for PE buyouts or Chinese big tech firms like Alibaba.
Next, I calculate the stock return by using the ratio of the delisting price to the IPO offering price.
𝑆𝑡𝑜𝑐𝑘 𝑟𝑒𝑡𝑢𝑟𝑛 = 𝑆𝑡𝑜𝑐𝑘 𝐼𝑃𝑂 𝑜𝑓𝑓𝑒𝑟𝑖𝑛𝑔 𝑝𝑟𝑖𝑐𝑒
𝑆𝑡𝑜𝑐𝑘 𝑑𝑒𝑙𝑖𝑠𝑡𝑖𝑛𝑔 𝑝𝑟𝑖𝑐𝑒 − 100%
Unfortunately, only 21 out of 80 delisting companies had a positive stock return when they delisted from the US. To differentiate the performance in various categories, I calculate the average return, median return, standard deviation, highest return, lowest return. The results are shown in Exhibit 2.
19
Stock return Average Median SD Highest Lowest
Total -9.13% -54.22% 1.9436 1665.97% -99.73%
Out of business -77.56% -86.77% 0.2768 14.29% -99.73%
Relist 38.89% -12.73% 1.0190 248.80% -75.86%
Acquired 147.91% -5.48% 4.5514 1565.97% -94.05% Still operating -30.52% -49.51% 0.6935 165.69% -98.78%
Exhibit 2. Stock return of delisted companies
On average, the stock return of companies that are out of business is the lowest among the four because their business model was not successful. Moreover, companies that relist themselves in Chinese stock exchanges (including Hong Kong) or get acquired by private equities has already shown positive return before delisting on average. This can be regarded as a sign for chasing higher valuation and benefiting from fast-growing capital markets in Asia.
4.1 Short Selling Crisis Due to Financial Fraud
Poor stock return is one of the main reasons for companies that are out of business after delisting [29]. The stock returns of these companies are very
disappointing with 20 out of 26 companies that delisted from the US because of poor business lost over 75% of stock price. Only two of them have a positive stock return.
20
Figure 2. Stock return of companies (out of business)
Another reason is financial fraud. In 2010, a series of financial frauds occurred some China concept stocks, which in turn led to investors’ distrust of the China concept stocks market accompanied by large scale selling. This short-selling wave greatly undermined investors’ confidence. Many overseas
investors have worries about the financial problems of Chi nese companies. The success of short-selling institutions further confirmed investors’ worries. From July 2010 to November 2011, 8 companies were suspended from trading by SEC and finally delisted.
Although the US has a strict regulatory system and the Sarbanes -Oxley Act to fight against financial fraud, the Public Company Accounting Oversight Board (PCAOB) cannot investigate the audit draft and financial statements of Chinese companies due to the lack of cooperation between the Chinese and US
securities regulatory authorities. To make matters worse, the special VIE structure allowed those companies to avoid supervision of the China Securities Regulatory Commission.
21
4.2 Chinese Bull Stock Market since 2015
At the beginning of 2015, the Chinese Growth Enterprises Market Board (GEM) entered a bull market. Focus Media (NASDAQ: FMCN) launched an IPO in 2005 and delisted through privatization in 2013. It relisted in China at the end of 2015 with a market value of $6.5 billion, 1.75 times the delisting market value from NASDAQ. The value difference between US NASDAQ and Chinese GEM motivated PE funds to seize the opportunity to re-list Chinese concept stocks that they had taken private. Most companies were in information technology, healthcare and optional consumer industries, including Qihoo 360 (NYSE: QIHU), Focus Media (NASDAQ: FMCN), Mindray Medical (NYSE: MR), WuXi PharmaTech (NYSE: WX), and Giant Interactive (NYSE: GA). Exhibit 3 provides a list of all China concept stocks that have relisted domestically.
TIC Relist stock Delist date Delist MV Relist date Relist MV Multiples
FMCN 002027.cn 05/24/2013 3.7 12/29/2015 6.5 1.75x ADY 06186.hk 06/28/2013 0.15 11/13/2019 0.85 5.67x GA 002558.cn 07/21/2014 3.0 06/09/2017 1.9 0.62x WRD 002624.cn 07/26/2015 1.0 03/31/2015 1.7 1.71x CMGE 00302.hk 08/11/2015 0.74 10/31/2019 0.19 0.25x GAME 002602.cn 11/19/2015 1.9 02/20/2019 4.3 2.26x WX 603259.cn 12/11/2015 3.3 05/08/2018 4.6 1.40x VIMC 600770.cn 12/21/2015 0.45 05/04/2016 1.44 3.20x MR 300760.cn 09/26/2016 3.3 10/16/2018 12.2 3.70x QIHU 601360.cn 07/18/2016 9.3 02/28/2018 7.20 0.77x EJ 02048.hk 08/15/2016 0.94 07/14/2018 0.60 0.63x DSKY 01119.hk 09/08/2016 0.59 11/29/2018 0.12 0.20x JASO 002459.cn 07/17/2018 0.35 09/29/2019 1.01 2.88x XUE 000526.cn 06/06/2016 0.35 07/13/2016 0.32 0.91x Exhibit 3. Relisting stock performance
There are two main reasons for going back to China. On the one hand, these companies are well-known in China and are warmly welcomed by Chinese investors. On the other hand, the quality of these companies is significantly
22
higher than that of A-share and GEM competitors so that they can obtain higher valuations and premiums. As shown in Exhibit 3, the average company
increased its value by 1.9 times between delisting in the US and relisting in China.
No. TIC Delist P/E Relist P/E Multiples
1 FMCN 15.3 46.1 3.0x 2 ADY 7.3 17.4 2.4x 3 GA 14.0 37.5 2.7x 4 PWRD 14.1 38.1 2.7x 5 CMGE 14 21.6 1.5x 6 GAME 13 23.3 1.8x 7 WX 38.4 82.3 2.1 8 VIMC NA NA NA 9 MR 18.8 47.2 2.5x 10 QIHU 20 26.7 1.3x 11 EJ 13 11.7 0.9x 12 DSKY 14 14.6 1.0x 13 JASO 7.8 12 1.5x 14 XUE NA NA NA
Exhibit 4. P/E ratio increase of relisting stocks
Exhibit 4 describes the change in P/E ratio for relisting companies. Like the change in market capitalization, nearly all relisted China concept stocks
obtained a higher P/E ratio at relisting versus when they were delisted. It would appear that the sub-set of China concept stocks that have successful relisted domestically have obtained higher premiums in the stock market.
4.3 Other Motivations for Delisting
The motivation for a company to delist is complex and multifaceted. Although some China concept stocks were delisted by regulators, most of the delisted companies have chosen to privatize after listing because of strategic change and arbitrage opportunities. Factors to consider not already discussed are the
23
macroeconomic environment, financing efficiency, information costs, business operations as well as company strategy.
4.3.1 Under Valuation Due to Insufficient Information
It may be difficult for the investors in the US capital market to recognize the value of China concept stocks. There is a gap between business performance and valuation because the stocks are traded in the US but the businesses are operated in China. Since investors may be less familiar Chinese concept stocks, trading volume may be low, leading to depressed stock prices. For example, the ADR transaction volume of Sino-chip (NYSE: SMI) continued to decline after its listing, and it ultimately delisted. Maintenance and listing costs provide another incentive for companies to delist.
4.3.2 Management Buyout
The “horizon problem” arises from the inconsistency of interests between management and shareholders since many investors only pay attention to short-term profit. If the short-short-term goal cannot be achieved, they will “vote with their feet” to directly sell stocks. However, companies stand at the height of long-term development and need to carry out strategic reorganizations, which may come at the expense of short-term benefits. After corporate control is concentrated by management buyouts, the management team can do whatever creates the most value for the corporation without considering the short -term profit treasured by external investors. In the long run, the benefits can outweigh the disadvantages. For example, Shanda Games (NASDAQ: GAME) made a large number of mergers and acquisitions after listing in 2009 to try to fuel growth, but the acquisitions proved to be costly, leading to a stock price decline. Ultimately, management chose to privatize the company in 2015.
24
4.3.3 Sino-US Trade Friction and Restriction
According to Reuters, the Trump administration considered in September 2019 delisting Chinese companies listed on the US stock market. The Trump
administration believed that these companies that operate businesses mainly in China are not subject to the same supervision of domestic companies by the SEC. Politicians have also complained about the lack of access to working papers from the audits of Chinese companies. Reuters also points out that US lawmakers from both parties introduced a bill early in June 2019 to force Chinese companies listed on US stock exchanges to submit to regulatory oversight, including providing access to audits, or face delisting. Although it was not clear how any delisting would work, this news caused Chinese stock to evaporate $43.6 billion in market value on September 29, 2019, equivalent to the market value of JD.com (NASDAQ: JD).
IPO bankers expect there will now be a pause in new Chinese listi ngs in the US as companies, advisers, and investors wait for more clarity. Chinese companies are also considering ways to face this potential delisting risk. Besides Alibaba (NYSE: BABA), which has completed a secondary listing in Hong Kong in 2018, JD.com (NASDAQ: JD), Baidu (NASDAQ: BIDU), and Trip.com (NYSE: TCOM) have also launched plans to list in Hong Kong as an alternative.
I have discussed several reasons why China concept stocks delisted in recent years. With the continuous improvement of the Chinese securities markets, I would expect to see more and more Chinese companies preferring to choose to list domestically. I will next describe some of the delisted companies in my sample to see what conditions may have most affected their delisting choi ce.
25
5. Case Studies on China Concept Stocks
These three Chinese companies all had difficulty finding efficient ways to finance their fast-growing businesses. After successful IPOs in the US, however, they had different reasons for delisting from the market .
5.1 Case Study——Shenzhen Mindray
Mindray is a developer, manufacturer, and seller of medical devices globally. It has three segments, namely Patient Monitoring and Life Support products, In -Vitro Diagnostic products, and Medical Imaging Systems. The company was established in 1991. In 2006, it was successfully listed on the NYSE. Mindray stock reached its highest value in 2007, at $45.19 a share.
Mindray used the raised money in its US IPO to expand production and acquire other companies. In 2013, Mindray announced that it had reached an agreement to acquire ZONARE Medical Corporation for $105 million. In 2008, Mindray bought US medical device company Datascope for $209 million .
The company reported total revenues of $1.2 billion in 2013, reflecting year-over-year growth of around 14.5%. Revenues from China accounted for 45.4% of the company’s total revenues while international operations comprised 54.6% of total revenues.
In June 2015, with Qihoo 360 (NYSE: QIHU) and Wuxi Pharma (NYSE: WX) launching privatizations, Mindray announced that three co-founders, Li Xiting, Xu Hang, and Cheng Minghe, as a buyer group. The group submitted a
management buyout (MBO) offer to the board of directors. It is unique there was no private equity fund in the buyer group, and the funding sources of MBO were mainly from bank loans. Mindray filed to delist from the US in 2016 at a
26 market value of $3.3 billion.
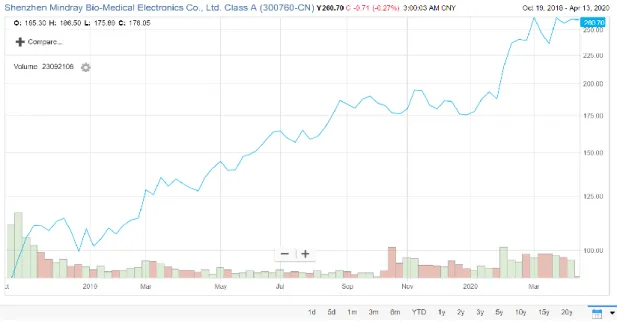
After three years of preparation, on the morning of October 16, 2018, Mindray was listed on the GEM with an issue price of 48.80 RMB per share and a total raised capital of 5.93 billion RMB, the largest IPO in the history of GEM. In June 2019, Mindray Medical’s market value was close to 200 billion RMB. As of 2020, the stock price was at the record high because of the huge demand for medical products domestically and globally.
Figure 3. Stock price trend (300760.SZ10/19/18-04/13/20) source: FactSet Compared with the market value of $3.3 billion at the time of delisting, the market value increased by 3.7 times in three years. As of 2020, Mindray is the largest medical device manufacturer in China in terms of revenue, 44% of which comes from overseas and 56% comes from the domestic market. Mindray also owns an extensive sales network in over 190 countries and regions. Investment in R&D and expanding pipelines have allowed the
company to beat analyst expectations. The key financial figures of Mindray in the past five years are presented in Exhibit 5.
27
Exhibit 5. Financial performance of Mindray (in 000 dollar) Source: FactSet Mindray has significantly increased the company’s market value despite delisting from the NYSE. Mindray was able to find an alternative source of capital by relisting in the Chinese market. As a result, Mindray has
continuously built up the company’s fame and cash flow, generating healthy returns for investors.
5.2 Case Study——United Family Healthcare
United Family Hospital (UFH) was the first international standard hospital established in China [30]. It was founded by a joint venture between Chindex International, Inc (CHDX) and the Chinese Academy of Medical Sciences. Chindex was founded in 1981 and listed on the NASDAQ in 1993.
Launched in 1997, UFH Beijing imported equipment, built modern facilities, and brought in many aspects of international standard healthcare, such as a philosophy of patient-centered care, a service mentality, systems management, and quality control. As a result, UFH is a first-class Chinese hospital with an international standard and comparable quality to the best healthcare providers in the US and Europe. From 2006, Chindex started to transfer the company to
28
the operator of private hospital brand (UFH). By the end of 2013, UFH had 4 hospitals in Beijing, Shanghai, Tianjin and Guangzhou. From 1997 to 2013, UFH developed into a well-known brand of China’s first-class private hospital providing service for foreign customers in China.
Before being acquired, UFH is growing very fast. In FY2006, medical service revenue was only $36.5 million. In FY2013, medical service revenue increased to $179 million, achieving a compound annual growth rate of 2 6%. However, the profit margin of UFH was extremely low because of high employee compensation, high depreciation of equipment, and high advertising expense. The key financial figures of UFH between 2011 and 2013 are presented in Exhibit 6.
Exhibit 6. Financial performance of UFH (in 000 dollar) Source: Wind
In February 2014, two large private equity firms, Fosun Industial and TPG, jointly launched a privatization offer for Chindex, the parent company of UFH. Fosun Industrial and TPG set up a merger and acquisition fund Healthy Harmony Holdings L.P. (HHH) to acquire Chindex. Fosun Industrial planned to acquire all
29
the outstanding shares of Chindex at a price of $19.5 per share, with a premium of 13.70%. The management team of Chindex agreed to privatization because Fosun’s key resources and healthcare channel were conducive to the development of UFH in China.
After the privatization offer from Fosun and TPG was made public, Chindex received a higher priced offer from another investor. As a result, HHH raised the offer price to $24 per share. In the formal privatization transaction, Chindex was valued at $438 million, the EV / EBITDA multiple was approximately 30 times. In September 2014, Chindex was delisted from the NASDAQ.
After privatization, HHH started to cut off UFH’s capital expenditures and increased the revenue and profit margin in terms of hospitals and hospital beds. After four years, UFH owned 9 hospitals and 274 beds, and operating income increased to $302 million, with a 4-year CAGR of 14%. Average revenue per bed was $1.10 million per year, the revenue per bed in UFH Beijing reached a staggering level of $1.88 million per year, approximately 10 times more than industry average [31] [32].
Due to profitability and its strong brand, UFH was sold in 2019 to a special purpose acquisition company listed on the NYSE, and Fosun agreed to exit. In this transaction, Fosun received a total return of $523 million. Considering that the cost of acquiring UFH was approximately $219 million, Forsun had a successful exit after four years with an annualized rate of return of 20%.
5.3 Case Study——Luckin Coffee
Luckin coffee (NASDAQ: LK) was founded in Beijing in 2017 and has since grown to more than 4,500 stores at the end of 2019. The coffee chain takes the
30
cashier-customer interaction out of the equation by handling the entire purchase process through its apps. More than 90 percent of its units are pick-up stores around office buildings and universities to target its millennial customer base. Luckin coffee went public in May 2019, only two years after establishment, raising roughly $571 million in the IPO. The stock price of Luckin has been gradually rising after listing, and the financial reports of 2019Q2&Q3 implicated a strong trend of revenue growth and improving profit margin. Although profitability had not yet been achieved, Luckin received widespread investment interest in the US capital market.
However, in January 2020, Muddy Waters claimed that they had received an anonymous report about Luckin. The report worked with 92 full-time and 1,418 part-time staff to run surveillance and record traffic in 620 stores, alleging Luckin manufactured an astonishing fraud by fabricating financial and operating numbers starting in 2019Q3, just after its IPO. The report also said that the company attempted to instill the culture of drinking coffee into Chinese consumers through huge discounts and free giveaways, but it is unfeasible in reality, only to attract opportunist customers without brand loyalty. The authors also attacked Luckin’s business model, stating the company’s goal to target “core functional coffee demand” is misguided because China's caffeine intake of 86 mg / day per capita is already similar to other Asian countries, with 95 percent of the intake from tea.
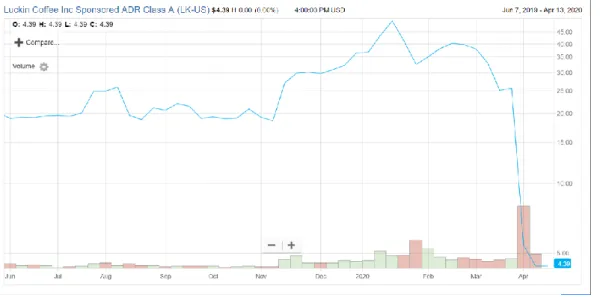
Despite the fact that this report is detailed and comprehensive, Luckin’s stock price recovered within a month after experiencing a 25% decline. Suddenly, on April 2, 2020, Luckin reported to the SEC that it had discovered financial fraud, mainly coming from the COO and his colleagues. The amount of
31
financial fraud was reported to be as high as 2.2 billion RMB, accounting for 75% of Luckin’s total revenue in the first three quarters of 2019. In other
words, Luckin’s quarterly financial reports were no longer credible. The market was shocked, and the stock price fell by 80% in one day with five trading halts. Figure 4 shows the stock price of Luckin.
Figure 4. Stock price trend of Luckin (06/07/19-04/13/20) Source: FactSet
The final outcome of the matter has not yet been determined, but this scandal once again supports Wall Street’s judgment about the dubious financial reporting of China concept stocks that occurred during the 2010 short selling crisis. The CEO of JD.com criticized Luckin’s financial fraud in one interview. The short selling trend of China concept stocks like 2010 may appear again, and the fate of Chinese concept stocks has become uncertain as well.
6. Conclusions
This paper reviews the performance of China concept stocks listed in the United States and discovers a high rate of delisting. By viewing two major waves of delisting, I propose several reasons for the possible delisting
32 the most likely delisting motives.
Financial fraud was also a factor in delisting. Although most China concept stocks were able to comply with US securities regulations and financial disclosures, the financial fraud of certain companies caused immense
reputation damage and forced many Chinese companies cross-listed in the US to delist through privatization. A small number of irresponsible small and medium-sized companies listed through reverse merger methods and used the loopholes in the audit coordination process between China and the US,
resulting in great harm to foreign investors.
On the bright side, with the continuous improvement of China’s capital market in the past 20 years, more and more Chinese companies have chosen to list and raise capital domestically. For this reason, my opinion is that the phenomenon of Chinese stocks going public to the US will be diminish in the future.
However, it is worth reminding the CSRC that it must fully learn the lessons of Luckin Coffee in implementing the stock registration system as well as using a stricter regulation and financial audit system in order to prevent financial fraud in advance.
Acknowledgements
The author of the paper wants to thank Professor Christopher Noe for his comments and instructions and librarian Shikha Sharma for her help in searching data in MIT Dewey Library.
33
References
1. Ron Surz; U.S. Stock Market Is Biggest & Most Expensive In World, But U.S. Economy Is Not The Most Productive; APR 2, 2018
2. Statistical Abstract of the US 2020; Table 1226, Page 760
3. Source: Standard and Poor's; https://ycharts.com/indicators/sp_500_pe_ratio 4. Giselda Ribeiro; Emerging Markets Equity Valuations; Siblis Research https://siblisresearch.com/data/emerging-markets-valuations/
5.Steve Gelsi; Baidu.com more than triples; Aug 5, 2005
https://www.marketwatch.com/story/baidu-ipo-jumps-354-into-the-record-books 6. William alden; Alibaba’s Shares Close Up 38% on First Day of Trading; New York Times Sep. 19,2014; https://dealbook.nytimes.com/2014/09/19/live-blog-tracking-the-giant-alibaba-i-p-o/
7. Jennifer N. Carpenter Fangzhou Lu Robert F. Whitelaw; THE REAL VALUE OF CHINA'S STOCK MARKET; NBER WORKING PAPER SERIES: 2057
8. Charels Mcgrath; 80% of equity market cap held by institutions; Pensions and Investments April 25, 2017;
https://www.pionline.com/article/20170425/INTERACTIVE/170429926/80-of-equity-market-cap-held-by-institutions
9. Rodrigues, Danilo; Bartenstein, Christoph; Cai, Lijian; Chang, Henry; Tomicki, Lucas; Torns, Marc; IPOS IN CHINA: CHALLENGES AND OPPORTUNITIES FOR COMPANIES AND INVESTORS; Pensamento & Realidade;2012, Vol. 27 Issue 1, p77
10. Chen 2009; Private benefits in IPOs: evidence from state-owned firms. AFA 2009 San Francisco (SSRN)
11. Nikolas Papas; Chinese Companies Listed on U.S. Stock Exchanges;
InvestingCube Sep. 30, 2019; https://www.investingcube.com/chinese-companies-listed-on-u-s-stock-exchanges/
12. Hung, M., Wong, T.J., Zhang, T., 2008. Political relations and overseas stock exchange listing: evidence from Chinese state-owned enterprises. SSRN:
http://ssrn.com/abstract=1224162.
13. Doidge, C., Karolyi, G.A., Stulz, R., 2004. Why are foreign firms listed in the U.S. worth more? Journal Finance Economy: 71,205–238.
14. Narayanan Jayaraman, Kuldeep Shastri, Kishore Tandon; The impact of
international cross listings on risk and return: The evidence from American depository receipts; Journal of Banking and Finance 17 (1993) 91-103. North-Holland
15. Pagano, M., Roell, A.A., Zechner, J., 2002. The geography of equity listing: why do companies list abroad? Journal of Finance 57, 2651–2694.
34
16. Gompers, P., Kovner, A., Lerner, J. & Scharfstein, D. (2008), ‘Venture capital investment cycles: The impact of public markets’, Journal of Financial Economics 87(1), 1–23.
17. Will Cong, Sabrina T. Howell, and Ran Zhang; The Impact of Delay in Going Public: Evidence from China
18. Brandon Whitehill; BUYER BEWARE: CHINESE COMPANIES AND THE VIE STRUCTURE; Council of Institutional Investors
19. Cheung, Y., Jing, L., Lu, T., Rauc, P.R., Stouraitisa, A., 2009. Tunneling and propping up: an analysis of related party transactions by Chinese listed companies. Pacific-Basin Finance Journal No.17, 372–393.
20. Luo, Y., Jackson, D., 2012. Executive compensation, ownership structure and firm performance in Chinese financial corporations. Global Bus Finance Rev. 17 (1), 56– 74.
21. Yuping Wang; Motivation Analysis and Reference for Privatization of China concept stocks; F830.91 1006-7426[2013]06-0089-05
22. Bingbing Qian, Research on Causes and Solutions of Audit Failure of China concept stocks Companies. F832.51; F239.4; 2018.6
23. Yusheng Yang; Research on the Overseas Listing of VIE Mode; Advances in Social Science, Education and Humanities Research (ASSEHR), volume 181 24. Bo Deng; A Comparative Analysis of the Ways for Overseas Listed Chinese Enterprises to Return to the A-Share Market CONTEMPORARY ECONOMICS Sep.2018: 30-31
25. Xiaolong Zhao; The impact of China Depository Receipts on China A shares; Modern Marketing Sep. 2018: 200-201
26. Gao Li; The characteristics and impact analysis of the privatization and spin-off of the Chinese stock; Securities Market Herald Nov.2017:42-48
27. Source: SINA FINANCE http://vip.stock.finance.sina.com.cn/usstock/ustotal.php 28. Xinyuan Zhang, Wen Ou, Limin Chen, Jian Hu; China concept stocks: Time to go back; HUATAI SECURITIES; Jun.11, 2019
29. Yao Guo; Names of delisted Chinese stocks on the US Apr. 17, 2012; http://news.esnai.com/33/2012/0417/73150.shtml
30. Wikipedia: Beijing United Family Hospital;
https://en.wikipedia.org/wiki/Beijing_United_Family_Hospital
31. UFH: high-end medical services full of imagination. 8.4 billion, 4 times PS, 89 times EV / EBITDA; https://zhuanlan.zhihu.com/p/77250790
32. Business opportunity or a trap: behind the scenes of the UFH's trade; https://new.qq.com/omn/20190827/20190827A0CWTW00.html
35
Appendix
I. Sample of China Concept Stocks
Company Name TIC Exchange List date Industry SORL AUTO PARTS
INC
SORL NASDAQ
11/30/1983
Automobiles & Parts BONSO ELECTRONICS INTL INC BNSO NASDAQ 06/27/1989 Semiconductor Manufacturing JPMORGAN CHINA REGION FD INC JFC NYSE 07/16/1992 Financial Services CENIT BANCORP INC CNIT NASDAQ
08/06/1992 Mobile Telecommunication SINOPEC SHANGHAI PETROCHEM SHI NYSE 07/26/1993
Oil & Gas Producers Chindex International CHDX NYSE
08/18/1994 HealthCare Equipment&Service HUANENG POWER INTERNATIONAL HNP NYSE 10/06/1994 Electricity CHINA YUCHAI INTERNATIONAL CYD NYSE 12/16/1994
Oil & Gas Producers DESWELL INDUSTRIES INC DSWL NASDAQ 07/19/1995 Semiconductor Manufacturing CHINA NATURAL RESOURCES INC CHNR NASDAQ 08/07/1995 Industrial Metals &Mining AMERICAN COIN MERCHANDISING INC AMCN NASDAQ 10/16/1995 Media GUANGSHEN RAILWAY CO LTD GSH NYSE 05/13/1996 Railroads HIGHWAY HOLDINGS LTD HIHO NASDAQ 12/11/1996 Metal Fabrication CHINA EASTERN AIRLINES CORP CEA NYSE
02/04/1997 Travel & Leisure EURO TECH
HOLDINGS CO LTD
CLWT NASDAQ
03/14/1997
Pollution & Treatment Controls
ASIA PACIFIC WIRE&CABLE CORP
APWC NASDAQ
03/26/1997
Electrical Equipment & Parts
CHINA SOUTHERN AIRLINES
ZNH NYSE
07/30/1997 Travel & Leisure TAIWAN SEMICONDUCTOR MFG CO TSM NYSE 10/08/1997 Semiconductor Manufacturing CHINA MOBILE LTD CHL NYSE
10/22/1997
Mobile
Telecommunication GIGAMEDIA LTD GIGM NASDAQ 02/18/2000 Media
UTSTARCOM HOLDINGS CORP UTSI NASDAQ 03/03/2000 Mobile Telecommunication PETROCHINA CO LTD PTR NYSE 04/06/2000
Oil & Gas Producers SINA CORP SINA NASDAQ
04/13/2000 Software&Computer Service GLOBAL SOURCES LTD GSOL NASDAQ 05/01/2000 Media
36 CHINA UNICOM (HONG KONG) LTD CHU NYSE 06/21/2000 Mobile Telecommunication NETEASE INC NTES NASDAQ
06/30/2000
Software&Computer Service
SOHU COM LTD SOHU NASDAQ
07/12/2000 Software&Computer Service O2MICRO INTERNATIONAL LTD OIIM NASDAQ 08/23/2000 Semiconductor Manufacturing SILICONWARE PRECISION INDS SPIL NASDAQ 09/07/2000 Semiconductor Manufacturing UNITED MICROELECTRONIC S CORP UMC NYSE 09/19/2000 Semiconductor Manufacturing ASE TECHNOLOGY HLDNG CO ASX NYSE 10/02/2000 Semiconductor Manufacturing CHINA PETRO &
CHEMICAL CORP
SNP NYSE
10/18/2000
Oil & Gas Producers C N O O C LTD CEO NYSE 02/27/2001 Oil & Gas Producers ALUMINUM CORP CHINA LTD ACH NYSE 12/11/2001 Industrial Metals&Mining A U OPTRONICS CORP AUO NYSE 05/23/2002 Semiconductor Manufacturing CHINA TELECOM CORP LTD CHA NYSE 11/14/2002 Mobile Telecommunication CHUNGHWA TELECOM LTD CHT NYSE 07/18/2003 Mobile Telecommunication TRIP COM GROUP
LTD
TCOM NASDAQ
12/09/2003 Travel & Leisure CHINA LIFE INSURANCE (CHN) LFC NYSE 12/17/2003 Insurance SEMICONDUCTOR MANUFACT INTL COR SMI NYSE 03/17/2004 Semiconductor Manufacturing KongZhong Corp. KZ NASDAQ
07/09/2004 Mobile Telecommunication CHINA AUTOMOTIVE SYSTEMS INC CAAS NASDAQ 08/24/2004
Automobiles & Parts CHINA
AUTOMOTIVE SYSTEMS INC
CAAS NASDAQ
09/29/2004
Automobiles & Parts 51JOB INC JOBS NASDAQ 10/15/2004 Support Services CHINA FINANCE ONLINE CO LTD JRJC NASDAQ 10/28/2004 Software&Computer Service
eLong Inc. LONG NASDAQ 12/08/2004 Travel & Leisure SINOVAC BIOTECH
LTD
SVA NASDAQ
12/15/2004
Pharma. & Biotech. THE9 LTD NCTY NASDAQ
05/06/2005 Software&Computer Service CHINA TECHFAITH WIRLSS COMM TECH CNTF NASDAQ 06/30/2005 Mobile Telecommunication SILICON MOTION TECH SIMO NASDAQ 07/13/2005 Semiconductor Manufacturing
37 FOCUS MEDIA
HOLDING
FMCN NASDAQ
08/05/2005 Media BAIDU INC BIDU NASDAQ
08/09/2005
Software&Computer Service
SEASPAN CORP SSW NYSE 11/09/2005 Shipping ORIGIN AGRITECH LTD SEED NASDAQ 11/15/2005 Agricultural Inputs Vimicro International Corp. VIMC NASDAQ 03/08/2006 Semiconductor Manufacturing AMERICAN DIARY INC ADY NYSE 03/31/2006 Packaged Foods HIMAX TECHNOLOGIES INC HIMX NASDAQ 09/07/2006 Semiconductor Manufacturing NEW ORIENTAL ED & TECH EDU NYSE 09/26/2006 Education Services MINDRAY MEDICAL INTL LTD MR NYSE 10/26/2006
Pharma. & Biotech. Home Inns & Hotels
Management Inc.
HMIN NASDAQ
10/31/2006 Travel & Leisure EFUTURE HOLDING INC EFUT NASDAQ 11/09/2006 Software&Comperter Service CANADIAN SOLAR INC CSIQ NASDAQ 12/19/2006 Alternative Energy FUWEI FILMS HOLDINGS CO FFHL NASDAQ
12/19/2006 Packaging & Containers Trina Solar Co., Ltd. TSL NYSE 02/07/2007 Alternative Energy JA SOLAR
HOLDINGS CO LTD
JASO NASDAQ
04/12/2007 Alternative Energy JA Solar Holdings Co.,
Ltd. JASO NASDAQ 04/20/2007 Alternative Energy SYNUTRA INTERNATIONAL INC SYUT NASDAQ 05/03/2007 Packaged Foods Simcere Pharmarceutical Group SCR NYSE
06/08/2007 Pharma. & Biotech. ACORN INTERNATIONAL INC ATV NYSE 06/27/2007 General Retailers YINGLI GREEN ENERGY HLDG CO LTD YGE NYSE 07/26/2007 Alternative Energy Spreadtrum Communications Inc SPRD NASDAQ 08/08/2007 Semiconductor Manufacturing Perfect World Co.,Ltd. PWRD NASDAQ
08/09/2007
Electronic Gaming & Multimedia
E-house(China) Holdings, Ltd.
EJ NYSE
08/09/2007
Real Estate Inv&Serv WONDER AUTO
TECHNOLOGY INC
WATG NASDAQ
08/29/2007 Automobiles & Parts WuXi
PharmaTech(Cayman) Inc
WX NYSE
09/28/2007
Pharma. & Biotech. AGFEED
INDUSTRIES INC
FEED NASDAQ
10/05/2007
Agricultural Inputs CHINA CGAME INC CCGM NASDAQ
10/09/2007
Electronic Gaming & Multimedia
38 CHINA DIGITAL TV HOLDING CO LTD STV NYSE 10/29/2007 Electronic&Electric Equipment ADVANCED
BATTERY TECH INC
ABAT NASDAQ
11/01/2007
Electrical Equipment & Parts CHINACAST EDUCATION CORP CAST NASDAQ 11/07/2007 Education Services Giant Interact Group
Inc.
GA NYSE
11/09/2007
Electronic Gaming & Multimedia AIRNET TECHNOLOGY INC ANTE NASDAQ 12/06/2007 Media China Nepstar Chain
Drugstore Ltd. NPD NYSE 12/11/2007 HealthCare Equipment&Service VISIONCHINA MEDIA INC VISN NASDAQ 12/12/2007 Media
ChinaEdu Corporation CEDU NYSE 12/17/2007 Education Services XINYUAN REAL
ESTATE CO
XIN NYSE
12/27/2007 Real Estate Service CHINA CERAMICS
CO LTD
CCCL NASDAQ
01/22/2008
Building Products & Equipment
Zhongpin Inc HOGS NASDAQ 01/29/2008 Packaged Foods A-POWER ENERGY
GENERATN SYS
APWR NASDAQ
01/29/2008
Electrical Equipment & Parts
RENESOLA LTD SOL NYSE 03/18/2008 Alternative Energy A T A CREATIVITY GLOBAL AACG NASDAQ 05/21/2008 General Retailers KANDI TECHNOLOGIES GROUP KNDI NASDAQ 06/19/2008
Automobiles & Parts SINO-GLOBAL SHIPPING AMERICA SINO NASDAQ 07/18/2008 Shipping HIGHPOWER INTERNATIONAL INC HPJ NASDAQ 07/30/2008
Electrical Equipment & Parts
WUHAN GENERAL GROUP INC
WUHN NASDAQ
07/30/2008 Pharma. & Biotech. CHINA DISTANCE EDUCATION DL NYSE 08/01/2008 Education Services CHINA CABLECOM HOLDINGS LTD CABL NASDAQ 08/12/2008
Electrical Equipment & Parts HOLLYSYS AUTOMATION TECH LTD HOLI NASDAQ 10/23/2008
Electrical Equipment & Parts CHINA INFRASTRUCTURE INVT CORP CIIC NASDAQ 03/09/2009 Infrastructure CHINA-BIOTICS INC CHBT NASDAQ 04/02/2009 Pharma. & Biotech. CHINA GREEN AGRICULTURE INC CGA NYSE 07/30/2009 Agricultural Inputs CHANGYOU.COM LTD CYOU NASDAQ 08/03/2009 Software&Computer Service RECON TECHNOLOGY LTD RCON NASDAQ
09/25/2009 Oil & Gas Producers CHINA RITAR
POWER CORP
CRTP NASDAQ
10/27/2009
Electrical Equipment & Parts
Shanda Games Ltd GAME NASDAQ
11/02/2009
Electronic Gaming & Multimedia
39 GULF RESOURCES INC GURE NASDAQ 11/03/2009 Chemical Products CHINA ADVANCED
CONST MAT GRP INC
CADC NASDAQ 11/19/2009 Building Materials SEARCHMEDIA HOLDINGS LTD DID NASDAQ 11/20/2009 Media GLOBAL CORD BLOOD CORP CO NYSE
11/27/2009 Pharma. & Biotech. 7 Days Group Holdings
Limited
SVN NYSE
12/02/2009 Travel & Leisure CHINA XD PLASTICS CO LTD CXDC NASDAQ 12/11/2009 Chemical Products CHINA BIOLOGIC PRODUCTS HLDG CBPO NASDAQ 01/29/2010
Pharma. & Biotech. CONCORD MEDICAL
SVCS
CCM NYSE
03/04/2010 Pharma. & Biotech. CHINA ELECTRIC
MOTOR INC
CELM NASDAQ
03/22/2010
Electrical Equipment & Parts CHINANET ONLINE HOLDINGS CNET NASDAQ 03/26/2010 Mobile Telecommunication CHINA RECYCLING ENERGY CORP CREG NASDAQ 04/22/2010 Waste Management HUAZHU GROUP LIMITED HTHT NASDAQ 04/23/2010
Travel & Leisure CHINA JO-JO DRUGSTORES INC CJJD NASDAQ 05/14/2010 Health Care Equipment&Service BIOSTAR PHARMACEUTICALS INC BSPM NASDAQ 05/14/2010
Pharma. & Biotech. JINKOSOLAR HOLDING CO JKS NYSE 06/11/2010 Alternative Energy KINGTONE WIRELESSINFO SLTN HLDG KONE NASDAQ 06/14/2010 Wireless Telecommunications CHINA NEW BORUN
CORP BORN NYSE 08/17/2010 Agricultural Inputs SINO CLEAN ENERGY INC SCEI NASDAQ 08/18/2010 Alternative Energy Ku6.com Inc KUTV NASDAQ
09/13/2010
Internet Content & Information KINGOLD JEWELRY INC KGJI NASDAQ 09/15/2010 Luxury Goods CHINA HGS REAL ESTATE INC HGSH NASDAQ 09/17/2010
Real Estate Inv&Serv KEYUAN
PETROCHEMICALS INC
KEYP NASDAQ
10/01/2010
Oil & Gas Producers FANG HOLDINGS LTD SFUN NYSE 10/04/2010 Software&Computer Service CHINACACHE INTL HLDGS LTD CCIH NASDAQ 10/07/2010 Software&Computer Service N F ENERGY SAVING CORP NFEC NASDAQ 10/26/2010 Alternative Energy DAQO NEW ENERGY
CORP
DQ NYSE
11/02/2010
Alternative Energy MECOX LANE LTD MCOX NASDAQ 11/10/2010 General Retailers Xueda Education Group XUE NYSE 11/17/2010 Education Services
40 NOAH HOLDINGS LTD NOAH NYSE 11/23/2010 Financial Services BITAUTO HOLDINGS LTD BITA NYSE
12/08/2010 Automobiles & Parts CHINA XINIYA FASHION LTD XNY NYSE 12/08/2010 Personal Goods E-Commerce China Dangdang Inc. DANG NYSE 12/09/2010 General Retailers Youku.com Inc YOKU NYSE
12/09/2010
Internet Content & Information SEMILEDS CORP LEDS NASDAQ
12/10/2010
Semiconductor Manufacturing Bona Film Group
Limited
BONA NASDAQ
12/20/2010
Entertainment Sky-mobi Limited MOBI NASDAQ
12/21/2010
Software&Computer Service
SGOCO GROUP LTD SGOC NASDAQ 03/30/2011 General Retailers OSSEN INNOVATION CO LTD OSN NASDAQ 04/21/2011 Indust.Metals&Mining Qihoo 360 Technology Co.,Ltd. QIHU NYSE 05/04/2011 Software&Computer Service 21VIANET GROUP INC VNET NASDAQ 05/05/2011 Software&Computer Service
RENREN INC RENN NYSE
05/11/2011
Software&Computer Service
N Q MOBILE INC NQ NYSE
05/12/2011 Software&Computer Service Jiayuan.com International Ltd. DATE NASDAQ 05/12/2011 Software&Computer Service PHOENIX NEW MEDIA LTD FENG NYSE 06/09/2011 Media CHINA ZENIX AUTO
INTL LTD
ZX NYSE
08/17/2011 Automobiles & Parts Taomee Holdings, Ltd. TAOM NYSE 03/23/2012 General Retailers Tudou Holdings
Limited
TUDO NASDAQ
09/25/2012
Internet Content & Information VIPSHOP HOLDINGS LTD VIPS NYSE 11/21/2012 General Retailers China Mobile Games
and Entertainment Group
CMGE NASDAQ
02/26/2013
Electronic Gaming & Multimedia
JOYY INC YY NASDAQ
06/06/2013 Software&Computer Service PINGTAN MARINE ENTERPRISE PME NASDAQ 08/13/2013 Packaged Foods LIGHTINTHEBOX HLDG LITB NYSE 10/31/2013 General Retailers CHINA COMMERCIAL CREDIT INC CCCR NASDAQ 11/22/2013 Financial Services 58.COM INC WUBA NYSE
11/22/2013
Software&Computer Service
500.COM LTD WBAI NYSE 12/11/2013 Leisure Goods Sungy Mobile Limited GOMO NYSE
12/18/2013
Software&Computer Service
![Figure 1. Number of listing stocks (From 1992 to 2019) [28]](https://thumb-eu.123doks.com/thumbv2/123doknet/14203529.480447/13.892.139.743.139.469/figure-number-listing-stocks.webp)