READ THESE TERMS AND CONDITIONS CAREFULLY BEFORE USING THIS WEBSITE.
https://nrc-publications.canada.ca/eng/copyright
Vous avez des questions? Nous pouvons vous aider. Pour communiquer directement avec un auteur, consultez la première page de la revue dans laquelle son article a été publié afin de trouver ses coordonnées. Si vous n’arrivez pas à les repérer, communiquez avec nous à PublicationsArchive-ArchivesPublications@nrc-cnrc.gc.ca.
Questions? Contact the NRC Publications Archive team at
PublicationsArchive-ArchivesPublications@nrc-cnrc.gc.ca. If you wish to email the authors directly, please see the first page of the publication for their contact information.
NRC Publications Archive
Archives des publications du CNRC
This publication could be one of several versions: author’s original, accepted manuscript or the publisher’s version. / La version de cette publication peut être l’une des suivantes : la version prépublication de l’auteur, la version acceptée du manuscrit ou la version de l’éditeur.
Access and use of this website and the material on it are subject to the Terms and Conditions set forth at
Deriving acceptable values for party wall sound insulation from survey results
Bradley, J. S.
https://publications-cnrc.canada.ca/fra/droits
L’accès à ce site Web et l’utilisation de son contenu sont assujettis aux conditions présentées dans le site
LISEZ CES CONDITIONS ATTENTIVEMENT AVANT D’UTILISER CE SITE WEB.
NRC Publications Record / Notice d'Archives des publications de CNRC:
https://nrc-publications.canada.ca/eng/view/object/?id=f0eb80ec-384a-4b5d-831c-9dec7d3fe2c0 https://publications-cnrc.canada.ca/fra/voir/objet/?id=f0eb80ec-384a-4b5d-831c-9dec7d3fe2c0
Deriving acceptable values for party wall sound insulation from survey results
Bradley, J.S.
A version of this paper is published in / Une version de ce document se trouve dans: Inter-Noise 2001, The Hague, Netherlands, August 27-30, 2001, p. 1-6
www.nrc.ca/irc/ircpubs
The 2001 International Congress and Exhibition on Noise Control Engineering
The Hague, The Netherlands, 2001 August 27-30
Deriving Acceptable Values for Party Wall Sound Insulation
from Survey Results
J.S. Bradley
Institute for Research in Construction, National Research Council, Montreal Rd., Ottawa, Canada, K1A 0R6
Abstract
Acceptable values for party wall sound insulation were derived from the grouped subjective ratings obtained from a field survey of 600 subjects and the airborne sound insulation of their 300 party walls. The subjects lived in both row housing and multi-floor apartment buildings in three different Canadian cities and included both owners and renters. The survey results clearly demonstrate that residents are influenced by the amount of sound insulation between them and their neighbour and that the effects are largely independent of the type of housing or type of tenure. Spontaneous responses show increasing negative ratings of their buildings with decreasing sound insulation. Residents with poor sound insulation are more likely to want to move, to be awakened by noises and to have trouble falling asleep due to noises, as well as to think that their neighbours are less considerate. Directly elicited responses are used to determine STC 55 as a realistic goal for acceptable sound insulation and STC 60 as a more ideal goal that would practically eliminate negative effects of neighbour’s noises.
1. Introduction
The present results were obtained from a field survey of the sound insulation of walls separating multiple unit housing in 3 Canadian cities. The survey included extensive face-to-face interviews in subjects’ homes as well as complete sound transmission loss measurements of party walls between homes and ambient noise measurements in each home over a complete 24 hour period. To focus on the average community response, only aggregate data for groups with similar sound insulation ratings are considered in this paper.
A total of 600 subjects were interviewed in 300 pairs of homes. Homes were equally distributed among the combinations of owners and renters, two housing types and three cities. The two housing types were row housing (homes adjacent side by side) and apartments (i.e. homes adjacent up and down as well as side by side). The three cities, Toronto, Montreal and Vancouver have different climates and differences in construction styles. Subjects were first approached by letter asking them to participate in a building satisfaction survey and were subsequently interviewed in their homes. Initial questions obtained spontaneous responses
without any mention of sound insulation or noise. These included ratings of the satisfaction with their building, whether they would like to move and how considerate their neighbours were. Subsequent questions obtained directly elicited responses concerning whether they heard various sounds and how annoying they were. For most survey questions, responses were obtained using 7-point response scales. The survey procedure was essentially the same as that found to be successful in a smaller pilot study [1,2].
In this paper only the STC sound insulation ratings of the walls will be presented. The 300 common walls had apparent STC ratings (i.e. including possible flanking paths) varying from 38 to 60 with a mean of 49.8. Data were aggregated into 8 groups by apparent STC rating.
2. The importance of sound insulation
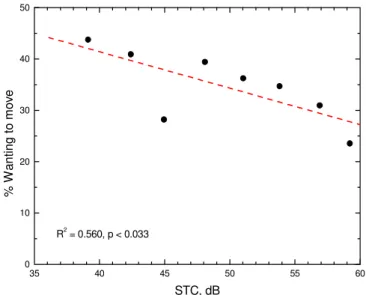
Direct questions about noise or sound insulation can potentially bias results by sensitizing subjects to the importance of sound insulation between homes. The initial questions were intended to avoid this problem by obtaining spontaneous responses related to the importance of sound insulation. When subjects were asked if they would like to move from their present home, the percentage saying yes was significantly related to the measured STC of their party wall. As Figure 1 shows, the percentage wanting to move decreased significantly for higher STC values. Of the people saying they would like to move in each of the 8 STC groups, 94 to 100 % of them gave a noise related reason. That is, sound insulation seems to be a major cause of people wanting to move and noise problems appear to be an almost ubiquitous reason for wanting to move.
When subjects were asked how satisfied they were with the building in which they lived, the responses were significantly related to measured STC values (see Table I) and subjects with better sound insulation were more satisfied with their building. Even though there was no mention of noise or sound insulation, there was again evidence of the importance of the sound insulation between homes to the residents.
Subjects’ responses concerning how considerate their neighbours were, were also significantly related to measured STC values. That is, subjects with lower sound insulation tended to blame their neighbours as being less considerate. Poor sound insulation between homes is thus seen to be a potential cause of social disruption.
35 40 45 50 55 60 0 10 20 30 40 50 R2 = 0.560, p < 0.033 % W anting to m o v e STC, dB
When asked how often they were awakened by noises from neighbours in their building, their responses were again significantly related to measured STC values (See Table I). Thus the quality of residents sleep is related to the amount of sound insulation between their homes.
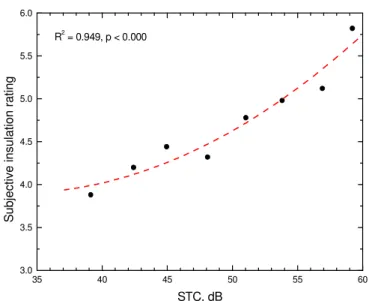
When subjects were asked to rate the sound insulation between them and their neighbours, their responses were significantly related to measured STC values as shown in Figure 2. There seems no doubt that subjects are aware of the quality of the sound insulation, it is important to them, and it affects their quality of life.
3. Goals for better sound insulation
The questionnaire included many items that asked directly how often they heard specific sounds and how annoying they were considered to be. The more important items concerned: sounds from neighbours either side, sounds of neighbour’s voices, sounds of neighbour’s radios and televisions, and music related sounds from their neighbours. Other questions concerned more specific sources of noise that were not always present in all types of buildings. A factor analysis of the responses simply suggested that each pair of responses concerning hearing and being annoyed by a particular type of sound were related. Thus in the following analyses the averages of each pair of responses is considered.
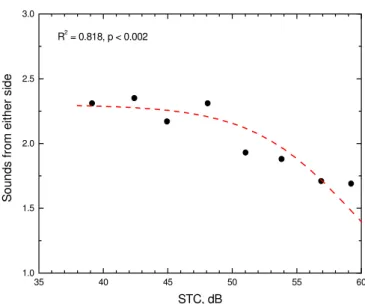
Figure 3 plots the averages of responses concerning questions asking about sounds from their neighbours either side of them. These averages included responses to questions asking how often they heard these noises and how annoying they were, as well as the responses to two other questions asking how annoying these sounds were at different times of day.
35 40 45 50 55 60 3.0 3.5 4.0 4.5 5.0 5.5 6.0 R2 = 0.949, p < 0.000 S ubj ective insulation rating STC, dB
Figure 2. Subjective ratings of sound insulation versus STC.
Response R2 p
Percentage wanting to move. 0.560 0.033
How satisfied with your building? 0.832 0.002
How considerate are your neighbours? 0.857 0.001
How often awakened due to noise from neighbours? 0.602 0.024
Subjective rating of sound insulation. 0.921 0.000
Table I. Summary of relationships with measured STC values. (R2 is coefficient of determination, p is probability of the result occurring by chance).
Figure 4 shows similar average responses versus measured STC values for questions concerning how often they heard and how annoying were sounds of their neighbours’ voices. Both of these and subsequent plots show similar patterns. For lower STC values, the responses do not vary with STC but for higher STC values the responses systematically decrease with increasing STC. Disturbance from neighbour’s noises depends, not only on the amount of sound insulation, but also on how noisy their neighbours are and how frequently they make noise. For lower STC values, the sound insulation was not very effective and the average frequency of hearing neighbours simply depends on how often the neighbours are noisy. It is only above about STC 50 that these responses decrease systematically with increasing sound insulation. Therefore sound insulation of greater than STC 50 is required to decrease the disturbance of these noises.
Figure 5 plots the average responses concerning noises from neighbour’s radios and televisions. These results also follow the same form as the previous two examples except that the point at which the sound insulation seems to start becoming effective corresponds to a slightly higher STC value.
35 40 45 50 55 60 1.0 1.5 2.0 2.5 3.0 R2 = 0.818, p < 0.002 S o un ds f rom ei th er s id e STC, dB
Figure 3. Average responses concerning sounds from neighbours either side versus STC.
35 40 45 50 55 60 1.0 1.5 2.0 2.5 3.0 R2 = 0.944, p < 0.000 Sound s o f neig hbou rs ' v o ic es STC, dB
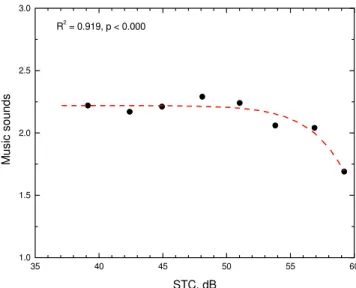
The average responses concerning music related sounds from the neighbours are plotted in Figure 6. For music sounds, the point at which sound insulation starts becoming effective is increased to approximately STC 55. Figure 6 suggest that more sound insulation is required to protect residents from music related sounds than from other types of sounds.
Figure 7 compares the curves that were fitted to each set of average responses. They were all
sigmoidal fits based on a Boltzman equation. The R2 values on each plot varied from 0.772 to
0.944 and indicate the goodness of fit between the data points and these regression curves. In all cases the agreement is statistically significant (p <0.004 or better).
If one compares the point at which each curve starts decreasing with increasing STC value, one can estimate where sound insulation starts influencing subjects’ perceptions of various types of sounds. For voice sounds, this point is probably a little less than STC 50. For radio and television sounds as well as more general sounds from neighbours either side, the critical point is about STC 50. However, for music related sounds, the sound insulation must be greater than about STC 55 to reduce its impact on residents. These differences are consistent with the likely strength of these sounds and the potential disturbance that they would create.
35 40 45 50 55 60 1.0 1.5 2.0 2.5 3.0 R2 = 0.919, p < 0.000 M us ic s ounds STC, dB
Figure 6. Average responses concerning neighbours’ music related sounds versus STC.
35 40 45 50 55 60 1.0 1.5 2.0 2.5 3.0 R2 = 0.772, p < 0.004 R adi o T V soun ds STC, dB
Thus for most types of sound, the benefits of sound insulation only occur when the STC rating of the wall is substantially above STC 50. However, for music related sounds, the sound insulation is more effective if the party wall has an STC rating well over STC 55. Two of the average responses reduce to a score of about 1 at STC 60 indicating that at this point residents would not hear these sounds from their neighbours at all and they were ‘not at all annoyed’ by them. The other two average responses in Figure 7 are greatly reduced for a mean sound insulation rating of STC 60 suggesting that walls with STC 60 would practically eliminate problems related to inadequate sound insulation.
Conclusions
Noise from neighbours in multi-unit buildings is a serious problem that degrades the quality of life of the residents. Many of their spontaneous and directly elicited responses are strongly related to the measured STC values of the walls between their homes.
It is only when sound insulation is approximately STC 55 or greater, that sound insulation is effective in minimizing the negative effects on residents.
STC 55 is therefore recommended as a realistic goal for acceptable sound insulation and STC 60 as a more ideal goal that would practically eliminate the negative effects of neighbour’s noises.
Acknowledgements
The field measurements included in this work were carried out under contract by Valcoustics Canada Ltd. (Toronto), SNC Inc. (Montreal) and Harford Kennedy Ltd. (Vancouver).
References
1. Bradley, J.S. “Subjective Rating of Party Walls”. Canadian Acoustics, Vol. 11, No. 4, 37-45, (1983).
2. Bradley J.S., “Acoustical Measurements in Some Canadian Homes”, Canadian Acoustics, Vol. 14, No. 4, 1986, 19-21, 24-25, (1986). 35 40 45 50 55 60 1.0 1.5 2.0 2.5 3.0 Side Voices Radio TV Music B e st f it cu rv e s STC, dB