Publisher’s version / Version de l'éditeur:
Vous avez des questions? Nous pouvons vous aider. Pour communiquer directement avec un auteur, consultez la première page de la revue dans laquelle son article a été publié afin de trouver ses coordonnées. Si vous n’arrivez pas à les repérer, communiquez avec nous à [email protected].
Questions? Contact the NRC Publications Archive team at
[email protected]. If you wish to email the authors directly, please see the first page of the publication for their contact information.
https://publications-cnrc.canada.ca/fra/droits
L’accès à ce site Web et l’utilisation de son contenu sont assujettis aux conditions présentées dans le site LISEZ CES CONDITIONS ATTENTIVEMENT AVANT D’UTILISER CE SITE WEB.
Research Report (National Research Council of Canada. Institute for Research in
Construction), 2002-09-01
READ THESE TERMS AND CONDITIONS CAREFULLY BEFORE USING THIS WEBSITE.
https://nrc-publications.canada.ca/eng/copyright
NRC Publications Archive Record / Notice des Archives des publications du CNRC :
https://nrc-publications.canada.ca/eng/view/object/?id=7edd0d10-8783-4684-8ce3-aaf03111b381 https://publications-cnrc.canada.ca/fra/voir/objet/?id=7edd0d10-8783-4684-8ce3-aaf03111b381
NRC Publications Archive
Archives des publications du CNRC
For the publisher’s version, please access the DOI link below./ Pour consulter la version de l’éditeur, utilisez le lien DOI ci-dessous.
https://doi.org/10.4224/20378749
Access and use of this website and the material on it are subject to the Terms and Conditions set forth at
FTIR Gas Measurement in Home Smoke Alarm Tests
Su, J. Z.; Kanabus-Kaminska, J. M.
FTIR Gas Measurement in Home Smoke Alarm Tests
Su, J.Z.; Kanabus-Kaminska, M.
IRC-RR-107
September 2002
FTIR GAS MEASUREMENT IN HOME SMOKE ALARM TESTS
By
Joseph Z. Su and Malgosia Kanabus-Kaminska
Fire Risk Management Program Institute for Research in Construction National Research Council of Canada
ABSTRACT
The National Research Council of Canada performed Fourier Transform Infrared (FTIR) gas measurements during fire detection experiments (Tests 1–14) in a manufactured home, as part of a joint study with several U.S. organisations and federal agencies to evaluate current requirements and technology of residential smoke detectors. The objectives were to identify toxic species (such as HCl, HCN, NOx, HBr and HF) produced from test fires and to quantify
their concentrations for use in determination of the onset of untenable conditions.
Fire scenarios included flaming and smouldering fires of a mattress in a bedroom, upholstered chair in the living area and cooking oil fires. The size, growth rate and duration of the test fires were closely controlled to create small, slow smouldering fires (1 to 2 hours) and short flaming fires (3 minutes or less). While these test fires provided the greatest challenge for smoke detectors to detect the fires early before becoming fully developed ones, the experiments were terminated well before reaching conditions that would produce a significant amount of toxic species.
FTIR spectra collected during all these tests show spectral features from CO, CO2 and
water vapour. FTIR spectra collected during the chair and mattress smouldering and cooking oil fires also show absorption characteristic of volatile hydrocarbon compounds. There was no apparent absorption from chemical species such as HCl, NOx, HBr and HF in the FTIR spectra.
These chemical species were below the minimum detection limit of the FTIR spectrometer in this full-scale experimental set-up. HCN was only detected in Test 14 with an under-ventilated condition and its maximum concentration was 60 ppm. Carbon monoxide and carbon dioxide were primary gas products produced in these fire detection tests.
TABLE OF CONTENTS
1.0 INTRODUCTION ... 1
2.0 EXPERIMENTS... 2
3.0 RESULTS AND DISCUSSION ... 8
3.1 Smouldering Chair (Tests 1 and 11)... 8
3.2 Flaming Chair (Tests 2 and 10)... 8
3.3 Smouldering Mattress (Tests 3, 4, 6 and 8)... 9
3.4 Flaming Mattress (Tests 5, 7, 9 and 14) ... 9
3.5 Cooking Oil Fire (Tests 12 and 13)... 10
3.6 Primary Gas Products (CO and CO2) ... 11
3.7 Secondary Gas Products ... 11
4.0 CONCLUSIONS ... 25
5.0 ACKNOWLEDGEMENTS ... 25
6.0 REFERENCES ... 25
LIST OF FIGURES Figure 1. Manufactured home and FTIR measurement system ... 4
Figure 2. Plan view of a manufactured home, fire locations and FTIR gas sampling locations... 5
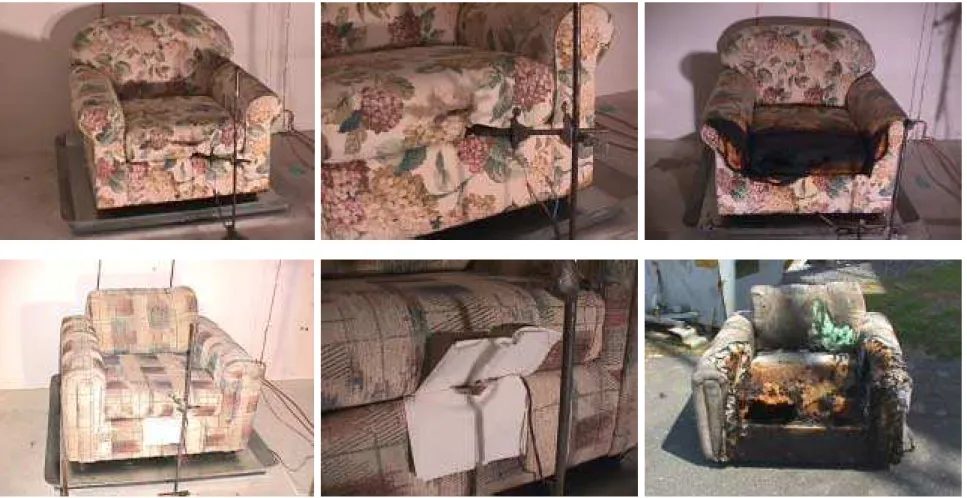
Figure 3. Upholstered chairs before and after smouldering and flaming fire tests ... 6
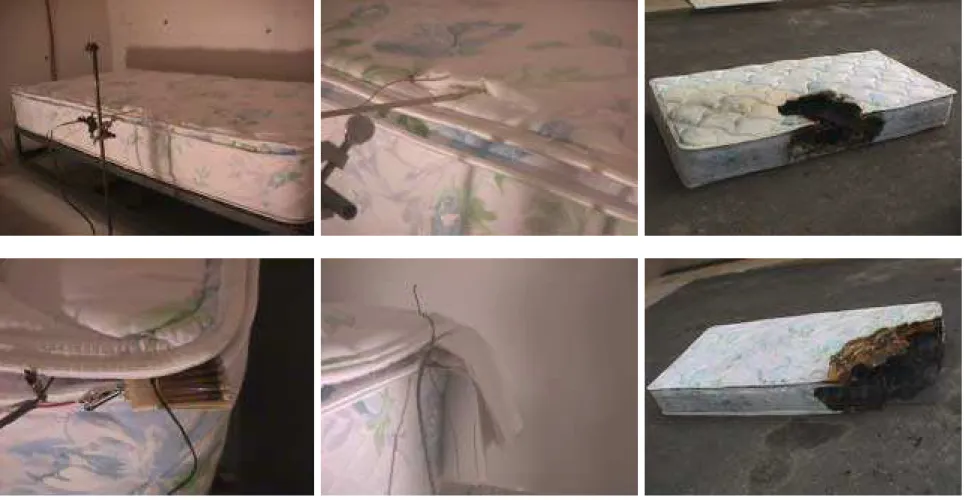
Figure 4. Twin-size mattresses before and after smouldering and flaming fire tests ... 7
Figure 5. 4-min average of FTIR spectra for fire location after first smoke alarm (Test 1) ... 12
Figure 6. 4-min average of FTIR spectra for fire location (Test 1) ... 12
Figure 7. 4-min average of FTIR spectra for the master bedroom (Test 1) ... 12
Figure 8. 4-min average of FTIR spectra for the master bedroom (Test 1) ... 13
Figure 9. 2-min average of spectra from fire location before water discharge in Test 2... 13
Figure 10. 1-min average of spectra at peak smoke obscuration in the master bedroom (Test 2) ... 13
Figure 11. Average of spectra for fire location in the last 4 minutes of mattress smouldering (Test 4) ... 14
Figure 12. Average spectrum for the fire room during peak smoke obscuration in Test 6 with mattress smouldering ... 14
Figure 13. 1-min average of spectra for the fire room after first smoke alarm in Test 8 with mattress smouldering ... 14
Figure 14. Average of spectra for the fire room during the 50-s flaming in Test 4 ... 15
Figure 16. Average of spectra for the fire room during the 100-s flaming in Test 8 ... 15
Figure 17. 1-min average of spectra for the fire room during suppression in Test 4 ... 16
Figure 18. 4-min average of spectra for the master bedroom during/after suppression (Test 4) ... 16
Figure 19. 2-min average of the spectra for the fire room during mattress flaming (Test 5)... 16
Figure 20. 3-min average of the spectra for the fire room during mattress flaming (Test 7)... 17
Figure 21. 2-min average of the spectra for the fire room during mattress flaming (Test 9)... 17
Figure 22. 2-min average of the spectra for the fire room after fire extinguishment (Test 9).... 17
Figure 23. Average of the spectra for the fire room during the last 30 s of mattress smouldering (Test 14) ... 18
Figure 24. 30-s average of the spectra for the fire room after mattress flaming (Test 14) ... 18
Figure 25. 90-s average of the spectra for the fire room after water spray (Test 14) ... 18
Figure 26. 60-s average of the spectra for the fire room after all doors opened (Test 14) ... 19
Figure 27. Average of spectra for last 2 minutes of cooking-oil heating (Test 13) ... 20
Figure 28. Average of spectra for last 2 minutes of cooking oil flaming (Test 13)... 20
Figure 29. 2-min average of spectra after cooking-oil fire extinguishment (Test 13) ... 20
Figure 30. Carbon dioxide concentration in master bedroom from FTIR and NDIR measurements for flaming chair (Test 2)... 21
Figure 31. Carbon dioxide concentration in master bedroom from FTIR and NDIR measurements for smouldering chair (Test 11)... 21
Figure 32. Carbon dioxide concentration in fire room from FTIR and NDIR measurements for flaming mattress (Test 5) ... 22
Figure 33. Carbon dioxide concentration in fire room from FTIR and NDIR measurements for smouldering mattress (Test 6) ... 22
Figure 34. Carbon dioxide concentration in master bedroom from FTIR and NDIR measurements for cooking oil fire (Test 12) ... 23
Figure 35. Carbon monoxide concentration in fire room from FTIR and NDIR measurements for flaming mattress (Test 5)... 23
Figure 36. Carbon monoxide concentration in fire room from FTIR and NDIR measurements for smouldering mattress (Test 6)... 24
Figure 37. Carbon monoxide concentration in master bedroom from FTIR and NDIR measurements for flaming chair (Test 10)... 24
FTIR GAS MEASUREMENT IN HOME SMOKE ALARM TESTS
by
Joseph Z. Su and Malgosia Kanabus-Kaminska
Fire Risk Management Program Institute for Research in Construction National Research Council of Canada
1.0 INTRODUCTION
Smoke alarms are important and cost-effective fire protection devices in residential dwellings, providing fire detection and evacuation warnings for occupants in case of fires. Between 1985 and 1995, Canada’s death rate in fires declined by more than 40 per cent, much of this decline is attributed to the use of residential smoke alarms and the enforcement of relevant codes and standards. This is also the case in the United States where the fire death rate has declined by approximately 50% since 1975.
In spite of this, the fire protection community has an ongoing task to maximize the benefit of current smoke detector technologies and develop new technologies in order to improve residential fire safety. As a contributor, the National Research Council of Canada (NRC) joined forces with several U.S. organizations and federal agencies to evaluate the current state of residential smoke detector requirements (known as the Dunes II Tests). This experimental program, commissioned by the U.S. Fire Administration and U.S. Consumer Product Safety Commission and executed by the National Institute of Standards and Technology (NIST), are another systematic evaluation of residential smoke detector technologies, 25 years after the first Indiana Dunes Tests [1].
The research involved 2 series of full-scale fire detection experiments. Series 1 experiments were conducted in a manufactured home at a NIST test site [2]. Series 2
experiments were conducted in a two-storey single house in Kinston, North Carolina [3]. The research program began in October 2000 and is completed in September 2002. The research aimed to determine the response of smoke, heat, and carbon monoxide detectors to modern residential fires and the available egress time before the onset of untenable conditions. General information on the research program is on the web site http://smokealarm.nist.gov/.
Inhalation of toxic smoke generated by fires has been the major cause of fire fatalities. NRC's role in this important testing program has been to provide expertise in performing Fourier Transform Infrared (FTIR) measurement and analysis of smoke and toxic gases (such as HCl, HCN, NOx, HBr and HF) during fire detection experiments and to participate in the project
steering committee. The objectives were to identify and quantify the concentrations of harmful species produced from test fires and to provide data for use in determination of the onset of untenable conditions.
NRC participated in, and performed the FTIR gas measurement during Series 1 experiments in the manufactured home at the NIST site (Tests 1–14 in May and June 2001). The results of the FTIR measurement and data analysis for toxic gases are documented in this report.
2.0 EXPERIMENTS
Experimental details of detector placement, instrumentation for various measurements (temperature, heat release rate, mass loss rate, smoke properties, response of various
detectors, etc.) and test conditions are described in the NIST report [2]. The following sections only address matters that directly relate to the FTIR gas measurement.
Figure 1 shows a manufactured home and FTIR measurement system that were used in full-scale fire detection experiments. This was a 900-square-foot one-storey house with 3 bedrooms, a bathroom, a kitchen, and a living area. Figure 2 shows a plan view of the test house, fire locations, and FTIR measurement points.
Fire scenarios included flaming and smouldering fires of a twin-size mattress in the end bedroom and an upholstered chair in the living area. Figures 3-4 shows chair and mattress fuel packages and ignition sources used in the experiments. The flaming fire was started using an electric match that was inserted into a fold of the upholstered chair or mattress. The
smouldering fire was started using an electric nichrome-wire loop (3.8-cm or 10-cm diameter) that was inserted into the polyurethane foam of the chair or mattress. An autotransformer was used to regulate the electric current to the smouldering loop in order to control the heat. Fire scenarios also included cooking oil fires, ignited by heating corn oil (500 mL) on a gas burner. These fuel packages were representative of common household items that were often first ignited in real fire incidents. In each experiment, the electric power to the ignition source or the gas burner was turned on 3 minutes after the start of the test.
NRC performed FTIR gas measurements during 14 full-scale fire detection experiments (8 experiments with fire origin in the end bedroom, 4 experiments with fire origin in the living area and 2 experiments with fire origin in the kitchen). Four gas sampling ports were located along the centre line of the house as shown in Figure 2. These included a ceiling sampling port (2.4 m above floor) in each of the 3 rooms of fire origin, and a target sampling port in the remote master bedroom at 1.5 m above floor (0.6 m from the end wall).
Each experiment involved a ceiling sampling port in the room of fire origin and the target sampling port for the gas measurement. Gas samples were drawn by pumps from the ceiling sampling port in the room of fire origin and the target sampling port in the master bedroom through two gas sampling lines to 2 FTIR spectrometers, respectively. Pyrex cylindrical gas cells (one with 10-cm pathlength and 110-mL volume, the other with 100-cm pathlength and 120-mL volume) with KBr optics were used for the FTIR spectrometers. The gas samples flowed through the gas cells at a flow rate of 9 L/min. To prevent the condensation of sample gases, the sampling lines and gas cells were heated (the temperature setting was 93°C for the line to the fire room and 121°C for the line to the master bedroom). The infrared light that emitted from the spectrometer passed through the gas cell. The FTIR spectrometers scanned the gas samples over a wide frequency range of 400 to 4500 cm-1 at a 1-cm-1 resolution.
Chemical compounds that give rise to a permanent or oscillating dipole moment can absorb the infrared light at unique characteristic frequencies, which serve as their "fingerprints". Species, such as HCl, HCN, NOx, HBr and HF, absorb the infrared light and leave "fingerprints"
at their characteristic frequencies in the infrared spectrum. The magnitude of the absorption of each species at its characteristic frequencies is a function of its concentration. With calibration of the FTIR spectrometers using standard gases at known concentrations, the concentration of each species produced during fire experiments can be quantified.
Table 1 shows a matrix of the FTIR measurement during the fire experiments. The bathroom window was partially open (33 cm x 20 cm opening) to make up air in the house. All exterior doors and other windows were closed during each experiment. The master bedroom door was always open. The doors of the smallest bedroom and the bathroom were always closed. The end bedroom door was open unless otherwise specified.
TABLE 1
FTIR Measurement during Tests in Manufactured Home (May and June, 2001)
Test 1 Test 2 Test 3 Test 4 Test 5
Fire Origin Living Area Living Area End Bedroom End Bedroom End Bedroom
Fuel Upholstered
Chair
Upholstered
Chair Mattress Mattress Mattress
Burning Mode Smouldering Flaming Smouldering Smouldering Flaming
Burst to
Flame at 2 h 8 min 3 min no flame 58 min 3½ min
FTIR Gas
Sampling 2 h 11 min 15 min 1 h 33 min 1 h 10 min 14 min
Test 6 Test 7 Test 8 Test 9 Test 10
Fire Origin End Bedroom End Bedroom End Bedroom End Bedroom
(Door Closed) Living Area
Fuel Mattress Mattress Mattress Mattress Upholstered Chair
Burning Mode Smouldering Flaming Smouldering Flaming Flaming
Burst to
Flame at 1 h 42 min 3½ min 1 h 4 min 3 min
7½ min (2nd ignition)
FTIR Gas
Sampling 1 h 52 min 15 min 1 h 11 min 25 min 15 min
Test 11 Test 12 Test 13 Test 14
Fire Origin Living Area Kitchen Kitchen End Bedroom
(Door Closed)
Fuel Upholstered
Chair Cooking Oil Cooking Oil Mattress
Burning Mode Smouldering Flaming Flaming Smouldering /
Flaming
Burst to
Flame at 1 h 13 min 26 min 25 min 1 h
FTIR Gas
Sampling 1 h 20 min 33 min 36 min 1 h 14 min
Figure 2. Plan view of a manufactured home (floor plan courtesy of NIST), fire locations (chair, mattress, kitchen stove) and FTIR gas sampling locations (ò)
Chair Mattress
3.0 RESULTS AND DISCUSSION
A total of 50,000 frames of FTIR spectra (approximately 2 gigabytes) was collected during Tests 1-14 and analyzed in various ways to determine gas components in smoke. Final analysis results are presented as follows along with representative spectroscopic information.
3.1 Smouldering Chair (Tests 1 and 11)
In Tests 1 and 11, an upholstered chair was used as the fuel package to create a smouldering fire in the living area. The smouldering fire was controlled to develop very slowly. The ceiling temperature rise at the living area was 3°C or less during the smouldering period.
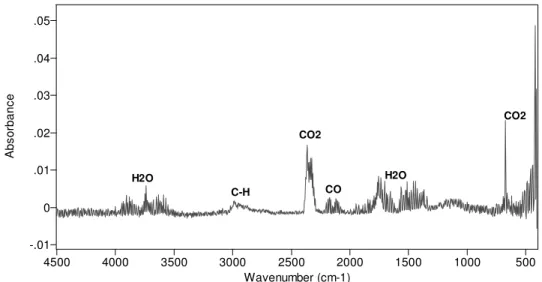
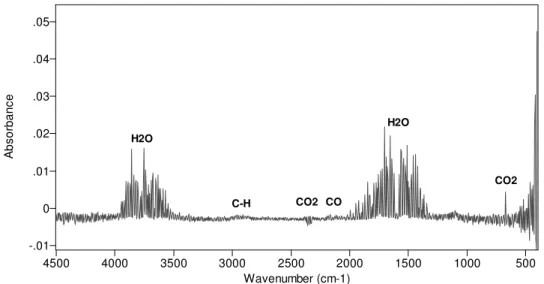
Figure 5 shows an FTIR spectrum after the first smoke alarm was actuated (57 min after energizing the ignitor) during Test 1, which is a 4-min average of the spectra from 56 to 60 min for the fire location. Figure 6 shows another average spectrum from the fire location and Figure 7 shows an average spectrum for the master bedroom for the following 4 minutes.
In Test 1, most of other detectors were actuated at least 87 min after energizing the ignitor. Figure 8 shows a 4-min average spectrum for the master bedroom (around 104 min) when the smoke obscuration, concentrations of CO2 and CO and analog outputs of various
detectors in the master bedroom were at peak values.
These spectra are representative of all spectra collected in Tests 1 and 11 during the smouldering chair fire, showing absorption from CO, CO2 and water vapour as well as an
absorption band around 3000 cm-1. This absorption band around 3000 cm-1 is characteristic of C–H stretching of volatile hydrocarbon compounds.
3.2 Flaming Chair (Tests 2 and 10)
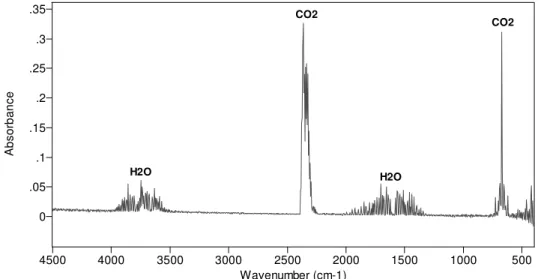
In Tests 2 and 10, an upholstered chair was used as the fuel package to create a flaming fire in the living area. The first smoke alarm was actuated 24 s and 44 s after the ignition in Test 2 and Test 10, respectively; activation of many other detectors followed. Approximately 3 minutes after flaming, experimental conditions met the criteria for terminating the test (set by NIST) and water was discharged on the fire. The tests were ended with fire suppression and ventilation. Before the fire suppression, the ceiling temperature of the living area reached 125°C in Test 2 and 500°C in Test 10.
Figure 9 shows a 2-min average of the spectra from the fire location before the water discharge in Test 2. Figure 10 shows a 1-min average of the spectra from the master bedroom when the smoke obscuration and CO2 concentration in the master bedroom were at peak values
in the same test.
These spectra are representative of all spectra collected in Tests 2 and 10 during the flaming chair fire. The spectra show absorption only from CO, CO2 and water vapour.
3.3 Smouldering Mattress (Tests 3, 4, 6 and 8)
In Tests 3, 4, 6 and 8, a twin-size mattress was used as the fuel package to create a smouldering fire in the end bedroom. During the smouldering period (90, 55, 99 and 61 min long, respectively), the change of temperatures in the house was very small in these tests; the maximum temperature rise was approximately 2°C in the room of fire origin.
Figures 11-13 are a few of representative spectra during mattress smouldering. Figure 11 shows an FTIR spectrum in Test 4, which is an average of the spectra from the fire location during the last 4 minutes (51 to 55 min from energizing the ignitor) of smouldering. Figure 12 is an average of the spectra from the fire room during a peak period of smoke obscuration when the first smoke alarm actuated (3443 s after energizing the ignitor) in Test 6. Figure 13 is a 1-min average of the spectra from the fire room when the first smoke alarm actuated (1950 s after energizing the ignitor) in Test 8. These spectra show absorption from water vapour, CO, CO2 and an absorption band around 3000 cm-1 due to C–H stretching of
volatile hydrocarbon compounds.
The mattress smouldering changed to flaming 55, 99 and 61 minutes after energizing the ignitor in Tests 4, 6 and 8, respectively. Figure 14 shows an average of the spectra from the fire room during the 50-second-long flaming in Test 4. Figure 15 shows an average of the spectra from the fire room during the 60-second-long flaming in Test 6. Figure 16 shows an average of the spectra from the fire room during the 100-second-long flaming in Test 8. These spectra also show CO and CO2 absorption as well as absorption from water vapour and C–H
stretching of volatile hydrocarbon compounds.
Once the mattress started flaming, the ceiling temperature in the fire room rose quickly. The transition from smouldering to flaming was the criterion for terminating the tests (set by NIST). Water was discharged to suppress the fire (flaming only lasted for approximately
50-100 s in these mattress smouldering tests). Figure 17 shows a 1-min average of the spectra from the fire room during the fire suppression in Test 4. Figure 18 shows a 4-min average of the spectra from the master bedroom during and after the fire suppression in Test 4 when the smoke obscuration and analog output of various detectors were at peak values in the master bedroom.
The spectra shown in Figures 11-18 are representative of all spectra collected in Tests 3, 4, 6 and 8. Other than CO, CO2, water and C–H stretching of volatile hydrocarbon
compounds, there was no distinct absorption from any other chemical species in the FTIR spectra.
3.4 Flaming Mattress (Tests 5, 7, 9 and 14)
In Tests 5, 7, 9 and 14, a twin-size mattress was used as the fuel package to create a flaming fire in the end bedroom. Note that the fire-room door was closed in Tests 9 and 14.
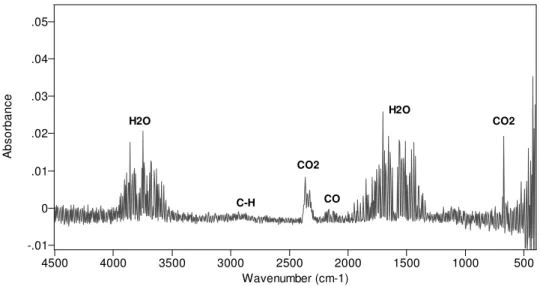
In Tests 5 and 7, the first smoke alarm actuated 32 s and 43 s after the ignition, respectively. Activation of many other detectors followed. Approximately 3 minutes after ignition, experimental conditions met the criteria for terminating the tests (set by NIST) and water was discharged to the fire. The test was ended with fire suppression and ventilation. Before the fire suppression, the ceiling temperature of the fire room reached 180°C in Test 5
and 500°C in Test 7. Figure 19 shows a 2-min average of the spectra from the fire location during the flaming period in Test 5. Figure 20 shows a 3-min average of the spectra from the fire room during the flaming period in Test 7. The spectra show absorption pattern only from CO, CO2 and water vapour.
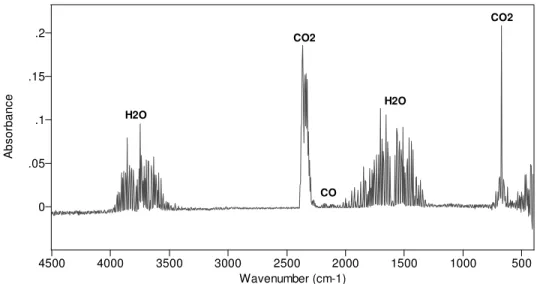
Test 9 was similar to Tests 5 and 7. But, the fire room door was closed in Test 9. The first smoke alarm actuated 30 s after the ignition. Experimental conditions met the criteria for terminating the test approximately 3 minutes after ignition; water was discharged to extinguish the fire. Before the fire suppression, the ceiling temperature of the fire room reached 340°C. Figure 21 shows a 2-min average of the spectra from the fire room during mattress flaming. Figure 22 shows a 2-min average of the spectra from the fire room after fire extinguishment. The spectrum shows absorption only from CO2, CO and water vapour.
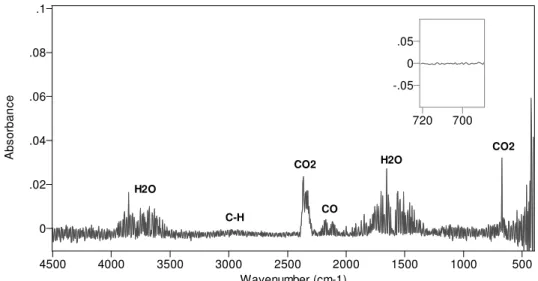
Test 14 was similar to Test 9 with the fire-room door being closed. However, the mattress smouldered for 3400 s. The first smoke alarm in the fire room was actuated 2648 s after energizing the ignitor. Figure 23 shows a 30-s average of the spectra from the fire room during the last 30 seconds of mattress smouldering. The mattress fire became a flaming one approximately 3400 s after energizing the ignitor. Figure 24 shows a 30-s average of the spectra from the fire room during flaming. Approximately 1 minute after flaming, experimental conditions met the criteria for terminating the test and water was discharged to extinguish the fire (the ceiling temperature of the fire room reached 380°C before the fire suppression).
Figure 25 shows a 1.5-min average of the spectra from the fire room after water spray. The fire room door was kept closed for another 9 minutes. Then, the doors of the fire room, front and back entrances were opened to allow smoke moving from the fire room to other parts of the house and outside. Figure 26 shows a 1-min average of the spectra from the fire room after all the doors were opened.
Figures 19-26 are representative of all spectra collected in Tests 5, 7, 9 and 14 during the flaming mattress fire. These spectra show absorption mainly from CO, CO2 and water
vapour. Prior to mattress flaming in Test 14, the spectra indicate weak absorption band around 3000 cm-1 due to C-H stretching of volatile hydrocarbon compounds released during pyrolysis of the mattress. Since this test was conducted with an under-ventilated condition, the spectra did show absorption from HCN. The HCN concentration was at a maximum of 60 ppm, which was determined from the 1-min average spectra immediately after spraying water on the fire.
3.5 Cooking Oil Fire (Tests 12 and 13)
In Tests 12 and 13, corn oil (500 mL) in a cooking pan was heated on a gas burner until flaming. The propane stove was turned on 3 minutes after the start of the test. Smoke started to be produced (smouldering mode). The first smoke alarm actuated 9 to 10 minutes after heating the oil in these two tests. The cooking oil reached 382-387°C and auto-ignited 22-23 minutes after being heated in these two tests. In Test 12, the cooking oil flamed for 2.5 minutes and was manually extinguished. In Test 13, the cooking oil flamed for 5 minutes and then self-extinguished. Before the fire extinguishment, the ceiling temperature in the living area was 121°C in Test 12 and 118°C in Test 13; the ceiling temperature in the master bedroom was 59°C in Test 12 and 55°C in Test 13.
Figures 27-29 show 2-min average of the spectra from the kitchen area at different stages of Test 13. Figure 27 shows a 2-min average of the spectra from the kitchen area during the last 2 minutes of heating (before flaming). Figure 28 shows a 2-min average of the spectra
from the kitchen area during the last 2 minutes of flaming. Figure 29 shows a 2-min average of the spectra from the kitchen area after fire self-extinguishment. The spectra show absorption from CO, CO2, water vapour and an absorption band around 3000 cm-1 due to C–H stretching of
volatile hydrocarbon compounds. These spectral features are representative of all spectra collected in Tests 12 and 13 with the cooking oil fire.
3.6 Primary Gas Products (CO and CO2)
CO and CO2 are primary gas products produced in the fire detection tests. The FTIR
spectrometer was calibrated on site for CO2 at concentrations of 1089 ppm, 5123 ppm and
2.01% and for CO at concentrations of 216 ppm and 1031 ppm. The transport time of the gas sample in the sampling lines was 10 ï 2 s, which was determined by aspirating the 2.01% CO2
calibration gas through the sampling lines.
Figures 30-37 show typical CO and CO2 concentrations from the FTIR analysis. Results
from the FTIR measurement are consistent with those measured by NIST using the
nondispersive infrared (NDIR) gas analyzers. For smouldering fires, most of the concentration rise happened after transition to flaming, similar to other parameters measured by NIST.
3.7 Secondary Gas Products
The main objectives of the FTIR measurement were to identify secondary gas products from the test fires. In addition to CO and CO2, the FTIR measurement showed absorption
around 3000 cm-1, characteristic of C–H stretching of volatile hydrocarbon compounds from the chair and mattress smouldering as well as cooking oil fires. There was no apparent absorption from chemical species such as HCl, NOx, HBr and HF in the FTIR spectra. In other words,
these chemical species were below the minimum detection limit (MDL) of the FTIR spectrometer in this full-scale experimental set-up. HCN was only detected in Test 14 with an
under-ventilated condition and its maximum concentration was 60 ppm.
The MDL depended not only on the quality of FTIR spectrometer's infrared
source/detector and optical stability but also on operation parameters such as gas cell, number of scans and spectral resolution, as well as gas sampling systems used in the experiments. The MDL under this full-scale experimental set-up and operation conditions was estimated to be 30 ppm for HCN and HF, 50 ppm for HCl and NO2, and 100 ppm for NO and HBr, based on
previous calibration and data from similar gas sampling tests at NRC as well as library data from the FTIR spectrometer manufacturer.
-.01 0 .01 .02 .03 .04 .05 A b so rb a n ce 4500 4000 3500 3000 2500 2000 1500 1000 500 Wavenumber (cm-1)
Figure 5. 4-min average of FTIR spectra for fire location after first smoke alarm
H2O H2O CO2 CO2 CO C-H (Test 1) -.01 0 .01 .02 .03 .04 .05 Ab s o rb a n c e 4500 4000 3500 3000 2500 2000 1500 1000 500 Wavenumber (cm-1)
Figure 6. 4-min average of FTIR spectra (at 60 min) for fire location (Test 1)
H2O H2O CO2 CO2 CO C-H -.01 0 .01 .02 .03 .04 .05 Ab s o rb a n c e 4500 4000 3500 3000 2500 2000 1500 1000 500 Wavenumber (cm-1)
Figure 7. 4-min average of FTIR spectra (at 60 min) for master bedroom (Test 1)
H2O CO2 H2O
CO2
CO C-H
-.01 0 .01 .02 .03 .04 .05 Ab s o rb a n c e 4500 4000 3500 3000 2500 2000 1500 1000 500 Wavenumber (cm-1)
Figure 8. 4-min average of FTIR spectra (at 104 min) for master bedroom (Test 1)
H2O H2O CO2 CO2 CO C-H 0 .05 .1 .15 .2 .25 .3 .35 A b s o rb ance 4500 4000 3500 3000 2500 2000 1500 1000 500 Wavenumber (cm-1)
Figure 9. 2-min average of spectra from fire location before water discharge
H2O H2O CO2 CO2 CO in Test 2 0 .05 .1 .15 .2 .25 .3 .35 A b so rb a n ce 4500 4000 3500 3000 2500 2000 1500 1000 500 Wavenumber (cm-1)
Figure 10. 1-min average of spectra at peak smoke obscuration in master bedroom
H2O H2O
CO2
CO2
-.01 0 .01 .02 .03 .04 .05 Ab s o rb a n c e 4500 4000 3500 3000 2500 2000 1500 1000 500 Wavenumber (cm-1)
Figure 11. Average of spectra for fire location in last 4 minutes of mattress
H2O H2O CO2 CO2 CO C-H smouldering (Test 4) -.01 0 .01 .02 .03 .04 .05 Ab s o rb a n c e 4500 4000 3500 3000 2500 2000 1500 1000 500 Wavenumber (cm-1)
Figure 12. Average spectrum for fire room during peak smoke obscuration in Test 6
H2O
H2O
CO2 CO2
CO C-H
with mattress smouldering
-.01 0 .01 .02 .03 .04 .05 Ab s o rb a n c e 4500 4000 3500 3000 2500 2000 1500 1000 500 Wavenumber (cm-1)
Figure 13. 1-min average of spectra for fire room after first smoke alarm in
H2O H2O
CO2
CO2
CO C-H
-.01 0 .01 .02 .03 .04 .05 Ab s o rb a n c e 4500 4000 3500 3000 2500 2000 1500 1000 500 Wavenumber (cm-1)
Figure 14. Average of spectra for fire room during the 50-s flaming in Test 4
H2O H2O CO2 CO2 CO C-H -.01 0 .01 .02 .03 .04 .05 Ab s o rb a n c e 4500 4000 3500 3000 2500 2000 1500 1000 500 Wavenumber (cm-1)
Figure 15. Average of spectra for fire room during the 60-s flaming in Test 6
H2O H2O CO2 CO2 CO C-H 0 .1 .2 .3 .4 Ab s o rb a n c e 4500 4000 3500 3000 2500 2000 1500 1000 500 Wavenumber (cm-1)
Figure 16. Average of spectra for fire room during the 100-s flaming in Test 8
H2O H2O
CO2
CO2
0 .05 .1 .15 .2 Ab s o rb a n c e 4500 4000 3500 3000 2500 2000 1500 1000 500 Wavenumber (cm-1)
Figure 17. 1-min average of spectra for fire room during suppression in Test 4
H2O H2O CO2 CO2 CO -.01 0 .01 .02 .03 .04 .05 Ab s o rb a n c e 4500 4000 3500 3000 2500 2000 1500 1000 500 Wavenumber (cm-1)
Figure 18. 4-min average of spectra for master bedroom during/after suppression
H2O H2O CO2 CO2 CO (Test 4) C-H 0 .05 .1 .15 .2 .25 Ab s o rb a n c e 4500 4000 3500 3000 2500 2000 1500 1000 500 Wavenumber (cm-1)
Figure 19. 2-min average of spectra for fire room during mattress flaming (Test 5)
H2O H2O
CO2 CO2
0 .2 .4 .6 .8 1 1.2 Ab s o rb a n c e 4500 4000 3500 3000 2500 2000 1500 1000 500 Wavenumber (cm-1)
Figure 20. 3-min average of spectra for fire room during mattress flaming (Test 7)
H2O H2O CO2 CO2 CO 0 .1 .2 .3 .4 .5 Ab s o rb a n c e 4500 4000 3500 3000 2500 2000 1500 1000 500 Wavenumber (cm-1)
Figure 21. 2-min average of spectra for fire room during mattress flaming (Test 9)
H2O H2O CO2 CO2 CO 0 .2 .4 .6 .8 1 1.2 Ab s o rb a n c e 4500 4000 3500 3000 2500 2000 1500 1000 500 Wavenumber (cm-1)
Figure 22. 2-min average of spectra for fire room after fire extinguishment
H2O H2O
CO2
CO2
CO
0 .02 .04 .06 .08 .1 A b s o rb ance 4500 4000 3500 3000 2500 2000 1500 1000 500 Wavenumber (cm-1)
Figure 23. Average of spectra for fire room during the last 30 s of -.05 0 .05 720 700 H2O H2O CO2 CO2 CO C-H mattress smouldering (Test 14) 0 .2 .4 .6 .8 1 1.2 Ab s o rb a n c e 4500 4000 3500 3000 2500 2000 1500 1000 500 Wavenumber (cm-1)
Figure 24. 30-s average of spectra for fire room after mattress flaming (Test 14) 0 .1 .2 720 700 H2O H2O CO2 CO2 CO C-H CO2 CO2 0 .2 .4 .6 .8 1 1.2 Ab s o rb a n c e 4500 4000 3500 3000 2500 2000 1500 1000 500 Wavenumber (cm-1)
Figure 25. 90-s average of spectra for fire room after water spray (Test 14) 0 .1 .2 720 700 H2O H2O CO2 CO2 CO C-H HCN CO2 CO2
0 .2 .4 .6 .8 Ab s o rb a n c e 4500 4000 3500 3000 2500 2000 1500 1000 500 Wavenumber (cm-1)
Figure 26. 60-s average of spectra for fire room after all doors opened (Test 14) 0 .05 .1 720 700 H2O H2O CO2 CO2 CO C-H HCN CO2 CO2
-.02 0 .02 .04 .06 .08 .1 .12 .14 Ab s o rb a n c e 4500 4000 3500 3000 2500 2000 1500 1000 500 Wavenumber (cm-1)
Figure 27. Average of spectra for last 2 minutes of cooking-oil heating (Test 13)
H2O H2O CO2 CO2 CO C-H 0 .2 .4 .6 .8 1 Ab s o rb a n c e 4500 4000 3500 3000 2500 2000 1500 1000 500 Wavenumber (cm-1)
Figure 28. Average of spectra for last 2 minutes of cooking-oil flaming (Test 13)
H2O H2O CO2 CO2 CO C-H 0 .1 .2 .3 .4 Ab s o rb a n c e 4500 4000 3500 3000 2500 2000 1500 1000 500 Wavenumber (cm-1)
Figure 29. 2-min average of spectra after cooking-oil fire extinguishment
H2O H2O CO2 CO2 CO C-H (Test 13)
Time [s] 0 200 400 600 800 CO 2 [%] -0.1 0.0 0.1 0.2 0.3 0.4 0.5 0.6 0.7 NDIR FTIR
Figure 30. Carbon dioxide concentration in master bedroom from FTIR and NDIR measurements for flaming chair (Test 2)
FTIR disconnected from fire location and took ambient air samples before switching to the master bedroom
Time [s] 3400 3600 3800 4000 4200 4400 4600 CO 2 [%] -0.2 0.0 0.2 0.4 0.6 0.8 1.0 1.2 1.4 NDIR FTIR
Figure 31. Carbon dioxide concentration in master bedroom from FTIR and NDIR measurements for smouldering chair (Test 11)
Time [s] 0 100 200 300 400 500 600 700 CO 2 [%] -0.2 0.0 0.2 0.4 0.6 0.8 1.0 1.2 1.4 NDIR FTIR
Figure 32. Carbon dioxide concentration in fire room from FTIR and NDIR measurements for flaming mattress (Test 5)
Time [s] 3500 4000 4500 5000 5500 6000 6500 CO 2 [% ] 0.0 0.2 0.4 0.6 0.8 1.0 NDIR FTIR
Figure 33. Carbon dioxide concentration in fire room from FTIR and NDIR measurements for smouldering mattress (Test 6)
Time [s] 0 100 200 300 400 500 600 700 CO [ % ] 0.00 0.02 0.04 0.06 0.08 0.10 0.12 NDIR FTIR
Figure 35. Carbon monoxide concentration in fire room from FTIR and NDIR measurements for flaming mattress (Test 5)
Time [s] 0 500 1000 1500 2000 CO 2 [%] -0.2 -0.1 0.0 0.1 0.2 0.3 0.4 0.5 NDIR FTIR
Figure 34. Carbon dioxide concentration in master bedroom from FTIR and NDIR measurements for cooking oil fire (Test 12)
Time [s] 3500 4000 4500 5000 5500 6000 6500 CO [ % ] -0.01 0.00 0.01 0.02 0.03 0.04 0.05 NDIR FTIR
Figure 36. Carbon monoxide concentration in fire room from FTIR and NDIR measurements for smouldering mattress (Test 6)
Time [s] 0 100 200 300 400 500 CO [ % ] 0.00 0.02 0.04 0.06 0.08 0.10 NDIR FTIR
Figure 37. Carbon monoxide concentration in master bedroom from FTIR and NDIR measurements for flaming chair (Test 10)
4.0 CONCLUSIONS
The small, slow smouldering fires and short flaming fires provided the greatest challenge for the smoke detectors to detect the fires early before becoming fully developed ones.
However, the experiments were terminated well before reaching conditions that would produce a significant amount of chemical species, such as HCl, HCN, NOx, HBr and HF, above the
minimum detection limit of the FTIR spectrometer in this full-scale experimental set-up. Carbon monoxide and carbon dioxide were primary gas products produced in Tests 1-14. There was no apparent absorption from chemical species such as HCl, NOx, HBr and HF in the FTIR spectra.
FTIR spectra collected during the chair and mattress smouldering and cooking oil fires show absorption in region characteristic of volatile hydrocarbon compounds. The FTIR measurement only detected absorption from HCN (60 ppm at maximum) during Test 14 with an
under-ventilated condition.
5.0 ACKNOWLEDGEMENTS
NRC acknowledges financial contributions from the Canadian Fire Alarm Association and Health Canada. NRC also acknowledges supports from NIST, in particular, Mr. Richard W. Bukowski, Mr. Nelson P. Bryner, Dr. Marc R. Nyden and the testing crew for logistic and
experimental support.
6.0 REFERENCES
1. Bukowski, R. W., Waterman, T. E., and Christian, W. J., “Detector Sensitivity and Siting Requirements for Dwellings: A Report of the NBS ‘Indiana Dunes Tests.’” NFPA No. SPP-43. Nat. Fire Prot. Assn., Quincy, MA, 1975.
2. Peacock, R.D., Averill, J.D., Bukowski, R.W., and Reneke, P.A., "Home Smoke Alarm Project, Manufactured Home Tests," NIST Report of Test FR 4016, Fire Research Division, Building and Fire Research Laboratory, National Institute of Standards and Technology, Gaithersburg, MD, June, 2002.
3. Averill, J.D., Peacock, R.D., Bukowski, R.W., and Reneke, P.A., "Home Smoke Alarm Project, Two-Story Home Tests," NIST Report of Test FR 4017, Fire Research Division, Building and Fire Research Laboratory, National Institute of Standards and Technology, Gaithersburg, MD, June, 2002.