HAL Id: hal-01476188
https://hal.laas.fr/hal-01476188
Submitted on 24 Feb 2017
HAL is a multi-disciplinary open access archive for the deposit and dissemination of sci-entific research documents, whether they are pub-lished or not. The documents may come from teaching and research institutions in France or abroad, or from public or private research centers.
L’archive ouverte pluridisciplinaire HAL, est destinée au dépôt et à la diffusion de documents scientifiques de niveau recherche, publiés ou non, émanant des établissements d’enseignement et de recherche français ou étrangers, des laboratoires publics ou privés.
Miguel-Angel Lopez, José-Maria Ocon, Carlos Area Rúa, Juliette Dromard,
Philippe Owezarski
To cite this version:
Miguel-Angel Lopez, José-Maria Ocon, Carlos Area Rúa, Juliette Dromard, Philippe Owezarski. ON-TIC: D5.4: Use Case #1 Network Intrusion Detection. LAAS-CNRS; SATEC. 2017. �hal-01476188�
Online Network Traffic
Characterization
Deliverable
Use Case #1 Network Intrusion Detection
ONTIC Project
(GA number 619633)
Deliverable D5.4
Dissemination Level: PUBLIC
Authors
Miguel Ángel López Peña, José María Ocón Quintana; Carlos Area Rúa
SATEC
Juliette Dromard, Philippe Owezarski
LAAS-CNRS
Version
ONTIC_D5.4_2017.01.31_1.0.DOCX
!
Copyright © 2017, ONTIC Consortium
The ONTIC Consortium (http://www.http://ict-ontic.eu/) grants third parties the right to use and distribute all or parts of this document, provided that the ONTIC project and the document are
properly referenced.
THIS DOCUMENT IS PROVIDED BY THE COPYRIGHT HOLDERS AND CONTRIBUTORS "AS IS" AND ANY EXPRESS OR IMPLIED WARRANTIES, INCLUDING, BUT NOT LIMITED TO, THE IMPLIED WARRANTIES OF MERCHANTABILITY AND FITNESS FOR A PARTICULAR
PURPOSE ARE DISCLAIMED. IN NO EVENT SHALL THE COPYRIGHT OWNER OR CONTRIBUTORS BE LIABLE FOR ANY DIRECT, INDIRECT, INCIDENTAL, SPECIAL, EXEMPLARY, OR CONSEQUENTIAL DAMAGES (INCLUDING, BUT NOT LIMITED TO, PROCUREMENT OF SUBSTITUTE GOODS OR SERVICES; LOSS OF USE, DATA, OR PROFITS; OR BUSINESS INTERRUPTION) HOWEVER CAUSED AND ON ANY THEORY OF
LIABILITY, WHETHER IN CONTRACT, STRICT LIABILITY, OR TORT (INCLUDING NEGLIGENCE OR OTHERWISE) ARISING IN ANY WAY OUT OF THE USE OF THIS
Version History
Version Modification
date
Modified
by
Summary
0.0
2016-09-26
SATEC
Structure proposal
0.1
2016-10-18
SATEC
First draft version
0.2
2016-11-25
CNRS
SATEC
Contributions by CNRS and SATEC
0.3
2016-01-13
ADAPTIT
CNRS
UPM
ERC
SATEC
Second Draft: First review
0.4
2017-01-30
CNRS
SATEC
Corrections after first review
1.0
2017-01-31
SATEC
QA Review
Final version
Quality Assurance:
Role
Name
Quality Assurance Manager
Miguel Ángel López Peña (SATEC)
Reviewer #1
Panos Georgatsos (ADAPTIT)
Reviewer #2
Alberto Mozo (UPM)
Table of Contents
1.
A
CRONYMS ANDD
EFINITIONS8
1.1 Acronyms ... 8
2.
P
URPOSE OF THED
OCUMENT9
3.
S
COPE10
4.
I
NTENDEDA
UDIENCE11
5.
S
UGGESTEDP
REVIOUSR
EADINGS12
6.
E
XECUTIVES
UMMARY13
7.
U
SEC
ASE#1
E
NVIRONMENT14
7.1 Overall ... 147.2 Use Case #1 - Network Anomaly Detection Context and Scope ... 15
8.
U
SEC
ASE#1
S
PECIFICATION17
8.1 Use Cases, epics and user stories ... 178.2 UC #1 (User Story 1): Network Anomaly Detection ... 17
8.2.1 Scenario description ... 17
8.2.2 User Requirements ... 18
8.2.3 Requirement Specification ... 20
8.2.3.1 Anomaly Detection Subsystem Requirement Specification 20 8.2.3.2 Dashboard Subsystem Requirement Specification 21
9.
U
SEC
ASE#1
D
ESIGN30
9.1 System model ... 309.1.1 Functionalities ... 30
9.1.2 Software architecture ... 31
9.1.3 Anomaly Detection Subsystem Design ... 32
9.1.4 Network Traffic Dashboard subsystem Design ... 33
9.1.4.1 Network Data Processing Module design 34 9.1.4.2 Result Visualization Module design 36
10.
U
SEC
ASE#1
I
MPLEMENTATION40
10.1.1 Anomaly Detection Subsystem implementation ... 4010.1.2 Network Traffic Dashboard Subsystem implementation ... 40
10.1.3 Enabling technologies ... 41
10.1.4 API specification ... 42
11.
U
SEC
ASE#1
T
ESTING43
11.1 Performance Evaluation ... 4311.1.1 Relevant Metrics ... 43
11.1.1.2 Network Traffic Dashboard Subsystem Metrics 43
11.1.2 Mechanisms ... 44
11.1.2.1 Anomaly Detection Subsystem Mechanisms 44 11.1.2.2 Network Traffic Dashboard Subsystem Mechanisms 44 11.1.3 Performance Tests ... 45
11.1.3.1 Anomaly Detection Subsystem Performance Tests 45 11.1.3.2 Dashboard Subsystem Performance Tests 49 11.2 Scalability Evaluation ... 51
11.2.1 Anomaly Detection Subsystem Scalability Tests ... 51
11.2.2 Dashboard Architecture Subsystem Scalability Tests ... 52
12.
U
SEC
ASE#1
O
PEN ISSUES,
DEVIATIONS AND FUTURE DEVELOPMENTS54
12.1 Building of a ground truth based on ONTS traces for security tools assessment ... 5412.1.1 Lack of ground truth for network anomaly detection ... 54
12.1.2 Building of two ground truths based on ONTS traces ... 54
12.2 Dashboard Future Developments ... 55
13.
R
EFERENCES56
A
NNEXA
:
U
SEC
ASE#1
U
SER STORIES58
A
NNEXB
:
D
OCUMENTATION OFORUNADA
PACKAGE60
B.1 Input dataset ... 60B.2 Content of the package ... 60
B.3 Requirements ... 60
B.4 Arguments ... 60
B.5 How to run ... 61
B.6 How to compile ... 61
B.7 Output ... 61
A
NNEXC
P
ROTOTYPE/D
EMO(U
SER VIEWS)
62
C.1 Login ... 62C.2 Administration Console ... 63
C.3 Real-Time general view ... 64
C.4 Real-Time Traffic/Flow Analysis ... 65
C.5 Forensic Traffic/Flow Analysis ... 67
List of figures
Figure 1: Dashboard UML Use Case Model. ... 21
Figure 2: Use Case #1 High-level Architecture ... 30
Figure 3: UC #1 Dashboard Functional View ... 31
Figure 4: UML specification of UC #1 on anomaly detection ... 32
Figure 5: Network traffic and anomaly detection dashboard architecture. ... 33
Figure 6: NetFlow classes. ... 34
Figure 7: Anomaly XML classes. ... 35
Figure 8: Get list of anomalies sequence diagram. ... 35
Figure 9: Controller classes. ... 36
Figure 10: Service classes. ... 37
Figure 11: Load PCAP file sequence diagram. ... 37
Figure 12: Download CSV sequence diagram. ... 38
Figure 13: Get top source IP sequence diagram. ... 38
Figure 14: Get top conversations sequence diagram. ... 39
Figure 15: Get list of anomalies sequence diagram. ... 39
Figure 16: ORUNADA execution time according to the micro-slot length ... 48
Figure 17. Mean number of points to add, remove or update at each update of the feature space partition according to the size of the micro-slot length ... 48
Figure 18: Dashboard Performance Test. ... 49
Figure 19: Dashboard performance test deploy. ... 50
Figure 20: CPU usage in the performance test. ... 50
Figure 21. ORUNADA-DGCA speed-up factor ... 51
Figure 22: Scalability test architecture. ... 52
Figure 23: Dashboard Architecture Subsystem Scalability Test. ... 53
Figure 24: Login view. ... 62
Figure 25: User view of the administration console. ... 63
Figure 26: Shared general view ... 64
Figure 27: Real-time traffic analysis view (1). ... 65
Figure 28: Real-time traffic analysis view (2). ... 65
Figure 29: Real-time flow analysis view. ... 66
Figure 30: Forensic functionality user view (1). ... 67
Figure 31: Forensic functionality user view (2). ... 67
Figure 32: Forensic functionality user view (3). ... 68
Figure 33: Anomalies user view (general). ... 69
List of tables
Table 1: ONTIC Use Case #1 ... 14
Table 2: Use Case #1 (DoW) − Epics − User Stories correlation ... 17
Table 3: Use Case UC#1-DB1. ... 22
Table 4: Use Case UC#1-DB2. ... 22
Table 5: Use Case UC#1-DB3. ... 23
Table 6: Use Case UC#1-DB4. ... 23
Table 7: Use case UC#1-DB5. ... 24
Table 8: Use Case UC#1-DB6. ... 24
Table 9: Use Case UC#1-DB7. ... 25
Table 10: Use Case UC#1-DB8. ... 25
Table 11: Use Case UC#1-DB9. ... 26
Table 12: Use Case UC#1-DB10... 26
Table 13: Use Case UC#1-DB11... 27
Table 14: Use Case UC#1-DB12... 27
Table 15: Use Case UC#1-DB13... 28
Table 16: Use Case UC#1-DB14... 28
Table 17: Use Case UC#1-DB15... 29
Table 18: Use Case UC#1-DB16... 29
Table 19: List of the features used according to the flow aggregation key ... 47
1. Acronyms and Definitions
1.1 Acronyms
Acronym Defined as
CSP Communication Service Provider
CSV Comma Separated Values
DoD Definition of Done
DoS Denial of Service
DoW Description of Work
DTD Document Type Definition
FNR False Negative Rate
FPR False Positive Rate
HTTP Hypertext Transfer Protocol
ICT Information and Communications Technology
IDGCA Incremental Density Grid-based Clustering Algorithm
IoT Internet of Things
IP Internet Protocol
ISP Internet Service Provider
JSON JavaScript Object Notation
ML Machine Learning
NA Network Administrator
NM Network Monitoring
ONTIC Online Network Traffic Characterization
ONTS ONTIC Network Traffic Summary
ORUNADA Online and Real-time Unsupervised Network Anomaly Detection Algorithm
PCAP Packet Capture
QoE Quality of Experience
QoS Quality of Service
RDBMS Relational Database Management System
REST Representational State Transfer
SQL Structured Query Language
TPR True Positive Rate
UC Use Case
UML Unified Modelling Language
US User Story
2. Purpose of the Document
Deliverable D5.4 purpose is to document the final set of requirements for Use Case #1 (Network Intrusion Detection) jointly with the design, implementation and validation of its corresponding prototype. Additionally, updates in the Use Case requirements are also shown.
The ONTIC Use Case development and implementation follows a customized version of the Scrum Agile methodology (as described in deliverable D5.1 [3]); therefore, the requirements are described as user stories.
The different sections in the document provide:
Introduction of Use Case #1 in terms of their application in CSP environments, operational goals and machine learning algorithms (section 7)
Use case #1 specification is described in section 8). Definitions of Done (DoD) are provided in (Annex A)
Use case #1 design is detailed in section 9.
Use case #1 implementation details are documented in section 10 . Use case #1 testing documentation is shown in section 11
3. Scope
This document provides information about Use Case requirements (as user stories) and corresponding prototype implementation. Therefore, it is not expected to provide description of algorithms descriptions or a description of the ONTIC Big Data Architecture, as there are specific deliverables for said topics (D3.2 and D4.2, and D2.3, respectively), unless absolutely needed for the understanding of the Use Case implementation.
4. Intended Audience
The intended document audience includes not only all the partners in the ONTIC consortium (especially those involved in gathering requirements, and in designing, implementing and validating the prototypes) or the receivers of the project. It also includes any reader interested in understanding the ONTIC Use Cases and the business principles that guide the research within the project.
5. Suggested Previous Readings
It is expected that a basic background on Information and Communications Technology (ICT) is sufficient to address the contents of this document; however, some previous readings are suggested:
ONTIC. “Deliverable D4.2. Algorithms Description” [1].
ONTIC. “Deliverable D4.3. Experimental Evaluation of Algorithms for Online Network Characterization” [2].
ONTIC. “Deliverable D5.1. Use Case Requirements” [3]. ONTIC. “Deliverable D5.2. Progress on Use Cases [4].
6. Executive Summary
In the context of network management and engineering, ONTIC initially identified (in the DoW) three scenarios to address network issues of increased importance. During the project’s first year, the initial Use Cases were refined and assigned a specific slogan: (UC #1) Network Anomaly Detection; (UC #2) Adaptive Quality of Experience (QoE) Control; and (UC #3) Proactive Congestion Detection and Control Systems. During the project’s second and third year, the Use Case requirements have been further refined and the functionalities required have been implemented at a system level.
Use Case #1 aims at providing a system able to perform online network traffic monitoring for detecting in real-time network anomalies. For enhancing its applicability in realistic ISP/CSP network environments, Use Case #1 defines a scenario in which automatic anomaly detection is embedded within an administrator-oriented network supervision tool. This way, network traffic and potential anomalies can be analysed and traced back if required through a set of integrated visual interfaces fitting the every-day practices of network administrators. As such, UC #1 encompasses two subsystems: The Anomaly Detection Subsystem and the Analytic Dashboard Subsystem. This Deliverable presents the specification, design, implementation and evaluation of these subsystems.
The results show valid and scalable performance. And equally important, that system design and implementation can sufficiently resolve the critical challenge of timely synchronization –within real-time response constraints- between independent applications and processes that have to work on Big Data and share produced results and alarms.
7. Use Case #1 Environment
7.1 Overall
ONTIC has specified a number of uses cases for exhibiting the application of its results in CSP (Communication Service Providers) environments. The purpose is to show via close-to-the-market Use Cases that the proposed off/on-line machine learning (ML) algorithms for traffic analysis provide effective and efficient solutions to critical problems of concern to CSP’s such as network security, congestion avoidance and QoE management.
This chapter outlines the Use Case #1 considered by the project in terms of its application context in CSP environments, operational goals and ML algorithms used. These aspects are summarized in Table 1. A detailed description of the Use Case including system model, evaluation scenarios and current status of development, is presented in chapter 8. A comprehensive review of the relevant state of art was included in the previous versions of the deliverable, D5.1 [3] and D5.2 [4].
Use Case Goal Machine Learning
Algorithms/Frameworks Reference
#1 Network Anomaly Detection
Detect anomalous flows in real-time through online monitoring and traffic analysis and offer an user interface that enable network administrators a deep traffic analysis. Online real-time unsupervised network anomaly detection algorithm (ORUNADA) D4.2, section 5
Table 1: ONTIC Use Case #1
UC #1 aims at protecting network resources and applications from malicious attacks. This problem is of key for CSPs given the continuous increase of Internet traffic and the vast expansion of networks of smart mobile devices of any kind. Evidently, these factors amplify opportunities and combinations for launching well-hidden attacks at wide range. This use case presents a typical field for applying innovative ML algorithms. It is only that such algorithms can analyse the wealth of information hidden in network traffic traces and see how traffic information evolves over time, thus enabling the identification of potential anomalous flows.
It is also important to stress that UC #1 is an actual implementation at network operation level of the algorithms developed in the scientific work packages. By combining ML and telecom expertise, this use case provides for a comprehensive network supervision interface fitting current network administration practices. At the same time, it allows for asserting network anomalies spotted by the intelligent ML detection systems by checking their validity against actual network performance.
The following points are worth mentioning.
The problems addressed by the use cases are of vital importance to CSP’s especially nowadays where we witness an explosion of mobile devices and data-demanding services and applications, indicatively it is possible to mention IoT applications. UC #1 in particular aims at protecting resources and applications from malicious attacks.
The application of innovative ML algorithms for improving the performance of core network operations is currently gaining momentum. Although ML algorithms for network traffic classification are an active research topic, their integration in closed control loops with the
available network/service management systems in CSP’s is generally missing. Existing control systems rely on aggregated metrics (totals, averages, min/max) and, as such, they do not exploit the wealth of evolving structural information that could be extracted from analysing raw monitored data based on ML techniques. The ONTIC use cases pave the way in this direction; their practical deployment in CSP’s has been discussed in the architectural deliverable, D2.3 [5]. Note that the increasing adoption of Big Data technologies by CSP’s, even as an alternative data warehouse, facilitates the deployment of the ONTIC algorithms.
Last but not least, the Use Case #1 combine ML and telecoms expertise, which is well represented in the ONTIC consortium by the mix of academic and industrial partners, respectively. Such a combination is outmost essential since it is commonly recognized that the application of ML algorithms in specific domains needs to utilize intimate knowledge of the domain itself. ML algorithms assume a generic, domain-agnostic, input model –a space of points with attributes- which obviously needs to be customized to specific application needs. This customization becomes even crucial for the application of ML traffic analysis algorithms in CSP domains since yielded analytics may trigger actions that impact on network performance, quality of the offered services and customer experience.
7.2 Use Case #1 - Network Anomaly Detection Context and Scope
UC #1 aims at designing a system able to perform online monitoring and analysis of network traffic for detecting in real-time network anomalies. As already described in deliverable D5.1 [3], the related literature refers to two kinds of ML approaches for anomaly detection: The first one leverages previously acquired knowledge as signatures or statistical models drawn from supervised learning-based approaches. The second one does not consider any acquired knowledge or training stage for initiating and configuring the detection system and its constituting algorithms. All knowledge is produced online by monitoring and analysing network traffic. Unsupervised learning algorithms are well fitted for the current fast-pacing Internet environment as already outlined previously and explained further below.The context and objectives of UC #1 as explained in D5.1 can be summarized as follows:
Anomalies (including attacks) are a moving target, as new anomalies and attacks arise every day. Network traffic is also constantly evolving with new applications and services appearing very frequently. The detection of new unknown anomalies (called 0d anomalies) in this changing environment is essential, and an objective of the ONTIC project. The signature- and supervised learning-based approaches cannot fulfil these requirements, since signatures and traffic statistical models have to be humanly produced, in an offline way, thus leading to long delays and cost. In addition, supervised learning approaches require training before the detection phase, which in turn requires labelled traffic traces, containing labels for all applications and anomalies that need to be detected. Evidently, building labelled traces is a very time consuming task, while it is prone to errors that can impact on the performance of the detection system afterwards.
Traffic needs to be autonomously characterized and classified (as much as possible) in order to autonomously make a decision concerning the treatment to apply on the isolated traffic classes (legitimate or illegitimate). Relying solely on human network administrators for deciding whether a flow is legitimate leads to very poor temporal performances, and can even be useless if the attack finishes before the administrators can cope with it -attacks, for instance, are generally triggered at night, during days off, when very popular events arise, etc. that is, when network administrators are not supposed to be at work.
Network administrators need tools to detect and analyse anomalies. Such kind of tools will provide a graphical interface and be able to work in both online (real-time) and off-line (forensic) modes. At the same time, it should be able to provide detailed information about network traffic, detected anomalies, and the relationships between them.
Given the presented context and objectives, unsupervised learning is the only promising approach. UC #1 thus leverages the online unsupervised learning algorithms based on clustering developed in WP4 for building a system able to detect anomalies (including 0d ones) and apply countermeasures in real-time, autonomously, without relying on human network administrators, previously labelled traffic traces for training, or pre-determined anomaly signatures.
The system developed in UC #1 is practically needed by network administrators; they require a tool able to display traffic monitoring results, as well as able to detect anomalies, the strongest need being related to Denial of Service (DoS) attacks. Many commercial tools exist for that purpose, but they generally lack efficiency in terms of anomaly detection; they leverage very poor first order statistics that are absolutely not suited in the context of highly variable and versatile traffic nature. As a result, their ability to detect DoS attacks is rather limited leading to high false positive and false negative rates. For instance, this is the case of the recent AlienVault solution1, which aims at providing unified security monitoring, security events management and reporting and continuous threat intelligence as well as multiple security functions. However, it lacks real-time features and does not work in an autonomous way. Thus, it keeps on leaving most of the work to the network administrator and shows a limited usefulness.
With its ONTIC real-time unsupervised network anomaly detection algorithm, the UC #1 system is able to fix the flaws of tools such as AlienVault. It does so by providing a fully real-time, scalable and autonomous monitoring and anomaly detection tool, able to autonomously trigger counter-measures for security purposes. It is described in the reminder of this deliverable.
1 https://www.alienvault.com/products
Indeed, only the demo version of the tool was tested and evaluated, as the price of the tool was not affordable.
8. Use Case #1 Specification
8.1 Use Cases, epics and user stories
In this section we provide a detailed description of the scenario addressed by ONTIC for the Use Case #1 (Network Anomaly Detection) by means of user stories.
In accordance with the Agile methodology, the use cases have been turned into so-called epics (high level user stories) and subsequently into user stories. The user stories have been refined throughout the project development and this document contains the final version of them.
Use Case (ONTIC DoW)
Epic
(as translated in project execution time)
User Stories (as working items)
UC #1 - Network Anomaly Detection
User Story 1 (UC #1): As a CSP or ISP network administrator, I want an autonomous method for detecting analysing and characterizing traffic
anomalies, so that it makes it possible to autonomously and efficiently manage them.
US 1.1
As a CSP or ISP network administrator, I want a mining mechanism, so that traffic
classes can be autonomously distinguished. US 1.2
As a CSP or ISP network administrator, I want a discrimination mechanism so that
anomaly signatures can be autonomously issued.
US 1.3
As a CSP or ISP network administrator, I want a ranking score for assessing the
abnormality and dangerousness of
anomalies, so that an autonomous process can discard false attacks and chase
legitimate anomalies. US 1.4
As a CSP or ISP network administrator, I want to have monitoring and analysis tools
and exchange formats, so that the results from traffic monitoring and anomaly detection algorithms can be displayed and analysed both live and retrospectively. Table 2: Use Case #1 (DoW) − Epics − User Stories correlation
8.2 UC #1 (User Story 1): Network Anomaly Detection
8.2.1 Scenario description
Network anomaly detection is a vital component that must exist in any network in today’s Internet. Ranging from non-malicious unexpected events such as flash-crowds and failures, to network attacks such as denials-of-service and network scans, network traffic anomalies can have serious detrimental effects on the performance and integrity of the networks. The principal challenge in automatically detecting and characterizing traffic anomalies is that these are moving targets. It is difficult to precisely and permanently define the set of possible anomalies that may arise, especially in the case of network attacks, because new attacks as well as new variants of already
known attacks are continuously emerging. A general anomaly detection system should therefore be able to detect a wide range of anomalies with diverse structures, using the least amount of previous knowledge and information, ideally none.
ONTIC UC #1 designed a new autonomous anomaly detection system based on original unsupervised machine learning algorithms designed for that purpose. The most important feature of the anomaly detector is that it does not rely on previously acquired knowledge nor it needs any training phase or labelled data, while it is expected not to leverage in most of the cases on human operators for making decisions on the status of detected anomalies (legitimate vs. attack or intrusion for instance). It aims also at triggering the appropriate counter-measures in most cases. However, as the project research results in WP4 highlight, it is not possible for the anomaly detection to autonomously make decisions for every anomaly. Therefore, a tool for a human administrator to make a decision on whether a spotted anomaly is legitimate or not; and, subsequently apply the suited counter-measure is needed. The new functionality that is required, and has been added in the design of the new anomaly detection system, is a network traffic analytics dashboard. It aims at providing human administrators with the appropriate information elements from the detection algorithms to decide what to do. The dashboard provides two sets of information:
Legacy monitoring information on the flowing traffic.
The characteristics of the detected anomalies as determined by the employed autonomous traffic clustering algorithm, as well as traffic statistics associated to the period during which the anomalies have been detected.
In any case, the range of possible anomalies is too large and sometimes the anomalies automatically detected are unclear or even unknown. Therefore, network administrators need an information system that enable them to know the status of the network at any time and also to detect network incidents. With the help of such an information system, they could perform detailed analysis and make quick and effective decisions. The most appropriate solution to meet this need is an application in the form of a network traffic analytics dashboard. This application should provide detailed information on both network traffic and anomaly detection as well as enable visualization and analysis, both in real time (on-line) for making decisions timely and in "forensic" (off-line) mode for allowing further analysis.
8.2.2 User Requirements
The functional specification for UC #1 is described as a set of user stories exposed below:
As a CSP or ISP network administrator, I want an autonomous method for detecting and characterizing traffic anomalies, so that it makes it possible to autonomously and efficiently manage them.
o User Story 1.1: As a CSP or ISP network administrator, I want a mining mechanism, so that traffic classes can be autonomously distinguished.
• User Story 1.1.1: As a CSP or ISP network administrator, I want to have efficient monitoring, unsupervised clustering techniques and related analytics, so that I can autonomously classify network traffic. →Implementation done
o User Story 1.2: As a CSP or ISP network administrator, I want a discrimination mechanism, so that anomaly signatures can be autonomously issued.
• User Story 1.2.1: As a CSP or ISP network administrator, I want to have mechanisms for identifying the most significant traffic attributes, so that it becomes possible to issue traffic class discrimination rules. → Implementation done
o User Story 1.3: As a CSP or ISP network administrator, I want a ranking score for assessing the abnormality and dangerousness of anomalies, so that an autonomous process can discard false attacks and chase legitimate anomalies
• User Story 1.3.1: As a CSP or ISP network administrator, I want to have accurate abnormality scores, so that it becomes possible to autonomously discriminate between legitimate and illegitimate traffic classes. → Implementation done
o User Story 1.4: As a CSP or ISP network administrator, I want to have monitoring and analysis tools and exchange formats, so that the results from traffic monitoring and anomaly detection algorithms can be displayed and analysed both live and retrospectively
• User Story 1.4.1: As a CSP or ISP network administrator, I want to have a data network traffic analytics dashboard to show traffic and flow statistics, anomaly detection details, etc., so that I will be able to analyse data traffic features and study in depth the anomalies detected.
- User Story 1.4.1.1: As a CSP or ISP network administrator, I want to get traffic analysis charts, so that I can have a well-aimed knowledge about the state of the network.
» User Story 1.4.1.1.1: As a CSP or ISP network administrator, I want to get a Real-Time traffic analytics visualization tool, so that I can view overall traffic statistics regarding IPs, ports, type of service, bytes, etc.
→ Implementation finished.
» User Story 1.4.1.1.2: As a CSP or ISP network administrator, I want to get a real-time flow analysis tool, so that I can view precise statistics related to traffic flows, such as conversations. → Implementation finished.
» User Story 1.4.1.1.3: As a CSP or ISP network administrator, I want the anomaly detection tool to show a warning message whenever an anomaly has been detected, so that I can become aware of potential abnormal situations any time they happen and obtain further information by accessing the tool.
→ Implementation finished
» User Story 1.4.1.1.4: As a CSP or ISP network administrator, I want to be able to specify the time window of the traffic analysis by choosing a specific number of minutes back from current time, so that I have a flexible way for seeing the network situation and the evolution of traffic in short term intervals and for getting further details regarding the spotted anomaly and any relevant event instantly.
» User Story 1.4.1.1.5: AS a CSP or ISP network administrator, I want to be able to select a specific date and a time period to see all network information available (traffic and anomalies) both in dynamic and in static modes, so that I can make in-depth forensic analysis based on historical data.
→ Implementation finished.
- User Story 1.4.1.2: As a CSP or ISP network administrator, I want to get an anomaly detection tool, so that whenever a traffic anomaly is detected I will be aware of it at once along with its details. → Implementation finished
- User Story 1.4.1.3: As a CSP or ISP network administrator, I want to have a set of administration procedures, so that it is possible to manage and configure different system features.
→ Implementation finished.
- User Story 1.4.1.4: As a CSP or ISP network administrator, I want to have a login/password authentication procedure, so that it is possible to prevent unauthorized parties from accessing the anomaly detection tool.
→ Implementation finished
- User Story 1.4.1.5: As a CSP or ISP network administrator, I want to have a comprehensive system view to be always displayed in a shared screen (a video-wall for instance), so that the whole team of network administrators can have a general view about the network status and be warned of any incidence in real time.
→ Implementation finished.
- User Story 1.4.1.6: As a CSP or ISP network administrator, I want to be automatically informed when a new anomaly is detected by the system, so that I can reduce the time to check the anomaly and manage the alert properly.
→ Implementation finished.
- User Story 1.4.1.7: As a CSP or ISP network administrator, I want to generate technical reports with the dashboard information, so that I can select a specific time period and generate an electronic document including traffic information and all anomalies detected during that period.
→ Implementation finished.
- User Story 1.4.1.8: As a CSP or ISP network administrator, I want to export stored data in the system in a well-known interchangeable file and data-type formats, so that I can further analyse dashboard data with other more powerful analytics tools.
→ Implementation finished.
8.2.3 Requirement Specification
8.2.3.1 Anomaly Detection Subsystem Requirement Specification
The Anomaly Detection Subsystem is based in the implementation of ORUNADA algorithm described in the last version of the ONTIC deliverable D4.2 [1] provided in June 2016. Note that a new version of ORUNADA is being designed and developed nowadays, and it is described in
deliverable D4.3 [2]. This new version is due to the fruitful collaboration between ONTIC and the H2020 ENDEAVOUR project. IBM, one of the ENDEAVOUR partners, requires efficient anomaly detection tools, with very strong throughput constraints, i.e. much larger than the ones that were targeted in ONTIC Use Case #1. D4.3 [2] presents the implementation of this new ORUNADA version and its first performance evaluation results. In this deliverable, the target is to cope with the traffic of the SATEC datacentre. Given the traffic constraints, as well as the ONTIC schedule, the version that has been developed for Use Case #1 is the one described in deliverable D4.2 [1]. Four Use Case #1, the main requirements of ORUNADA and its implementation are the following:
Detecting and characterizing anomalies from traffic captured at the PCAP format.
Generating reports with the characteristics of the detected anomalies. Reports are coded in XML format.
Detecting anomalies and providing reports in online mode. Executing in near real-time.
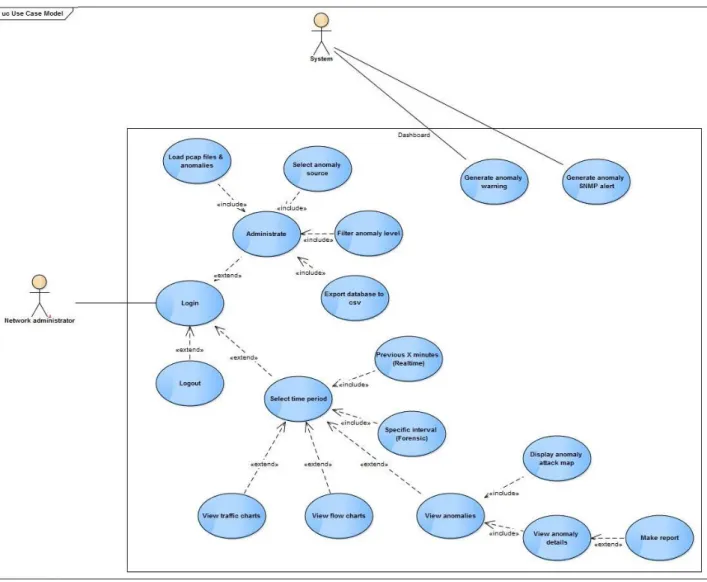
8.2.3.2 Dashboard Subsystem Requirement Specification
The requirement specification for the Dashboard subsystem corresponds to user story 1.4 and has been expressed with the UML (Unified Modeling Language) Use Case model shown in Figure 1.
The model is driven by to actors: “Network Administrator” (as the user of the subsystem) and “System” (as the internal control).
The Use Case descriptions are defined in the following tables:
Use case ID UC#1-DB1
Use Case Name Login
Description Network Administrator enters the system by means of a password Primary actor Network Administrator
Preconditions N/A
Post-conditions The administrator is logged into the system
Basic flow 1. Administrator enters his/her ‘user’ and ‘password’ into the login form
2. Administrator clicks on the ‘sign in’ button 3. Administrator enters the dashboard
Alternate flow 3a. ‘user’ and/or ‘password’ are wrong, so the administrator is asked to introduce them again in the form
Table 3: Use Case UC#1-DB1.
Use case ID UC#1-2
Use Case Name Load PCAP file and anomalies
Description Network administrator enters the admin section and chooses a PCAP file to analyse it and load in the database.
Primary actor Network administrator
Preconditions The administrator must be logged into the system and in the admin panel
Post-conditions The chosen PCAP file will start being loaded in the database. This process takes a few minutes to complete
Basic flow 1. Administrator clicks "load Pcap" button located in the lower right corner.
2. Administrator selects the PCAP file from the select box item 3. Administrator clicks on the ‘load PCAP’ button
4. System converts PCAP records into NetFlow records and send it to the process pipeline (filter, enrich, analyse, store, …)
Alternate flow N/A
Use case ID UC#1-3
Use Case Name Select anomaly source
Description Network administrator enters the settings section (menu located on the upper right corner) and selects any of the anomaly sources available
Primary actor Network administrator
Preconditions The administrator must be logged into the system and in the admin panel
Post-conditions The chosen option will be used in the dashboard as the anomaly source
Basic flow 1. Administrator clicks the settings section in the menu
2. Administrator selects the anomaly source from the select box item 3. Administrator clicks on the ‘Change’ button
4. The selected source will be used in the dashboard to read anomalies from.
Alternate flow N/A
Table 5: Use Case UC#1-DB3.
Use case ID UC#1-4
Use Case Name Filter anomaly level
Description Network administrator enters the settings section (menu located on the upper right corner) and selects an anomaly critical level from a relevant menu in order to filter the anomalies to display
Primary actor Network administrator
Preconditions The administrator must be logged into the system and in the admin panel
Post-conditions The chosen option will be used in the dashboard to filter anomaly per level of importance
Basic flow 1. Administrator clicks the settings section in the menu
2. Administrator selects the anomaly level from the select box item 3. Administrator clicks on the ‘Change’ button
4. The selected level will be used in the dashboard to filter the anomalies to show.
Alternate flow N/A
Use case ID UC#1-5
Use Case Name Export database to CSV
Description Network administrator enters the Export section (menu located on the left side); selects type of data records to be exported (anomalies or NetFlows) and selects a period of time that wishes to download data for (as CSV file).
Primary actor Network administrator
Preconditions The administrator must be logged into the system and in the admin panel
Post-conditions N/A
Basic flow 1. Administrator clicks the Export section in the menu on the left. 2. Administrator selects the type of data to be exported (NetFlow or
anomalies) from the select box item.
3. Administrator selects the period using the calendar boxes 4. Administrator clicks on the ‘Download’ button
5. The generated CSV file will begin downloading Alternate flow N/A
Table 7: Use case UC#1-DB5.
Use case ID UC#1-6
Use case Name Previous X minutes (Real-time)
Description Network administrator selects the last 5, 15, 30, … minutes (counting from the current moment) to display data in the dashboard
Primary actor Network administrator
Preconditions The administrator must be logged into the system
Post-conditions The dashboard is set to Real-time mode, displaying data that is being read at the moment from the network link.
Basic flow 1. Administrator selects real time mode clicking RT button located on the lower right corner.
2. Administrator clicks the desired option from the menu “select last minutes”: ‘5 min’, ‘15 min’, ‘30 min’, etc.
3. Data corresponding to the last X minutes will be displayed. Alternate flow N/A
Use case ID UC#1-7
Use Case Name Specific time interval (for Forensics)
Description Network administrator selects the specific period to display data in the dashboard.
Primary actor Network administrator
Preconditions The administrator must be logged into the system
Post-conditions The dashboard is set to forensic mode, displaying past data that is stored in the database
Basic flow 1. Administrator clicks the ‘Forensic’ option (FO button) from the menu located on the lower right corner.
2. Administrator selects the period using the calendar boxes.
3. Administrator chooses the option (on, off) to configure a minimum interval to display.
4. Administrator clicks on the play button to start the simulation 5. Data corresponding to the desired periods will be displayed,
refreshing every X seconds, till the 100% of the period is covered 6. Administrator can pause, go forward/backward or stop the
simulation at any moment.
7. Administrator can select the simulation speed (x1, x2, x4 or x8) Alternate flow 2a. The beginning of the period is a later date than the end, then the
calendar boxes are cleared and the administrator is asked again to set a period
3a. When minimum interval has been set to on the administrator sets in the input bar the number of seconds that the charts will be
refreshing over and over.
Table 9: Use Case UC#1-DB7.
Use case ID UC#1-8
Use Case Name View traffic charts
Description Network administrator visualizes charts related to network traffic Primary actor Network administrator
Preconditions The administrator must be logged into the system Post-conditions N/A
Basic flow 1. Administrator clicks the ‘Traffic analysis’ option from the menu located on the left side.
2. The traffic charts panel will be displayed Alternate flow N/A
Use case ID UC#1-9
Use Case Name View flow charts
Description Network administrator visualizes charts related to network traffic at flow level, as conversations.
Primary actor Network administrator
Preconditions The administrator must be logged into the system Post-conditions N/A
Basic flow 1. Administrator clicks the ‘Flow analysis’ option from the menu located on the left side.
2. The flow charts panel will be displayed Alternate flow N/A
Table 11: Use Case UC#1-DB9.
Use case ID UC#1-10
Use Case Name View anomalies
Description Network administrator visualizes the list of all the anomalies detected Primary actor Network administrator
Preconditions The administrator must be logged into the system Post-conditions N/A
Basic flow 1. Administrator clicks the ‘Anomalies’ option from the menu located on the left side.
2. The anomalies panel will be displayed Alternate flow N/A
Use case ID UC#1-11
Use Case Name Display anomaly attack map
Description Network administrator keeps track in real-time of the attacks happening, geo-localized in a world map, in a separate window Primary actor Network administrator
Preconditions The administrator must be logged into the system and in the anomalies panel
Post-conditions N/A
Basic flow 1. Administrator clicks the ‘Attack map’ button located on the upper right corner.
2. The attack map window is prompted Alternate flow N/A
Table 13: Use Case UC#1-DB11.
Use case ID UC#1-12
Use Case Name View anomaly details
Description Network administrator digs into the details of an anomaly, i.e. examines traffic charts during the anomaly’s period
Primary actor Network administrator
Preconditions The administrator must be logged into the system and in the anomalies panel
Post-conditions N/A
Basic flow 1. Administrator clicks the anomaly from the list. 2. The anomaly details are prompted
Alternate flow N/A
Use case ID UC#1-13
Use Case Name Make report
Description Network administrator generates a report with the details of an anomaly
Primary actor Network administrator
Preconditions The administrator must be logged into the system, in the anomalies panel and in the details of an anomaly
Post-conditions N/A
Basic flow 1. Administrator clicks the anomaly from the list (Anomalies view). 2. Administrator clicks the ‘Report (pdf)’ button.
3. The report with the details of the anomaly is downloaded as pdf.
Alternate flow N/A
Table 15: Use Case UC#1-DB13.
Use case ID UC#1-14
Use Case Name Generate anomaly warning
Description The dashboard displays a popup for every newly detected anomaly Primary actor The system
Preconditions The administrator must be logged into the system Post-conditions N/A
Basic flow
1. The dashboard shows a warning popup.
Alternate flow 1a. Administrator can click on the warning to go to the anomalies panel
Use case ID UC#1-15
Use Case Name Generate anomaly SNMP alert
Description The system sends a SNMP trap every time a new anomaly is detected to the SNMP client which in turn might send an email to the network administrator, for instance
Primary actor The system Preconditions N/A
Post-conditions N/A
Basic flow
1. The system sends a trap to the SNMP client if a new anomaly is
detected
Alternate flow 1a. The SNMP client could send an email to the administrator
Table 17: Use Case UC#1-DB15.
Use case ID UC#1-16
Use Case Name Logout
Description Network administrator leaves the dashboard Primary actor Network administrator
Preconditions The administrator must be logged into the system Post-conditions The administrator is logged out the system
Basic flow
1. Administrator clicks ‘Logout’ option in the menu located on the upper
right corner
Alternate flow
9. Use Case #1 Design
9.1 System model
9.1.1 Functionalities
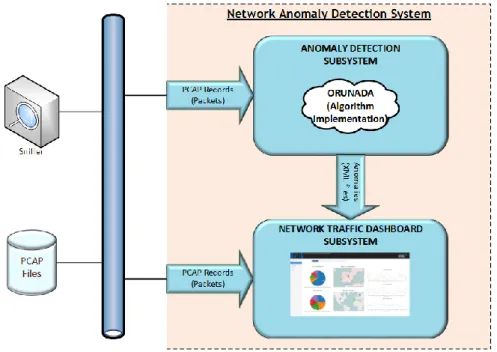
Based on the specification of the user stories US 1.1 through US 1.4, two main system functions are provided: (a) an autonomous system for detecting and characterizing traffic anomalies, making it possible to autonomously and efficiently manage them: the Anomaly Detection Subsystem, and (b) a dashboard for enabling network operators to get detailed information about network traffic features and statistics, near real-time, anomalies detected and traffic behaviour during the periods in which the anomalies are detected: the Network Traffic Dashboard Subsystem.
Figure 2 represents the high level working schema of the UC #1 system. PCAP files, containing traffic traces, provide input to both subsystems −the anomaly detection and the dashboard subsystems. The results of the anomaly detection process are fed, in the form of XML files, to the dashboard for further investigation and permanent store.
Figure 2: Use Case #1 High-level Architecture
The Anomaly Detection Subsystem analyses currently flowing network traffic that is captured at the PCAP format by applying the ORUNADA unsupervised anomaly detection algorithm, presented in deliverable D4.2 [1]. When it detects an anomaly, it sends an XML file to the Network Traffic Dashboard Subsystem. The file contains the characteristics of the detected anomaly, for display purposes and for autonomously launching counter-measures, if required.
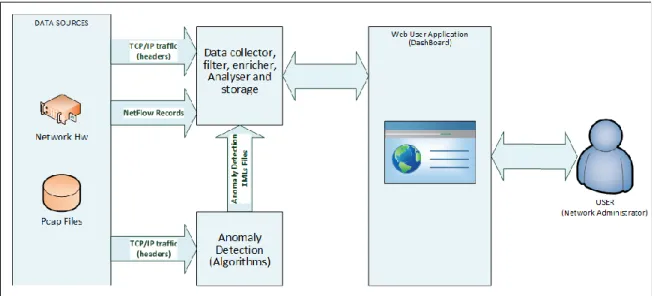
The Network Traffic Dashboard Subsystem entails the following functionalities (Figure 3):
Ingesting captured network traffic traces, near real-time, at different formats (PCAP and NetFlow) and from different sources, through a scalable software system that can elastically scale with the incoming traffic rate. When no NetFlow input source is available, the system translates PCAP into NetFlow and injects the resulted NetFlow streams as a new input data source. For scalability reasons, the system is designed to process traffic traces
at flow level (NetFlow) rather than at raw packet level (PCAP) since flow traces aggregate packet traces without losing information.
Receiving data from external analysis systems, for example, analysis results about anomalies from the Anomaly Detection Subsystem (XMLs files), or other traffic analytics systems.
Translating received raw data (PCAP, NetFlow, XMLs with anomaly analysis results, etc.) into structured records as required for processing.
Storing all received data in an elastic data base and processing it in a scalable manner. Querying stored data and presenting the results in a structured way in graphical and/or in
tabular/alphanumeric forms.
Figure 3: UC #1 Dashboard Functional View
The output of the Network Traffic Dashboard Subsystem is a user web interface (network operator oriented) shown as an analytics dashboard which presents traffic analysis results in a structured way with graphics and tabular/alphanumeric data.
9.1.2 Software architecture
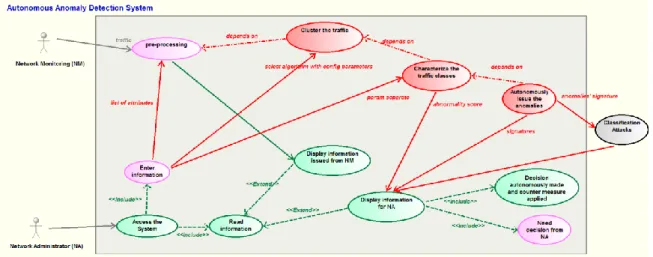
The software architecture and the relationships between the different components of the UC #1 system are depicted in the UML diagram shown in Figure 4.
The diagram also uses colours to distinguish contributions from different work packages:
Modules in red are those developed in WP4 on online clustering algorithms for anomaly detection;
Modules in green and pink implement the Network Traffic Dashboard Subsystem; they handle pre-processing of traffic data, computation of statistics, processing of anomaly detection reports, and visualization of statistics and anomaly detection information. Green modules need the intervention for an external actor;
Modules in grey are components not directly under the scope of this use case, but included as they can significantly improve the use case demonstration.
Figure 4: UML specification of UC #1 on anomaly detection
This UML diagram shows two main threads: one in charge to information processing and results presentation, and other handling anomaly detection.
The information processing and results presentation thread is devoted to traffic monitoring and real-time results display in the Network Traffic Dashboard Subsystem. It comprises two modules:
1. Display information from NM (Network Monitoring): It is fed with processed traffic records (generated by the “pre-processing” module) and anomaly classification results (provided by the “classification” module) and performs the necessary computations for issuing a real-time display of selected features regarding traffic flows and detected anomalies)
2. Display information for NA (Network Administrator): It gets information from the clustering algorithms used to detect traffic anomalies And displays live in the Network Traffic Dashboard Subsystem the characteristics of the identified traffic classes, the abnormality scores, and the results of attack classification in order to help the network administrator to make a decision (“Need decision from NA” module). If the Anomaly Detection Subsystem can autonomously make the decision, the Network Traffic Dashboard Subsystem will display that a corrective action has been taken, for example, it will display a text alert saying “Decision autonomously made and counter measure applied”, along with details about the measure applied.
The anomaly detection thread comprises the modules implementing the core anomaly detection algorithm. Specifically, it includes three main sequential steps: clustering the traffic, issuing the characteristics of the resulted traffic classes, and autonomously issuing the anomalies when autonomous detection is possible, otherwise leveraging found anomalies’ signature information (“Classification attacks” module).
9.1.3 Anomaly Detection Subsystem Design
The design and implementation of the unsupervised network anomaly detection algorithm, called ORUNADA, is presented in deliverable D4.2 [1]. Please also refer for a comprehensive description to the paper accepted for publication in IEEE Transactions on Network and System Management [15].
9.1.4 Network Traffic Dashboard subsystem Design
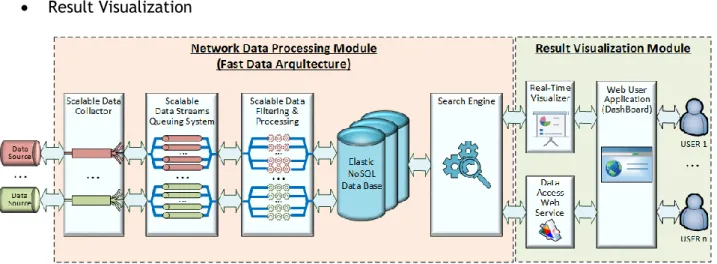
The general structure of the Network Traffic Dashboard Subsystem is depicted in Figure 5; it includes two modules:
Network Data Processing Result Visualization
Figure 5: Network traffic and anomaly detection dashboard architecture.
The architecture of the Network Data Processing Module is based in a "Fast Data Model" as described in a paper accepted and published in the IEEE International Conference on Digital Information Management [17], and it is made up of the following components:
A set of data traffic sources such as:
o ONTS (ONTIC Network Traffic Summary) data set [18][19]: PCAP files with captured traffic at raw packet level.
o Anomaly Detection Subsystem: XML files with information on the identified anomalies.
o Network hardware: NetFlow v5 records2.
Network Traffic Data Collector module: scalable pool of pipelines to pre-process input data. Pipelines are commonly associated to data sources. The following pipelines are implemented:
o PCAP pipeline: It reads PCAP files and converts TCP/IP headers to flows in NetFlow format.
o NetFlow pipeline: It receives NetFlow records through a defined UDP port and pre-processes these records, for example, for creating tuples with new conversations, and stores the resulted data in the database.
o Anomaly detection pipeline: It receives XML files from the Anomaly Detection Subsystem (from a commonly agreed file directory or through a Web Service implemented in the Network Traffic Dashboard Subsystem), parses the XML files (e.g. to discriminate between new and previous anomalies that continue active) and stores the results in the database.
Scalable NoSQL Database: to store data.
2
Search Engine: to provide data access and execute queries. The main components of the Result Visualization Module are:
Visualizer: a set of libraries to convert data to charts.
Data Access Web Service: an API to provide a query system over stored data.
9.1.4.1 Network Data Processing Module design
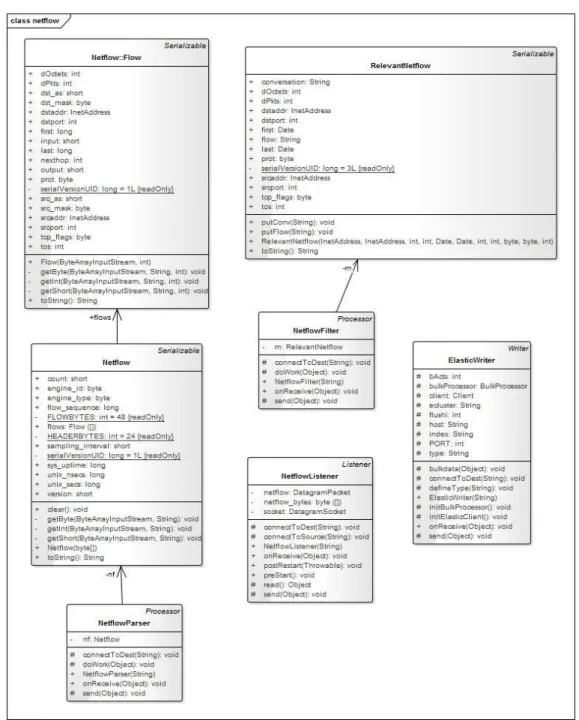
The Network Data Processing module is made up of a set of distributed parallel pipelines. It is described by both its UML class diagram and associated sequence diagrams:
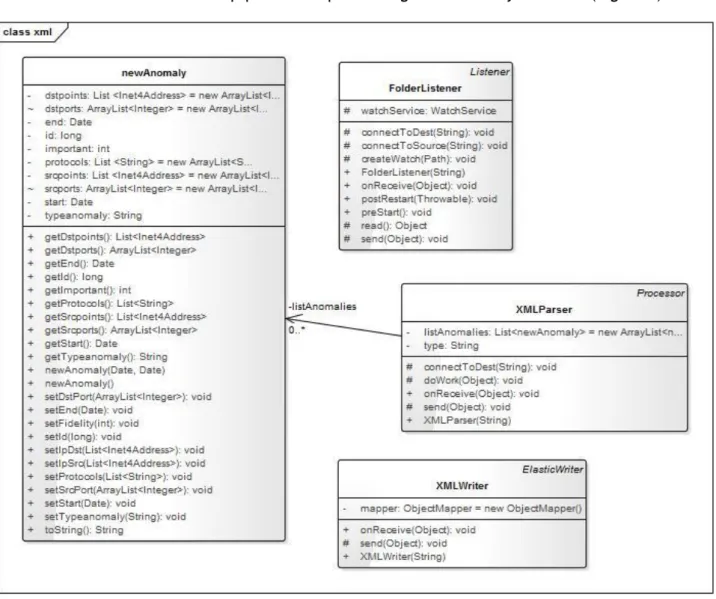
The pipeline responsible for processing NetFlow records consists of the following classes (Figure 6):
The classes behind the pipeline for processing XML anomaly files are (Figure 7):
Figure 7: Anomaly XML classes.
The way pipelines process their respective data sources is explained in the following sequence diagram (Figure 8):
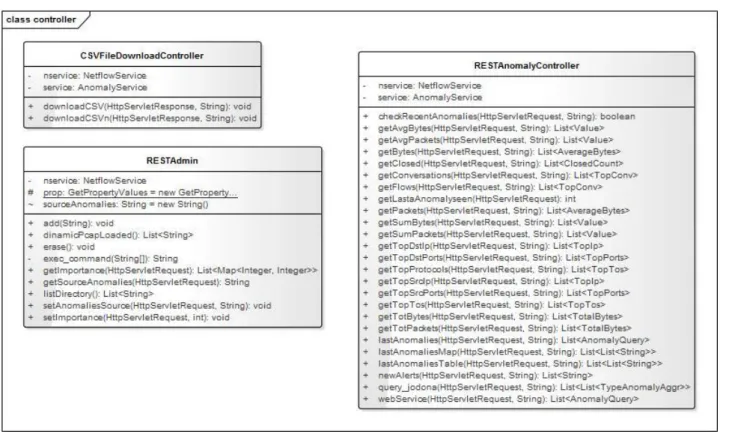
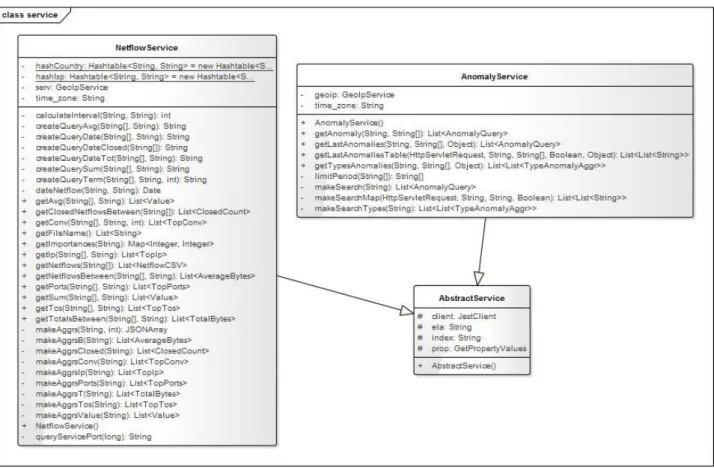
9.1.4.2 Result Visualization Module design
The Result Visualization module consists of a server that queries the Search Engine and a web client that converts received data into charts using a set of libraries.
The module is defined using UML class diagrams and sequence diagrams as presented in the following. The Controller classes realise the interface of the web client (Figure 9):
At request from the client, Controller classes call Service classes to query data from the database (Figure 10):
Figure 10: Service classes.
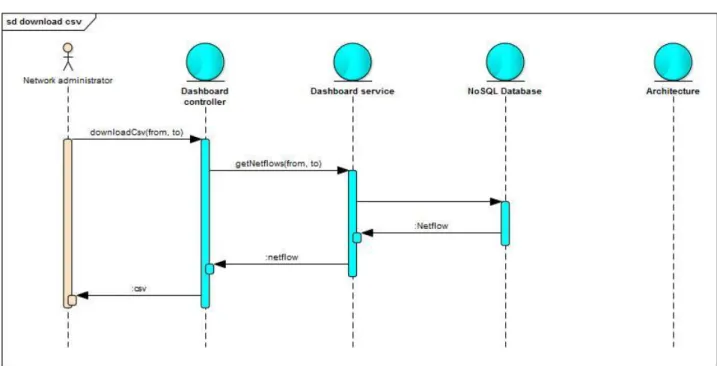
Among the many use cases related to the operation of the Result Visualization module, indicative examples include:
Load NetFlow records in the database from a PCAP file (Figure 11):
Dump database as CSV file (Figure 12):
Figure 12: Download CSV sequence diagram.
Get top 5 source IPs (Figure 13):
Get top 5 conversations (Figure 14):
Figure 14: Get top conversations sequence diagram.
Get list of all anomalies (Figure 15):
10. Use Case #1 Implementation
10.1.1 Anomaly Detection Subsystem implementation
As already stated, the ORUNADA algorithm developed in WP4 and described in [1] is in charge of analysing the incoming traffic and detecting anomalies. To cope with the real-time constraints for this kind of analysis, the ORUNADA algorithm takes advantage of:
A sliding window that shifts frequently from one micro-slot to the other, for allowing enough traffic data to be passed within each window as required for accurate detection results, without delaying processing more than the duration of one micro-slot;
IDGCA (Incremental Density Grid-based Clustering Algorithm) for fast computations in the framework of small traffic window shifts;
An exhaustive and free of redundancy list of 18 traffic features relevant for detecting network attacks.
ORUNADA has been implemented in Java v1.8 (see code repository in
https://gitlab.com/ontic-wp4/ORUNADA
). ORUNADA detects anomalies based on traffic inputs supplied in PCAP files in acontinuous way. It also generates signatures to describe identified anomalies.
ORUNADA outputs on the standard output information about its execution. It also creates an XML file for each micro-slot processed (apart for the n first micro-slots, n equals to the number of micro-slots in a window). This XML lists the anomalous flows found in the PCAP file at the end of each micro-slot considering the packets contained in the current window. For each anomalous flow it specifies its features, its score of dissimilarity and its signature.
10.1.2 Network Traffic Dashboard Subsystem implementation
The Network Traffic Dashboard Subsystem implements an ISP/CSP network administration-oriented tool that provides online (real-time) and offline (forensic analysis) traffic monitoring and analysis capabilities, as well as anomaly detection.
The subsystem uses captured traffic datasets (in PCAP or NetFlow v5 format) and the XML output of the Anomaly Detection Subsystem with information on identified anomalous flows. As outlined in section 9.1.4 these input sources are processed through the Network Data Processing module in a series of four functional stages: ingestion, parsing, filtering and storage. Finally, the Result Visualization module queries the stored data to display analytics in real-time on a web interface. Such a scenario requires the Network Data Processing and Result Visualisation modules to support a series of operational characteristics related to performance and scalability requirements in order to cope with the challenges pertinent in realistic deployment, i.e. monitoring and analysing traffic from real network links. Such characteristics include: sustain high volumes of input data without losses, engage parallel processing of all input streams in a distributed, scalable and highly available manner in order to achieve near real-time performance. Hence, the Network Data Processing module must be able to handle increased volumes of work load, which means it should be able to optimise its performance accordingly by engaging more/less resources (scale-up/down). A library like Akka comes in handy for such expectations. Akka is a Java library that relies upon the so-called Actor Model to build applications. This model offers features such as:
Asynchronous, non-blocking and highly performant message-driven programming model that ensures loose coupling, isolation and location transparency.
Very lightweight, event-driven processes (several million actors per GB of heap memory).
Responsive systems; Akka focuses on providing rapid and consistent response times so that it delivers a stable quality of service.
Highly-available and fault tolerant support systems, isolating components from each other and thereby ensuring that parts can fail and recover without compromising the system as a whole ("let it crash" model).
Elasticity or responsiveness under varying workloads. This is achieved by increasing or decreasing the processing, memory and disk resources allocated on commodity hardware by, for example, replicating components and distributing inputs among them.
Consequently, the Network Data Processing module was built on top of Akka library.
The point of convergence between the two modules comprising the Network Traffic Dashboard Subsystem is the database where data is stored and queried. Due to the need of horizontal scaling to clusters of machines, which is a problem for relational databases, plus the heterogeneity of the data structures used, and a bunch of fast operations required for achieving ear real-time processing (like complex searches), a NoSQL database suits better than a typical relational database.
Elasticsearch is a highly scalable full-text search and analytics engine. It allows to store, search, and analyse big volumes of data quickly and in near real-time. Thus, it can fit the requirements of the underlying engine/technology for powering the dashboard subsystem’s needs for storage and analysis.
Taking into account that the prototype environment does not provide a NetFlow input data source, the decision to integrate a module to generate NetFlow records from the PCAP file (in real-time) was made. This module works adding a NetFlow data stream as a new input data source to the Network Traffic Dashboard Subsystem.
10.1.3 Enabling technologies
The technologies, products, and libraries used for implementation are: Java3 (1.8 version) as programming language.
Akka library4 (2.4.7 Version) as support library for building concurrent and distributed applications.
Elasticsearch5 (2.2.0 version) as NoSQL Data Base.
Jest6 (2.0.0 version) a Java HTTP Rest client for Elasticsearch. Apache Kafka (0.10.1.0 version) as message broker.
3 https://www.java.com 4 http://akka.io/
5 https://www.elastic.co/products/elasticsearch
D3.js7 (3.5.12 version) / C3.js8 (0.4-10 version) / Leaflet9 (0.7.7 version) as JavaScript libraries for data visualizations.
Spring10 (4.2.8 version) as programming framework. jnetpcap11 (1.9 version) to process the PCAP files. libpcap12 (library used by jnetpcap).
10.1.4 API specification
The output interface defined for the Anomaly Detection Subsystem is a XML generator (it generates XML files periodically at specified time intervals). Each XML contains a list of attributes that define the anomalies detected in sliding time period (see section 10.1.1 ).
The Network Traffic Dashboard Subsystem processes the XML files as soon as they arrive. For this, two interface means are provided: through files written into a pre-defined directory or through a Web Service implemented in the Network Traffic Dashboard Subsystem.
The following Document Type Definition (DTD) describes the XML files sent by the Anomaly Detection Subsystem to the Network Traffic Dashboard Subsystem by defining the document structure with a list of legal elements and attributes. The DTD is associated to a particular XML document by means of a document type declaration (DOCTYPE):
<!DOCTYPE UNADA SYSTEM "/path/to/file.dtd"> <?xml version="1.0" standalone="yes" ?> <!DOCTYPE UNADA[
<!ELEMENT UNADA (signaturesOfAnomalies*,points*)> <!ELEMENT points (point+)>
<!ELEMENT point (val*)> <!ELEMENT val (#PCDATA)>
<!ELEMENT signaturesOfAnomalies (signatureOfAnAnomaly*)> <!ELEMENT signatureOfAnAnomaly (rule+)>
<!ELEMENT rule EMPTY >
<!ATTLIST UNADA start CDATA #REQUIRED> <!ATTLIST UNADA end CDATA #REQUIRED> <!ATTLIST UNADA file CDATA #REQUIRED> <!ATTLIST UNADA aggreg CDATA #REQUIRED> <!ATTLIST UNADA totalSize CDATA #REQUIRED> <!ATTLIST UNADA totalNbPackets CDATA #REQUIRED> <!ATTLIST point id CDATA #REQUIRED>
<!ATTLIST val dim CDATA #REQUIRED>
<!ATTLIST signatureOfAnAnomaly dissim CDATA #REQUIRED> <!ATTLIST signatureOfAnAnomaly mainIPs CDATA #REQUIRED> <!ATTLIST signatureOfAnAnomaly point CDATA #REQUIRED> <!ATTLIST signatureOfAnAnomaly possAnom CDATA #REQUIRED> <!ATTLIST rule dim CDATA #REQUIRED>
<!ATTLIST rule type CDATA #REQUIRED> <!ATTLIST rule value CDATA #REQUIRED> ]> 7 https://d3js.org/ 8 http://c3js.org/ 9 http://leafletjs.com/ 10 https://projects.spring.io/spring-framework/ 11 http://jnetpcap.com/ 12 https://sourceforge.net/projects/libpcap/