HAL Id: hal-01225822
https://hal.archives-ouvertes.fr/hal-01225822
Submitted on 6 Nov 2015
HAL is a multi-disciplinary open access
archive for the deposit and dissemination of
sci-entific research documents, whether they are
pub-lished or not. The documents may come from
teaching and research institutions in France or
abroad, or from public or private research centers.
L’archive ouverte pluridisciplinaire HAL, est
destinée au dépôt et à la diffusion de documents
scientifiques de niveau recherche, publiés ou non,
émanant des établissements d’enseignement et de
recherche français ou étrangers, des laboratoires
publics ou privés.
Let’s be done with thresholds !
Sébastien Eskenazi, Petra Gomez-Krämer, Jean-Marc Ogier
To cite this version:
Sébastien Eskenazi, Petra Gomez-Krämer, Jean-Marc Ogier. Let’s be done with thresholds !. 2015
13th International Conference on Document Analysis and Recognition (ICDAR), Aug 2015, Nancy,
France. �hal-01225822�
Let’s be done with thresholds !
S´ebastien Eskenazi, Petra Gomez-Kr¨amer, and Jean-Marc Ogier
L3i, University of La Rochelle, Avenue Michel Cr´epeau, 17042, La Rochelle, FranceEmail:{sebastien.eskenazi, petra.gomez, jean-marc.ogier}@univ-lr.fr
Abstract—Current security applications rely on the
perfor-mances of the algorithms that they use. For document authen-tication, document analysis algorithms should be precise enough to detect any modification. They should also be stable enough so that a document and its photocopy yield the same result. This requirement is an absolute stability. Having close values is not enough. They need to be exactly the same. This paper presents our preliminary work on the case of a stable layout descriptor. While everyone knows that thresholds are a source of instability, they are still common practice. We describe a promising layout descriptor which drastically reduces the number of thresholds compared to the state of the art. Unfortunately, it is not stable when tested on real data. There are still too many thresholds. This paper opens and justifies the path towards algorithms without any threshold.
I. INTRODUCTION
Many documents need to be secured, ideally by the means of an electronic signature. If two documents have the same signature, then they are authentic copies of each other and if their signatures are different, one of the two documents is fraudulent or at least different from the other one. This concept works well for naturally born digital documents. However, nowadays a document, the so-called hybrid document, is often used in electronic or paper form according to the need. Hence, the hybrid document undergoes a lifecycle of printing and scanning and thus different degraded versions of the document exist as the printing and scanning process introduces specific degradations, such as print and scan noise, in the document [1]. Thus, the concept of electronic signature can not be applied. For this reason, our work intends to develop an advanced electronic signature for the field of securing hybrid documents, the so-called hybrid security. Our idea is to extract the layout, the text and the images from the document to compute a stable signature that will be the same for all the authentic copies of the document. Here, we consider that an authentic copy, should have the same layout as the original.
To our knowledge, the closest work is a signature [2] based on pixelwise signal analysis techniques which is not satisfactory because of its large size. Other signatures such as the 2D-Doc [3] require the emitter of the document to provide the information used for signature computation, e.g. the name and the address of the beneficiary, and thus secures only partially the document (the provided information, but for instance not the layout). Thus, an ideal signature computation process is to automatically extract the content of the document (text, layout, graphics) and use it in the signature computation. A smaller signature than [2] will result as the amount of information to be secured is smaller since the image is not processed pixelwise. Anyhow, this signature will still allow to secure the whole information of the document. In consequence,
this requires a layout descriptor that is stable with respect to print and scan noise so that two copies of the same document can have the same signature. This paper describes such a layout descriptor which, to our knowledge, is unique.
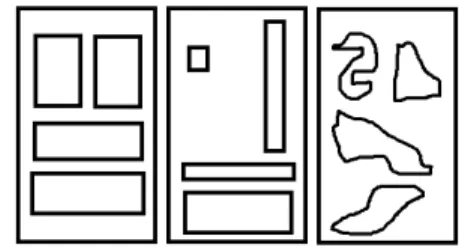
Because of the specific security context we will now precise two pairs of concepts that should not be confused: the difference between the segmentation and the layout as we understand it and the difference between accuracy and stability. According to [4], the physical layout of a document refers to the physical location and boundaries of various regions in the document image. The physical layout extraction typically relies on a page segmentation algorithm. The page segmen-tation computes the boundaries of the various regions in the document image. Then, based on these boundaries, the layout extraction determines the spatial relationships between these regions. We simplify the above definition by only keeping the physical locations of the regions for the layout. We consider that the position of the region boundaries is the page segmentation. Thus, we consider that the three segmentation results shown in Figure 1 have different segmentation results but identical layouts.
Fig. 1. Three layouts that we consider to be identical
The two other concepts that should not be mixed up are accuracy and stability. Accuracy requires a groundtruth to evaluate how close a result is to this ground truth. Accuracy can be evaluated with only one result as long as there is also a ground truth. Stability does not require a ground truth. Stability requires at least two results with similar inputs to see how close these results are together compared to how close the inputs were. In our case, similar inputs are photocopies of the same document. A consequence of this is that an algorithm can be very stable and yet not be accurate. For instance an algorithm that always makes the same mistakes or in the case of a segmentation algorithm, an algorithm producing always one region covering the whole image. Such an algorithm would have an absolute stability and zero accuracy. The contrary is not true. An algorithm with an absolute accuracy will always produce results that are identical to the ground truth and hence identical between each other. A perfect segmentation algorithm will also be perfectly stable.
In order to have the smallest possible signature, the best solution is to have a perfectly stable descriptor. This allows the use of cryptographic hashing such as SHA256 [5] which reduces the size of the signature to 256 bits while providing a good level of security. Considering two documents, either their layout signatures are exactly the same and the documents have the same layout or they are not the same and the documents have different layouts. There is no measure of closeness of their layouts as this is not necessary for our application (a document cannot be half authentic).
We can now consider the state of the art under this new perspective in Section II. Then we will introduce our decriptor and the new set of spatial relationships on which it is based in sections III and IV. In section V we show an example of the computation of the descriptor and in section VI we study the stability of this descriptor. The last section discusses the descriptor and concludes.
II. STATE OF THE ART
The Description and MOdification of Segmentation DMOS with the EPF grammatical language [6] offers an original layout description. It extracts content from a document by identifying its layout. The DMOS paradigm requires the user to define the layout with EPF a priori and is not based on the content of the document image to be processed. Hence the layout description is not adaptive to the layout of the document at hand.
´
Alvaro and Zanibbi [7] propose a layout descriptor for handwritten math expressions. They use a polar histogram and a support vector machine to classify the spatial relationship between two elements. There are five classes: horizontal, superscript, subscript, below, and inside (e.g. in a square root). The other layout descriptors are made for document clas-sification and retrieval. The MPEG-7 standard [8] includes a color layout descriptor. It divides an image into an 8 by 8 grid, takes the mean color value of the grid, converts it into the YCbCr color space and runs a discrete cosine transform on it. Esposito et al. [9] use a set of 7 quantized position and size attributes (e.g. width, height, on top of) whose values can make 171072 combinations. Cesarini et al. [10] modify the X-Y cut algorithm and use the cut sequence to encode the layout. This descriptor is tied to the segmentation algorithm and hence not very useful in a general case. There are also many graph based layout descriptors [11]–[13] using features such as distance, size, position, angles and other metrics.
[] proposes to store the structure of the document in a dendogram, they also use geometrical and local features. Unfortunately, they do not use any spatial information other than inclusion which is not enough for a layout descriptor.
Some of these descriptors are made to be robust to noise, rotation and scale. By instance, Gordo and Valveny’s descriptor [11] is invariant to scale and rotation. Unfortunately, by ’invariant’ the authors mean reasonably invariant. E.g. if we consider two copies of the same document, a small difference is accepted as long as the descriptors of the copies can be matched. This ’weak’ invariance is not enough for security application which require an exact invariance, e.g. the values of the descriptor should remain the same. We explain this in the next section.
III. OVERVIEW OF THE DESCRIPTOR
The instability of an algorithm will occur with every pos-sibility of changing the output. Hence using many thresholds or metrics that can take many values such as a distance or an area will lead to an unstable algorithm. By instance, continuous values such as 0.1234 and 0.1235 are close but different and reflect a form of instability. This brings us to the main trade-off when designing any stable descriptor. On the one hand, the more precise the information and the more information is included in the descriptor, the more unstable the descriptor will be. On the other hand, the less precise and the less information is in the descriptor, the less useful the descriptor will be. This why we decided to use only 9 spatial relationships and no size information. We consider this to be the bottom limit for the amount of information to include and we don’t want to add more to be as stable as possible. These relationships are described in the next section.
When computing the descriptor, we consider that a seg-mentation algorithm has already been run on the document and the document regions are already identified. The task of the descriptor is to describe the spatial relationships between all these regions. This is done by comparing the position of one region with all regions including itself. The result can be viewed as a totally connected directed graph whose vertices are the regions and whose edge attributes are the spatial relationships. It can also be viewed as a matrix M , where Mi,j
is the spatial relationship of region i with respect to region j. We use this last representation.
IV. DESCRIPTION OF SPATIAL RELATIONSHIPS
The easiest way to describe a layout is through a set of relations like Allen’s algebra [14] or RCC8 [15]. RCC8 describes spatial relationships of regions using 8 basic relations such as disconnected or partially overlapping but neglects any directional information (left, right, above, below). However, Allen’s algebra defines 13 spatial relations based on interval in-tersection including the notion of left and right. These relations can be extended in two dimensions with a topological product (combination of the relationships on each axis x and y) making 13× 13 = 169 relations allowing to precisely characterize the relationship between two regions. Nevertheless, they are too numerous and will not be stable in our case, especially those describing superimposition of bounding box borders, as Allen relations are solely based on the position of bounding boxes. In case of print and scan noise, the segmentation borders and the bounding boxes of different copies of a document vary slightly and practically never superimpose exactly.
For this reason, we propose modified Allen relationships. We use the centroid of a region instead of the bounding box borders as it is much more stable in case of noise. For the simplicity of explanation, we consider now only the horizontal relationships of two regions r1and r2. There are three possible relationships of r1 with respect to r2: r1 left to r2 (left), r1 overlaps r2 (center) and r1 right to r2 (right).
Let Li, Ci, Ri be respectively the coordinates of the left
corner, of the centroid and of the right corner of the bounding box of region ri as shown on Figure 2. Wi = Ri− Li is the
width of the bounding box. Hereafter, we consider the position of the centroid of r1 with respect to the bounding box of r2.
Fig. 2. Notations used
The algorithm below details how we decide which is the relation of r1 with respect to r2.
if L2≤ C1≤ R2 relation = center elseif C1< L2 relation = left elseif R2< C1 relation = right end
These spatial relationships can be extended to 2D with a topological product as shown in Table I. Top and bottom are the vertical equivalents of horizontal left and right relationships respectively. The values in the table are the index for each relationship. By instance if the relation between r1and r2 has a value of 1, this means that the centroid of r1 is in the top left position with respect to the bounding box of r2. Thus, we have reduced the 169 original relations to 9.
Left Center Right
Top 1 2 3
Center 4 5 6
Bottom 7 8 9
TABLE I. 2D MODIFIEDALLEN RELATIONS
V. COMPUTATION OF THE LAYOUT DESCRIPTOR
We call the matrix of the descriptor, the layout matrix. The computation of the layout matrix requires some preprocessing. For this example we consider the segmentation output of Figure 3. First we extract its connected components. Each connected component corresponds to a region of the document. Then we remove the background region e.g. any component whose dimensions are the same as the image. We number arbitrarily the remaining connected components/regions as shown in Figure 3.
Once, the regions are determined, the position of each region is compared to all the regions (including itself). Then, the layout matrix M is constructed as follows:
Mi,j= A(ri, rj) (1)
where A(ri, rj) is the index of the modified Allen relation
in Table I when comparing the position of ri with respect
to rj. For instance, when comparing r1 to itself, we obtain
M1,1 = A(r1, r1) = 5 as the position of the two regions is exactly the same. When comparing r1to r2we obtain M1,2=
A(r1, r2) = 3 as the centroid of r1is on the top right of r2. For the example layout of Figure 3, we obtain the layout matrix of Table II. Finally, we sum each line to reorder the numbering
Fig. 3. Example of a docu-ment layout with 4 regions
M ∑jMi,j
5 3 1 2 11
8 5 4 2 19
8 6 5 2 21
8 9 7 5 29
TABLE II. LAYOUT MATRIX
of the connected components and the layout matrix so that the sums are in ascending order. This allows to order the regions from top to bottom and left to right. This step is not necessary in our example since this is already the case.
VI. STABILITY ANALYSIS A. Stability of the spatial relationships
Concerning the stability of this layout descriptor, there are four distortions: print and scan noise, scale, translation and rotation. Print and scan noise is not present in the result of a segmentation algorithm. Scale and translation have no influ-ence on the relative spatial relationships. The rotation remains. To study its impact we consider a typical segmentation output shown on Figure 4.
Fig. 4. Example of a segmentation output
Fig. 5. Notations used
It is clear that the first instability (e.g. change of spatial relationship) created by a rotation will be the alignment of two text lines that are side by side. We will now study the vertical position of the bounding box and centroid of two regions.
Based on the output of Figure 4 we model the situation with the notations of Figure 5. Region 2 is on the left and region 1, on the right. The centroid of r1, F, is the origin
of the coordinate system. Since the regions are text lines, we consider that the centroid of r1is in the middle of its bounding box.
The coordinates of the points A, B, C and D are:
A = ( x1 y1 ) B = ( x1 y2 ) C = ( x2 y2 ) D = ( x2 y1 ) (2)
We consider the position of r1 with respect to r2. With a null rotation, the spatial relationship along the y axis between is ”center”. We now apply a rotation of angle θ ∈ [0◦; 90◦] and of center F on the document. The center of the rotation can be chosen arbitrarily and the computation will be easier if it is F. The new coordinates are computed by multiplying the old ones by a rotation matrix:
R(θ) =
(
cosθ −sinθ sinθ cosθ
)
The images of A, B, C and D are respectively denoted A’, B’, C’ and D’. We only need their ordinates:
yA′ = x1sinθ + y1cosθ
yB′ = x1sinθ + y2cosθ
yC′ = x2sinθ + y2cosθ
yD′ = x2sinθ + y1cosθ
(3)
It is obvious that yD′ is the maximum ordinate as x1< x2,
y2< y1and the sinus and cosinus are positives (θ∈ [0◦; 90◦]).
θ is comprised between 0◦ and 90◦ so the spatial relationship along the y axis will change when
yD′ < 0 (4)
We can rewrite equation 4:
sinθ cosθ < −y1 x2 ⇔ θ < arctan ( −y1 x2 ) = 2.7◦ (5)
Thus our layout descriptor will produce the same output independantly from scale, translation or rotation up to 2.7◦ of rotation. This is sufficient for a flatbed scanner and were it not, one could use a deskewing algorithm. Current skew estimators have a precision below 0.1◦ [16].
B. Stability of the layout matrix
The layout matrix is sorted in ascending order of the sum of its rows. Thus, assuming that the spatial relationships between the regions are stable, the only occurence of instability is when two rows i and i + 1 have the same sum. We will assume that two such rows exists and prove that this leads to a contradiction.
The most obvious case is when the two rows are identical. This requires Mi,i+1= Mi+1,i+1= 5 and Mi+1,i= Mi,i= 5.
This means that the regions are superimposed or that one region is around the other. This is not the case in most documents. And if we use the image of the segmented regions to extract them we never obtaion two superimposed regions. If two regions superimpose exactly, they will be considered as one and if they superimpose partially, they will be split into non superimposing regions.
Let us now consider the case when the regions are not su-perimposed. We can choose arbitrarily Mi,i+1< 5 < Mi+1,i.
The equality of the sum of the rows requires that there exists a region k such that Mi+1,k> Mi,k.
We will now prove the following lemma which will in turn prove the impossibility of the above statement.
Lemma 6.1: ∀{i, j, k} Mi,k < Mj,k⇒ Mi,j ≤ 5
To simplify the demonstration, we will consider the unidi-mensional case with the same notations as Section IV. There are three cases:
1) Mi,k= lef t (1) and Mj,k= center (2)
2) Mi,k= lef t (1) and Mj,k= right (3)
3) Mi,k= center (2) and Mj,k= right (3)
The first case is equivalent to
Ci< Lk≤ Cj⇒ Li≤ Cj⇒ Mi,j≤ 2 (center) (6)
Which is the expected result for a unidimensional case. The reasoning is the same for the two other cases.
Using Lemma 6.1, Mi+1,k > Mi,kimplies that Mi+1,i≤ 5
which is impossible. Hence the layout matrix is perfectly stable with the exception of documents were one region is surrounded by another.
C. Experimental analysis
One method to confirm our theoretical findings could have been to print, photocopy and scan real documents and then apply several segmentation algorithms on them. But to our knowledge, there is no perfect segmentation algorithm hence the segmentation results would already produce different layouts for the copies of the same document. It would then be pointless to try to have identical descriptors for all of them. We separate the problem of layout description from segmentation with a layout data set. We took 14 segmentation outputs as initial layouts, which we copied to reflect the geometric distortions/noise of a real document to be independent from the segmentation performance. We printed each layout twice. Each print was photocopied twice making 2×2 = 4 copies plus two originals. The first photocopy of each original was photocopied again adding an extra two copies and making 8 paper pages for each layout. These pages were scanned twice in gray level at 600dpi. This produces 16 images of each layout. Then we binarized the scanned images using Otsu’s method [17] to obtain perfect segmentation results on which we could apply our layout descriptor. Four examples of these results are shown in Figure 6. This method has the advantage of reflecting the impact of print and scan degradation on the layout of the document image while ensuring the perfect stability of the layout of the segmentation results.
The next step was applying our layout descriptor on this dataset to see if it would take exactly the same values on all the copies of each layout. As a matter of fact, it did... for three layouts. The state of the art algorithms would all have failed for all the images because they all use continuous values which makes them completely unstable. Hence our result is already better than the state of the art. Yet, this is not sufficient at all. During this experiment we noticed that the main cause of instability was the fact that text lines of adjacent columns are
(a) Layout 1 (b) Layout 2 (c) Layout 3 (d) Layout 4 Fig. 6. Four of the 14 layouts we used to test the descriptor
not always aligned (see Fig 4). Hence the vertical position of the centroid of a text line r1 can be close to the top of the bounding box of another text line on its side r2. Depending on the copy, the centroid of r1 will be above or below the top of the bounding box of r2. The vertical relation of r1with respect to r2will then change from ”top” to ”center” (cf Table I).This will cause the instability of the algorithm. This example can be extended to the case of two regions (not necessarily text lines) that are side by side or on top of each other.
VII. CONCLUSION
The descriptor we have proposed fits many cases for document layout description. Theoretically, it produces exactly the same output up to 2.7◦of rotation and as long as no region is surrounded by another region. If the segmentation algorithm produces text regions instead of text lines or if the text lines are grouped into paragraphs, the descriptor will be even more stable. It is scale and translation invariant. It is adaptable to and independant from any segmentation algorithm. This is achieved through a severe reduction of the number of thresholds. Yet, our experimental analysis proves that the presence of any threshold will lead to an unstable algorithm. Although it is more stable than the state of the art could be, our layout descriptor makes no exception and is not stable enough.
One lesson to learn from this improvement is that thresh-olds definitely need to be banned if one wants to reach an industrial level of stability/repeatability. We did not discuss the question of parameters but it is also common knowledge that parameters tend to tune an algorithm for a specific kind of input and thus prevent its scalability to a more general case. As it is long overdue that we put in practise these old recommendations, we will present a layout descriptor and a segmentation algorithm that have no thresholds or parameters in two other papers.
ACKNOWLEDGMENT
This work is financed by the ANR project SHADES referenced under ANR-14-CE28-0022.
REFERENCES
[1] T. Kanungo, R. M. Haralick, and I. Phillips, “Global and local document degradation models,” in Proc. of 2nd International Conference on Document Analysis and Recognition
(ICDAR). IEEE, 1993, pp. 730–734. [Online]. Available:
http://ieeexplore.ieee.org/lpdocs/epic03/wrapper.htm?arnumber=395633 [2] A. Malvido Garci`a, “Secure Imprint Generated for Paper Documents
(SIGNED),” Bit Oceans, Tech. Rep. December 2010, 2013.
[3] ANTS, “Sp´ecifications techniques des Codes `a Barres 2D-Doc,” ANTS, Tech. Rep., 2013.
[4] B. B. Chaudhuri, Digital document processing. major directions and
recent advances. Springer, 2007.
[5] J. Bryson and P. Gallagher, “Secure Hash Standard (SHS),” p. 35, 2012. [6] B. Co¨uasnon, “DMOS, a generic document recognition method: appli-cation to table structure analysis in a general and in a specific way,” in
International Journal on Document Analysis and Recognition (IJDAR),
vol. 8, no. 2-3. Springer-Verlag, 2006, pp. 111–122.
[7] F. ´Alvaro, “A shape-based layout descriptor for classifying spatial relationships in handwritten math,” in Proc. of the 2013 symposium
on Document engineering. ACM, 2013, pp. 123–126.
[8] E. Kasutani and A. Yamada, “The MPEG-7 color layout descriptor: a compact image feature description for high-speed image/video seg-ment retrieval,” in Proc. of 2001 International Conference on Image
Processing (ICIP), vol. 1. IEEE, 2001.
[9] F. Esposito, D. Malerba, and G. Semeraro, “Multistrategy learning for document recognition,” Applied Artificial Intelligence an International
Journal, vol. 8, no. 1, pp. 33–84, 1994.
[10] F. Cesarini, M. Lastri, S. Marinai, and G. Soda, “Encoding of modified X-Y trees for document classification,” Proc. of 6th International
Conference on Document Analysis and Recognition (ICDAR), 2001.
[11] A. Gordo and E. Valveny, “A rotation invariant page layout descriptor for document classification and retrieval,” in Proc. of the 10th
Inter-national Conference on Document Analysis and Recognition (ICDAR).
IEEE, 2009, pp. 481–485.
[12] J. L. J. Liang, D. Doermann, M. Ma, and J. Guo, “Page classification through logical labelling,” in Proc. of 16th International Conference on
Pattern Recognition (ICPR), vol. 3. IEEE, 2002, pp. 477–480.
[13] A. D. Bagdanov and M. Worring, “First order Gaussian graphs for efficient structure classification,” Pattern Recognition, vol. 36, pp. 1311– 1324, 2003.
[14] J. F. Allen, “Maintaining knowledge about temporal intervals,”
Commu-nications of the ACM, vol. 26, no. 11, pp. 832–843, Nov. 1983. [Online].
Available: http://portal.acm.org/citation.cfm?doid=182.358434 [15] Z. Cui, A. G. Cohn, and D. A. Randell, “Qualitative and
topological relationships in spatial databases,” in Advances in Spatial
Databases, ser. Lecture Notes in Computer Science, D. Abel
and B. Chin Ooi, Eds. Berlin, Heidelberg: Springer Berlin Heidelberg, 1993, vol. 692, pp. 296–315. [Online]. Available: http://www.springerlink.com/index/10.1007/3-540-56869-7
[16] A. Papandreou, B. Gatos, G. Louloudis, and N. Stamatopoulos, “Doc-ument Image Skew Estimation Contest (DISEC13),” in Proc. of 12th
International Conference on Document Analysis and Recognition
(IC-DAR). IEEE, 2013, pp. 1476–1480.
[17] N. Otsu, “A threshold selection method from gray-level histograms,” Systems, Man, and Cybernetics,
vol. 9, no. 1, pp. 62–66, 1979. [Online]. Available: http://ieeexplore.ieee.org/lpdocs/epic03/wrapper.htm?arnumber=4310076