Characterization of in vivo resistance to osimertinib
and JNJ-61186372, an EGFR/Met bi-specific antibody,
reveals unique and consensus mechanisms of resistance
The MIT Faculty has made this article openly available.
Please share
how this access benefits you. Your story matters.
Citation
Emdal, Kristina B., Antje Dittmann, Raven J. Reddy, Rebecca S.
Lescarbeau, Sheri L. Moores, Sylvie Laquerre, and Forest M.
White. “Characterization of In Vivo Resistance to Osimertinib and
JNJ-61186372, an EGFR/Met Bispecific Antibody, Reveals Unique
and Consensus Mechanisms of Resistance.” Molecular Cancer
Therapeutics 16, no. 11 (August 22, 2017): 2572–2585.
As Published
http://dx.doi.org/10.1158/1535-7163.MCT-17-0413
Publisher
American Association for Cancer Research (AACR)
Version
Author's final manuscript
Citable link
http://hdl.handle.net/1721.1/119191
Terms of Use
Creative Commons Attribution-Noncommercial-Share Alike
Characterization of in vivo resistance to osimertinib and
JNJ-61186372, an EGFR/Met bi-specific antibody, reveals unique
and consensus mechanisms of resistance
Kristina B. Emdal1, Antje Dittmann1, Raven J. Reddy1, Rebecca S. Lescarbeau1, Sheri L.
Moores2, Sylvie Laquerre2, and Forest M. White1
1Department of Biological Engineering and David H. Koch Institute for Integrative Cancer
Research, Massachusetts Institute of Technology, Cambridge, MA, USA.
2Oncology, Janssen Research and Development, LLC, Spring House, PA, USA.
Abstract
Approximately 10% of non-small cell lung cancer (NSCLC) patients in the U.S. and 40% of NSCLC patients in Asia have activating EGFR mutations and are eligible to receive targeted anti-EGFR therapy. Despite an extension of life expectancy associated with this treatment, resistance to EGFR tyrosine kinase inhibitors and anti-EGFR antibodies is almost inevitable. To identify additional signaling routes that can be co-targeted to overcome resistance, we quantified tumor-specific molecular changes that govern resistant cancer cell growth and survival. Mass
spectrometry-based quantitative proteomics was used to profile in vivo signaling changes in 41 therapy resistant tumors from four xenograft NSCLC models. We identified unique and tumor-specific tyrosine phosphorylation rewiring in tumors resistant to treatment with the irreversible third generation EGFR-inhibitor, osimertinib, or the novel dual-targeting EGFR/Met antibody, JNJ-61186372. Tumor-specific increases in tyrosine-phosphorylated peptides from EGFR family members, Shc1 and Gab1 or Src family kinase substrates were observed, underscoring a
differential ability of tumors to uniquely escape EGFR inhibition. Although most resistant tumors within each treatment group displayed a marked inhibition of EGFR as well as Src family kinase (SFK) signaling, the combination of EGFR inhibition (osimertinib) and SFK inhibition
(saracatinib or dasatinib) led to further decrease in cell growth in vitro. This result suggests that residual SFK signaling mediates therapeutic resistance and that elimination of this signal through combination therapy may delay onset of resistance. Overall, analysis of individual resistant tumors captured unique in vivo signaling rewiring that would have been masked by analysis of in vitro cell population averages.
Keywords
Epidermal growth factor receptor (EGFR); drug resistance; non-small cell lung cancer (NSCLC); phosphoproteomics; mass spectrometry
HHS Public Access
Author manuscript
Mol Cancer Ther
. Author manuscript; available in PMC 2018 November 01.Published in final edited form as:
Mol Cancer Ther. 2017 November ; 16(11): 2572–2585. doi:10.1158/1535-7163.MCT-17-0413.
A
uthor Man
uscr
ipt
A
uthor Man
uscr
ipt
A
uthor Man
uscr
ipt
A
uthor Man
uscr
ipt
Introduction
Non-small cell lung cancer (NSCLC) remains the leading cause of cancer-related mortality, and its prevalence continues to increase worldwide (1). Activating mutations in the kinase domain of the epidermal growth factor receptor (EGFR) occur at a high frequency in NSCLC patients, and are especially frequent in never-smokers. Despite initial survival benefit from therapy with EGFR tyrosine kinase inhibitors (TKIs), overall patient survival remains suboptimal and recurrence rates are high (2). Most patients experience acquired resistance to EGFR-targeted therapy in less than a year after starting treatment (3–5). Even in the context of improved EGFR TKIs, overcoming therapeutic resistance remains a significant clinical challenge (6,7). A better understanding of the molecular mechanisms underlying resistant cancer cell growth and survival is required to direct future therapies for advanced state NSCLC.
To date, knowledge of therapy resistance mechanisms has facilitated the development of three generations of EGFR TKIs. First-generation EGFR TKIs such as erlotinib and gefitinib bind competitively and reversibly to the ATP-binding site of the EGFR tyrosine kinase domain. Clinical trials confirmed superior response rates and improved progression-free survival in NSCLC patients with activating EGFR mutations, also known as sensitizing mutations, such as L858R and the in-frame exon 19 deletion (ex19del) (4,5,8). However, about 50–60% of patients acquire resistance to TKI therapy through restored EGFR signaling conferred by the secondary T790M EGFR gatekeeper mutation (8–11).
Consequently, second-generation irreversible EGFR TKIs such as afatinib, dacomitinib and neratinib were introduced as a strategy to overcome first-generation EGFR TKI resistance. However, despite promising activity against T790M, these TKIs displayed limited clinical efficacy due to dose-limiting toxicity caused by simultaneous inhibition of wild type EGFR (12). Ultimately, third-generation EGFR-TKIs were designed to selectively target T790M and EGFR TKI-sensitizing mutations over the wild-type receptor. Recently, one of these, the irreversible TKI osimertinib, received US Food and Drug Administration (FDA) approval for advanced NSCLC by showing promising clinical efficacy (6,13). However, despite significant increase in progression-free survival with osimertinib as compared to platinum-pemetrexed in T790M-expressing NSCLC patients, development of resistance still limited the efficacy of this treatment (7,14).
Given the challenge of therapy resistance, there have been considerable efforts over the past decade to define resistance mechanisms at a molecular level. In this respect, it has become clear that resistance does not merely evolve around the targetable driver of disease as exemplified by EGFR T790M. A recurrent theme involves the additional engagement of bypass signaling pathways driven by other receptor tyrosine kinases (RTKs) to support tumor cell growth and survival (15). For instance, multiple studies have highlighted activation of hepatocyte growth factor receptor (Met), by increased expression of the receptor due to MET gene amplification or by increased expression of the ligand hepatocyte growth factor (HGF), as an important resistance mechanism to both first and third generation EGFR TKIs (9,11,16–18). Other RTK-mediated resistance mechanisms include activation of human epidermal growth factor receptor 2 (HER2), insulin-like growth factor 1 receptor (IGF1R) and Axl (19–21). The frequent occurrence of bypass signaling resistance suggests
A
uthor Man
uscr
ipt
A
uthor Man
uscr
ipt
A
uthor Man
uscr
ipt
A
uthor Man
uscr
ipt
the need for an approach whereby co-targeting multiple pathways could serve as a strategy to delay or overcome resistance. Bi-specific antibodies present one such approach, and have recently been approved in leukemia, with several other bi-specific antibodies in advanced clinical development (22,23). For NSCLC, the novel bi-specific antibody JNJ-61186372 targeting EGFR and Met was recently reported to be effective in EGFR TKI resistant preclinical models (24,25). However, even in the context of this promising preclinical data, multiple tumor xenografts in mouse models continued to grow out in the presence of JNJ-61186372, suggesting that acquired resistance will most likely represent a clinical challenge, even for bi-specific antibody treatments.
Knowing that NSCLC patients inevitably experience repeated relapses due to acquired resistance, the targeted options of currently FDA approved therapies for these patients have become limited. Therefore, it is crucial to gain more insight into the changes in cell state and signaling occurring in tumors of advanced state NSCLC following treatment with the latest generation of EGFR TKIs or bi-specific antibodies, as this information will be critical in guiding potential future therapies. Given that in vitro systems largely ignore heterogeneity of cancers as well as the complexity of the tumor microenvironment, we hypothesized that a xenograft-based approach would allow us to study therapy resistance with improved translational relevance. Here, we aimed to address these critical aspects of acquired resistance through individual tumor analysis following treatment with osimertinib and JNJ-61186372 in preclinical tumor xenograft models reflecting the clinical setting of advanced-state NSCLC.
Materials and methods
Compounds and reagents
The EGFR/Met bispecific antibody, JNJ-61186372, was produced by Janssen
Pharmaceuticals as previously described (24,25). The EGFR tyrosine kinase inhibitor, osimertinib (AZD9291) (26), used for the tumor xenograft studies was produced by Wuxi. Compounds used for cell culture studies; osimertinib, saracatinib (AZD0350) (27) and dasatinib were purchased from Selleck Chemicals, Germany. Stock solutions for all inhibitors were prepared in DMSO and stored at −20°C.
Cell culture and engineered cell lines
Human NSCLC cell lines H1975 and HCC827 were obtained from the American Type Culture Collection (ATCC, Manassas, VA, USA). The engineered H1975-HGF cell line was derived from H1975 to constitutively express the human HGF gene as previously described (24). The HCC827-ER1 cell line was derived from HCC827 to harbor MET amplification, which was assessed by quantitative polymerase chain reaction relative to RNase P (Crown Bioscience UK). DR-HCC827 was a kind gift from Allison Claas and Douglas
Lauffenburger at MIT and developed as a drug resistant (DR) clone from HCC827 after continuous treatment with erlotinib. Cell lines for in vitro studies were received in 2016 and were used with no further authentication or mycoplasma testing.
A
uthor Man
uscr
ipt
A
uthor Man
uscr
ipt
A
uthor Man
uscr
ipt
A
uthor Man
uscr
ipt
Cell lines were maintained in RPMI 1640 medium supplemented with 10% heat inactivated fetal bovine serum (Gibco), 2 mM L-glutamine (Gibco), and 1% penicillin/streptomycin (Gibco). For H1975-HGF cells 2 µg/mL puromycin (Sigma, St. louis, MO, USA) were added to the medium. Cells were cultured in a humidified incubator at 37°C in an atmosphere of 5% CO2.
In vivo tumor models
Animal studies were performed at Charles River Discovery Services (Morrisville, NC, USA) and Crown Bioscience Inc. (Jaicang, China). All procedures relating to animal care,
handling, and treatment in this article were performed according to the guidelines approved by Institutional Animal Care and Use Committee. In brief, H1975/H1975-HGF cells (5 × 10⁶) and HCC827/HCC827-ER1 cells (5 × 10⁶ with Matrigel) were injected subcutaneously into the flanks of female CD1 nu/nu mice (4–6 weeks old, Charles River Laboratories) and BALB/c nude mice (6–8 weeks old, Crown Bioscience Inc.), respectively. Treatment began when tumors were established and volume reached approximately 400–600 mm3.
Osimertinib was administered once per day by oral gavage at a dose of 5 mg/kg. JNJ-61186372 was administered by intra-peritoneal injection biweekly at a dose of 10 mg/kg. Vehicle-treated animals were injected with PBS. For analysis of 6 h treatment efficacy, 5 mice were included per treatment group to allow for measurements of inter-animal variation. The long-term treatment group to study therapy resistance was driven in discovery mode and thus included 10 mice per treatment group to allow for outgrowth of a sufficient number of resistant tumors for subsequent analyses. Resistant tumors were collected at various times allowing for tumor volumes between 50–2000 mm3. Tumor volume was measured twice weekly as length (mm) × width (mm) × height (mm) and expressed as cubic millimeters using a PRO-MAX electronic digital caliper (Japan Micrometer Mfg. Co. Ltd.).
Tumor tissue processing for MS analysis
Tumor material (whole tumor) was collected from mice and snap frozen in liquid nitrogen. Tumors were homogenized by sonication in 8 M urea supplemented with 1 mM sodium orthovanadate (Na3VO4), 0.1% Nonidet P-40, protease inhibitor cocktail (Roche) (1
tablet/10 mL) and PhosStop (Roche) (1 tablet/10 mL). Protein concentration was measured by a bicinchoninic acid (BCA) assay (Pierce) and proteins were reduced with 10 mM dithiothreitol (DTT) for 1 h at 56°C, alkylated with 50 mM iodoacetamide for 1 h at room temperature, and diluted fourfold with 100 mM ammonium acetate at pH 8.9. Proteins were digested using trypsin (sequencing-grade, Promega); 1 µg trypsin per 50 µg protein
overnight at room temperature. Enzyme activity was quenched by acidification of the samples with acetic acid. The peptide mixture was desalted and concentrated on a C18 Sep-Pak Plus cartridge (Waters) and eluted with 40% acetonitrile, 0.1% acetic acid. Organic solvent was evaporated in a SpeedVac vacuum centrifuge. 400 µg aliquots of each sample were aliquoted and frozen in liquid nitrogen for 5 min, lyophilized and stored at −80°C.
TMT labeling and phosphopeptide enrichment
Lyophilized peptides were labeled with either tandem mass tag (TMT)-6-plex or TMT-10-plex Mass Tag Labeling Kits (Thermo). For each TMT multiTMT-10-plex, a pooled sample was
A
uthor Man
uscr
ipt
A
uthor Man
uscr
ipt
A
uthor Man
uscr
ipt
A
uthor Man
uscr
ipt
included consisting of a combination of equal amounts of peptides from vehicle-treated tumors (6 h treatment), allowing for relative quantification to a normalization channel. For the analysis of target efficacy and therapeutic resistance, the cell line xenografts in the normalization channel were matched to the treated cell line xenografts (e.g., vehicle H1975 xenografts for normalization compared to drug treated H1975 xenografts). For the analysis of variation among vehicle-treated tumors, the normalization channel consisted of a pool derived from a combination of the vehicle-treated tumors from each of the four analyzed cell lines, allowing a comparison across cell lines. For TMT labeling, five or nine tumor peptide aliquots and one normalization channel (400 µg peptide for each channel) were resuspended in 100 µL of 70% (vol/vol) ethanol, 30% (vol/vol) 0.5 M triethylammoniumbicarbonate at pH 8.5, and incubated with TMT reagent resuspended in 40 µL anhydrous acetonitrile at room temperature for 1 h. The samples were concentrated, combined, and concentrated to dryness using a SpeedVac centrifuge.
Phosphopeptides were sequentially enriched using phosphotyrosine immunoprecipitation (IP) and immobilized metal ion chromatography (IMAC). First, dried samples were
resuspended in IP buffer (100 mM Tris·HCl, 1% Nonidet P-40 at pH 7.4) and incubated with protein G agarose beads conjugated with 12 µg 4G10 (Millipore), 12 µg PY-100 (Cell Signaling Technologies), and 12 µg PT-66 (Sigma) overnight at 4°C. The supernatant, containing the unbound fraction from the IP, was saved for subsequent crude peptide analysis to correct for slight variations in the amount of sample in each of the
TMT-channels. Beads were washed with IP buffer and rinse buffer (100 mM Tris · HCl at pH 7.4) and subsequently peptides were eluted with 100 mM glycine at pH 2.5 for 30 min at room temperature and acidified with trifluoroacetic acid (TFA). In preparation for IMAC using Fe(III)-NTA agarose beads, Ni-NTA beads (Superflow Ni-NTA, Qiagen) were washed in milli-Q, incubated twice with 100 mM EDTA, pH 8.9 for 10 min, washed with milli-Q, incubated 45 min with 100 mM Fe(III)-chloride and washed with milli-Q. Next, the IP eluate was further added to the prepared Fe(III)-NTA beads and allowed to mix for 60 minutes, thus providing a second-stage of enrichment for phosphopeptides by IMAC. The beads were then washed twice with 0.1% TFA and 0.1% acetic acid and then bound peptides were eluted upon incubation with 250 mM NaH2PO4 for 30 min. Peptides were then loaded
onto a precolumn [100 µm ID × 10 cm packed with 10 µm C18 beads (YMC gel, ODS-A, 12 nm, S-10 µm, AA12S11)], which was rinsed with 0.2 M acetic acid for 10 min before LC-MS analysis. For the crude peptide analysis, approximately 50 ng of peptides from the IP supernatant were loaded onto an acidified precolumn prior to LC-MS analysis.
Liquid chromatography-tandem mass spectrometry (LC-MS/MS)
The washed precolumn was connected in series with an in-house packed analytical capillary column [50 µm ID × 12 cm packed with 5 µm C18 beads (YMC gel, ODS-AQ, 12 nm, S-5 µm, AQ12S05)] with an integrated electrospray tip (~1 µm orifice). Peptides were eluted using a 140 min (phosphopeptides) or 90 min (crude total peptide) gradient from 9 to 70% acetonitrile in 0.2 M acetic acid at a flow rate of 0.2 ml/min, with a flow split of ~10,000:1, yielding a final electrospray flow rate of ~20 nL/min. Phosphopeptides were analyzed using a Thermo Q Exactive Hybrid Quadrupole-Orbitrap Plus mass spectrometer. Standard mass spectrometric parameters were as follows: spray voltage, 2 kV; no sheath or auxiliary gas
A
uthor Man
uscr
ipt
A
uthor Man
uscr
ipt
A
uthor Man
uscr
ipt
A
uthor Man
uscr
ipt
flow, heated capillary temperature, 250°C; S-lens radio frequency level of 50%. The Q Exactive was operated in data-dependent acquisition mode. Full-scan MS spectra [mass/ charge ratio (m/z), 350 to 2000; resolution, 70,000 at m/z 200] were detected in the Orbitrap analyzer after accumulation of ions at 3e6 target value based on predictive AGC from the previous scan. For every full scan, the 15 most intense ions were isolated (isolation width of 0.4 m/z) and fragmented (collision energy (CE): 32%) by higher-energy collisional
dissociation (HCD) with a maximum injection time of 300 ms and 35,000 resolution. Dynamic exclusion was set to 30 s. Total crude peptide analysis was performed on an LTQ Orbitrap XL mass spectrometer. Briefly, standard mass spectrometric parameters were as follows: spray voltage, 2 kV; no sheath or auxiliary gas flow, heated capillary temperature, 250°C. Analysis was performed in a data-dependent acquisition mode; full-scan mass spectra (m/z range 400–2000, resolution 60,000) were detected in the Orbitrap analyzer (ion target value 5×10⁵). For every full scan, the 10 most intense ions were isolated (isolation width 3 Da) and fragmented by HCD (CE: 75%) in the HCD cell followed by detection in the Orbitrap (ion target value 1×10⁵) for iTRAQ marker ion quantification and subsequently re-isolated and fragmeted by collision-induced dissociation (CID) in the LTQ ion trap at CE: 35% and ion target value 1.3×10⁴ for peptide identification.
Mass spectrometry data analysis
Raw mass spectral data files were loaded into Proteome Discoverer version 1.4.1.14 (DBversion: 79) (Thermo) and searched against the human SwissProt database (sequence entries: 20,194) using Mascot version 2.4 (Matrix Science). TMT reporter quantification was extracted and isotope corrected in Proteome Discoverer. Tandem mass spectra were matched with an initial mass tolerance of 10 ppm on precursor masses and 15 mmu for fragment ions. Cysteine carbamidomethylation, TMT-labeled lysine and protein N-terminal were searched as fixed modifications. Oxidized methionine, and phosphorylation of serine, threonine, and tyrosine were searched as variable modifications. Minimal peptide length was seven amino acids. The data sets were filtered by ion score >20 for all peptides to ensure high confidence in peptide identification and phosphorylation localization and to achieve an (FDR) below 1% for peptides. Phosphopeptide quantification was normalized based on median relative peptide quantification obtained from the crude peptide analysis to correct for slight variation in sample amount among TMT-channels. For each phosphopeptide, relative quantification was represented as a ratio between TMT ion intensities from each analyzed tumor and the included normalization channel.
Bioinformatic analysis
To identify phosphorylated peptides with significantly regulated ratios, we chose an arbitrary cutoff of 1.4 (fold change) for upregulation and 0.5 (fold change) for downregulation. Thus, subsequent bioinformatic analyses included phosphopeptides with ratios >1.4 relative to their normalization channel deemed as upregulated and those with ratios <0.5 deemed as downregulated. The non-regulated background pool consisted of phosphopeptides with ratios between 0.8–1.2.
Protein networks were obtained by using the STRING database (version 10.0) (28). All active interaction sources except text mining were included and to ensure high confidence, a
A
uthor Man
uscr
ipt
A
uthor Man
uscr
ipt
A
uthor Man
uscr
ipt
A
uthor Man
uscr
ipt
confidence score over 0.9 was required. Further network analysis and visualization were performed by using the Cytoscape platform (version 2.8)(29).
Gene ontology (GO) term enrichment analysis was performed on terms related to biological process using the DAVID bioinformatics resource (30). For each individual resistant tumor, the analysis included gene sets derived from each pool of regulated phosphopeptides (up- and downregulated). Genes from the tumor-specific non-regulated pool served as background. Significance was concluded when P < 0.05 by Fisher’s exact test. For each resistant tumor, the two most significantly regulated GO terms overrepresented for each regulated group (up- and downregulated) of phosphopeptides were represented in bar plots. Kinase substrate motif enrichment analysis was based on kinase substrate motifs retrieved by Perseus (version 1.5.2.6) (31) using the sequence window (±6 amino acids) flanking each phosphorylated tyrosine residue. Significantly overrepresented motifs were determined for each pool of regulated phosphopeptides (up- and downregulated) from each individual resistant tumor. The tumor-specific non-regulated pool served as background. Significance was concluded when P < 0.05 by Fisher’s exact test.
Cell viability assays
Cells were seeded in 96-well plates and treated with indicated concentrations of osimertinib, saracatinib or dasatinib alone or in combination for 48 hours. DMSO was used as control. Cell viability was measured using Cell Titer Glo (Promega) according to manufacturer’s instructions. The drug concentration giving 50% reduction in cell viability was used as a marker for drug effect.
Combination effect
The combination effect was calculated for cell viability assays performed in three biological replicates and presented as mean of three experiments ± standard error of mean (SEM). The combination effect of osimertinib and saracatinib or dasatinib was determined using the Bliss independence model (32). To quantify the interaction between osimertinib and saracatinib or dasatinib, the observed combination response (yc) was compared to the
expected effect (yBliss) under the assumption of non-interaction as predicted by the Bliss
independence model. One drug will produce an effect y1 at dose x1, and the other drug
produces an effect y2 at dose x2 while combining them produced yc. The Bliss model states
that the expected yBliss is given by: yBliss=y1+y2−y1*y2. If the observed combination effect
for the same treatment is greater than expected (yc>yBliss), then the interaction score (ΔI)
will be positive and thus, the two-drug combination was classified as synergistic.
Availability of data and materials
The raw MS data and associated tables have been deposited to the ProteomeXchange Consortium via the PRIDE partner repository with the dataset identifier PXD006114 (http:// proteomecentral.proteomexchange.org).
A
uthor Man
uscr
ipt
A
uthor Man
uscr
ipt
A
uthor Man
uscr
ipt
A
uthor Man
uscr
ipt
Results
Single agent treatment with osimertinib and JNJ-61186372 in tumor xenograft models of NSCLC gives rise to resistant tumor growth
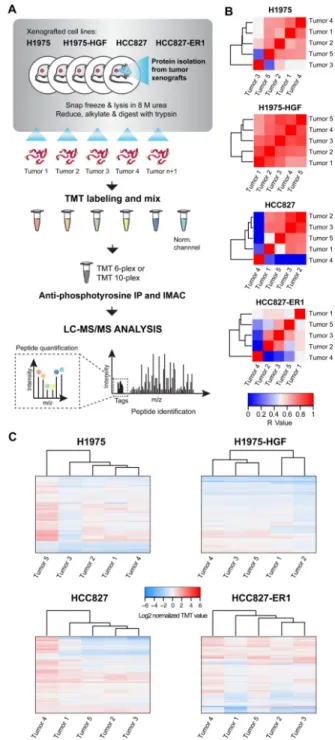
To study tumor-specific signaling events associated with acquired resistance to osimertinib and JNJ-61186372, we established four xenograft models with human NSCLC cell lines in nude mice (Fig. 1A). Prioritizing translational relevance, the molecular characteristics of the cell lines in terms of EGFR mutational status and activation of the Met signaling pathway were aligned with clinical findings. Thus, the cell line panel included H1975 (L858R/ T790M EGFR mutations), HCC827 (EGFR ex19del), the erlotinib resistant HCC827 (HCC827-ER1) with MET amplification (Crown Bioscience UK) and the engineered cell line H1975-HGF harboring HGF overexpression (24). Each established xenograft model was treated with osimertinib or JNJ-61186372 alone or in combination as outlined in Figure 1A and according to the specified dosing scheme (Supplementary Fig. S1A). We applied a setup allowing us to assess the efficacy of target inhibition for the compounds (short-term, 6 hr treatment) as well as mechanisms of therapeutic resistance for any tumors that continued to grow in the presence of drug treatment (long-term, endpoint analysis) (Fig. 1B,
Supplementary Fig. S1B–E; C was reprinted from (24)). For long-term treated tumors, six of the 12 conditions after initial tumor regression generated resistant tumors upon continuous treatment, while for the other six conditions the treatment effectively eradicated tumors (Fig. 1C).
Of the four xenograft tumor models, all tumors of H1975-HGF and HCC827-ER1 developed resistance to osimertinib treatment (Fig. 1C). This result suggests that the additional Met pathway activation in these cells conferred a growth advantage for resistant tumors compared to their parental counterparts H1975 and HCC827, in accordance with previous findings (16–18). In comparison, JNJ-61186372-resistant tumors developed at a lower frequency for H1975-HGF compared to HCC827-ER1 (Fig. 1C).
Tumors treated with the combination of osimertinib and JNJ-61186372 (combo) rapidly regressed within 20 days and treatment resulted in durable tumor regression for all four xenograft models (Supplementary Fig. S1B–E, right panel). Similarly, tumors from H1975 and HCC827 treated with osimertinib or JNJ-61186372, respectively, responded to therapy and completely regressed. Apart from the uniform responses of these therapy sensitive tumors, all other individual treatment groups displayed different but within-group similar trends of resistant tumor growth. However, unique tumor-specific responses were evident within each group (indicated with asterisks in Supplementary Fig. S1B–E).
Osimertinib and JNJ-61186372 display distinct in vivo target efficacies after 6 hours of treatment
To measure changes in phosphotyrosine signaling in vehicle and drug treated tumors, we used a quantitative MS-based proteomics approach (33) (Fig. 2A and Supplementary Fig. S2A). Essentially three types of experiments were performed for each NSCLC xenograft model using TMT-multiplexing (Supplementary Fig S2); 1. Variation among vehicle-treated tumors, 2. Target efficacy of drug treatment and 3. Therapy resistance mechanisms. In total,
A
uthor Man
uscr
ipt
A
uthor Man
uscr
ipt
A
uthor Man
uscr
ipt
A
uthor Man
uscr
ipt
14 multiplexing analyses were completed, identifying between 118 and 643 tyrosine phosphopeptides for each TMT-multiplexed MS analysis (Supplementary Fig. S2B, Supplementary Tables S1–3).
The quantified phosphotyrosine profile of vehicle-treated tumors for each xenograft model demonstrated similar signaling and therefore good correlation among the tumors (Fig. 2B, Supplementary Table S1), albeit with some outliers. For instance, HCC827 and H1975 xenografts had one tumor that displayed markedly different signaling, while H1975-HGF xenografts were highly homogeneous, and HCC827-ER1 were more heterogeneous relative to other lines. These findings were similarly confirmed by hierarchical clustering of the quantified values from each identified phosphotyrosine-containing peptide (Fig. 2C). The in vivo target efficacy analysis of osimertinib and JNJ-61186372 alone or in
combination for each of our xenograft models revealed that osimertinib had the strongest effect on tumor phosphotyrosine profiles at this early time point. Correlations of the quantified phosphotyrosine profiles showed that all tumors treated with osimertinib were more highly correlated and grouped together, irrespective of combination with
JNJ-61186372 (Fig. 3A, Supplementary Fig. S3A, Supplementary Table S2). In contrast, tumors treated with JNJ-61186372 alone demonstrated greater inter-tumor heterogeneity, in general, and were poorly correlated with tumors treated with either osimertinib or the combination of osimertinib and JNJ-61186372. Furthermore, hierarchical clustering of quantified phosphotyrosine profiles revealed a similar trend (Fig. 3B and 3C, Supplementary Fig. S3B). To determine the in vivo target efficacy of these treatments, we extracted
quantitative data for levels of phosphorylation on selected peptides from EGFR (Tyr1148 and Tyr1173), Met (Tyr1003, Tyr1295, Tyr1365), and associated proximal adaptor proteins Shc-transforming protein 1 (Shc1) (Tyr427) and Grb2-associated-binding protein 1 (Gab1) (Tyr659) (Fig. 3B and 3C, Supplementary Fig. S3C). Tumors treated with osimertinib demonstrated a pronounced decrease in phosphorylation of EGFR, Shc1 and Gab1, indicating strong on-target inhibition of EGFR. In contrast, the general trend for 3 of the 4 xenograft models showed only a very modest decrease or no change for JNJ-61186372-treated tumors. Furthermore, no change in Met phosphorylation was observed for the MET amplified HCC827-ER1 tumors upon JNJ-61186372 treatment. Taken together, these data showed that TKI-based treatment mediated a more rapid and pronounced effect on EGFR signaling inhibition compared to the bi-specific antibody.
Phosphotyrosine profiling identifies unique tumor-specific rewiring in resistant tumors
A total of 41 xenograft tumors developed resistance and grew out during long-term treatment with osimertinib or JNJ-61186372 monotherapy. Overall, the correlation of phosphotyrosine profiles between tumors for each model and treatment group was strong, suggesting that a common resistance response may have emerged in each tumor from a given treatment condition (Supplementary Figure S4A). However, the analysis also revealed significant heterogeneity, as marked by 1–3 tumors that correlated poorly with the remaining JNJ-61186372- (H1975-HGF and HCC827-ER1) and osimertinib-treated tumors (HCC827-ER1) (Supplementary Figure S4A). Quantitative changes in levels of phosphotyrosine-containing peptides across the analyzed tumors were visualized by hierarchical clustering
A
uthor Man
uscr
ipt
A
uthor Man
uscr
ipt
A
uthor Man
uscr
ipt
A
uthor Man
uscr
ipt
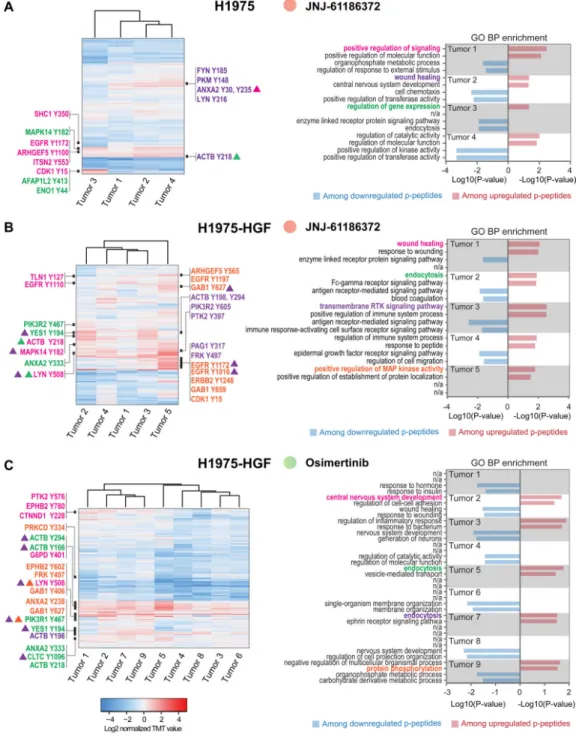
(Fig. 4A–C and 5A–C, left panel). Here, it became evident that despite a good overall correlation between tumors, each individual tumor displayed a unique quantitative profile and thus, reflected a tumor-specific re-wiring of signaling. Moreover, GO term enrichment analysis confirmed the uniqueness of individual resistant tumor states, given the great diversity of biological processes represented among phosphopeptides with up- and
downregulated ratios (Fig. 4A–C and Fig. 5A–C, right panel). With a focus on upregulation among resistant tumors, the processes ranged from RTK and downstream signaling, wound healing, regulation of gene expression, endocytosis, and cell adhesion. Interestingly, given the well-established role played by RTKs in supporting resistant tumor growth (15,34) we were surprised by the absence of a more uniform upregulation of RTK signaling within each treatment group. However, although not a general finding, certain tumors displayed
increased phosphorylation of tyrosine-residues from EGFR and/or ErbB family members or downstream signaling adaptors such as Shc1 and Gab1 (Fig. 4A; tumor 1, Fig. 4B; tumor 3 and 5, Fig. 4C; tumor 9, Fig. 5B; tumor 9 and Fig. 5C; tumor 8). Ultimately, these tumors may have adapted either by upregulating ErbB-family expression or ErbB-family ligand levels, or by cross-activating other members of the EGFR family, suggesting plasticity within these RTKs. Alternatively, given the existence of intra-tumoral heterogeneity, the treatment may have facilitated selection and outgrowth of a subpopulation of cells that already harbored the observed signaling changes.
We observed an increase in the phosphorylation level of Met activation loop Tyr1234 for a group of 5 tumors (tumor 2, 5, 7, 8 and 9) from osimertinib treated HCC827-ER1
(Supplementary Table S3). Consequently, given the MET amplification for this xenograft model, Met might still drive growth of many osimertinib resistant HCC827-ER1 tumors (Fig. 4A). It is likely that this resistance mechanism was effectively overcome by JNJ-61186372, as tumors treated with this antibody displaying strong reduction in Met Tyr1234 levels for all treated HCC827-ER1 tumors (Supplementary Table S3).
Overall, our phosphotyrosine-based proteomic approach uncovered a great diversity in cell states of resistant tumors and identified unique, xenograft tumor-specific, rewiring of signaling supporting resistant growth.
Resistance to osimertinib and JNJ-61186372 monotherapy reveals a downregulation of EGFR and SFK signaling networks
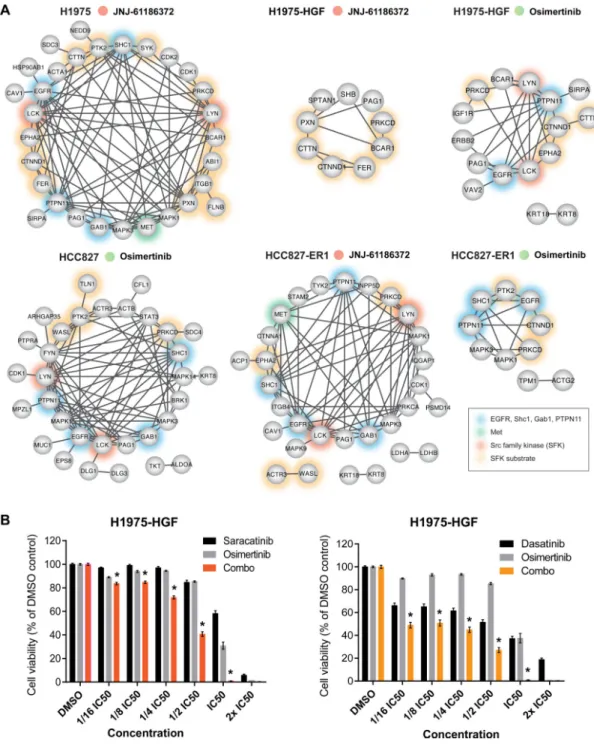
Outgrowth of resistant tumors occurred despite continuous treatment with EGFR TKI or antibody-based dual targeting of EGFR and Met. Therefore, we speculated that tumors had somehow evaded EGFR/Met inhibition to sustain resistant growth. However, a
phosphoprotein network derived from phosphotyrosine-containing peptides displaying robustly decreased levels across the majority of tumors proved that indeed both EGFR and Met were inhibited (with the exception of Met for osimertinib resistant HCC827-ER1 tumors) (Fig. 6A). Importantly, we could confirm that JNJ-61186372 had an effect on EGFR signaling inhibition which was not evident at the 6-hour efficacy analysis (Fig. 3B and 3C, Supplementary Fig. S3B and S3C). Whereas inhibition of EGFR signaling in H1975-HGF tumors resistant to JNJ61186372 was not evident from the STRING network (Fig. 6A), the ratios for EGFR phosphopeptides containing the Tyr1092 and Tyr1172 sites displayed a
A
uthor Man
uscr
ipt
A
uthor Man
uscr
ipt
A
uthor Man
uscr
ipt
A
uthor Man
uscr
ipt
median ratio of 0.59±0.25 and 0.63±0.19, respectively across tumors, and thus showed modest inhibition (Supplementary Table S3).
As opposed to the inhibited networks in resistant tumors, the upregulated networks
displayed little interconnection supported by STRING (Supplementary Fig. S4B). However, as a general finding across several of resistant tumor groups, we identified phosphorylation of p38 MAPK (MAPK14) and PI3-kinase (PIK3R1 or PIK3R2), suggesting a potential central role for a few common downstream kinases in mediating therapeutic response or resistance. Taken together, these findings suggested that upregulation of resistance signaling is more likely to occur on an individual tumor basis rather than comprising a common feature of resistant tumors. Along these lines, we analyzed the kinase-substrate relations among the regulated signaling profiles for each resistant tumor. In agreement with our phosphotyrosine analysis, we identified an increased representation of kinase substrate motifs from EGFR, JAK2, and Src kinases (Supplementary Fig. S5) (35). Intriguingly, whereas our phosphoprotein network analysis revealed major trends of resistant tumors showing EGFR inhibition with concomitant Src family kinase inhibition (Fig. 6A,
Supplementary Fig. S4B), the enrichment for EGFR, JAK2 and Src kinase substrate motifs allowed us to decipher for each individual tumor a unique and differential regulation of EGFR, JAK2 or Src substrates (Supplementary Fig. S5). This result once again underscores the existence of a pronounced heterogeneity among adaptive responses for individual resistant tumors.
Given the well-characterized interactions between EGFR and SFK signaling (33,36–39), we hypothesized that the decrease in SFK network signaling may be associated with decreased EGFR network activity. Because it has been established that residual signaling in the EGFR pathway can drive therapeutic resistance to EGFR inhibitors (40,41), and we detected an increase in phosphorylation of SFK substrates in some of the individual resistant tumors, we investigated whether further inhibition of residual remaining SFK activity might enhance cell killing in the context of osimertinib. First, we determined the IC50 values of osimertinib and the SFK inhibitors saracatinib and dasatinib in vitro using H1975-HGF and erlotinib-resistant HCC827 cells (Supplementary Fig. S6A). Cells were treated with constant ratios between determined IC50 values of the compounds and indeed, the combination of osimertinib with SFK inhibitors, saracatinib or dasatinib, enhanced synergistic cell killing (Fig. 6B). These findings were confirmed for dasatinib in the erlotinib-resistant HCC827 cells (Supplementary Fig. S6B). These results suggest that although osimertinib or
JNJ-61186372 treatment alone greatly inhibited EGFR and SFK signaling, the residual SFK signaling may be sufficient to promote continued tumor growth or at least stasis. Elimination of residual SFK activity by the combination of EGFR and SFK inhibitors may therefore significantly delay the onset of resistance or potentially eliminate resistant cell growth in advanced state NSCLC.
Discussion
The development of tumor-targeting small molecule kinase inhibitors and antibodies has led to improved progression-free survival for many NSCLC patients, yet resistance to these targeted monotherapies is practically inevitable. Despite extensive research that has defined
A
uthor Man
uscr
ipt
A
uthor Man
uscr
ipt
A
uthor Man
uscr
ipt
A
uthor Man
uscr
ipt
multiple resistance mechanisms, challenges still remain. For instance, recurrence on any given therapy may be due to poor drug delivery, poor drug efficacy, tumor heterogeneity, genetic mutation of the target, or to bypass signaling, among others. Determining which of these potential mechanisms is present in any given tumor is difficult, and requires a range of different analytical techniques. One of the main mechanisms of therapeutic resistance, on-target mutations that decrease inhibitor affinity, can typically be determined by genomic or transcriptional sequencing. These techniques have been successful for a large number of resistance mechanisms (11,42–45), but can fail to identify epigenetic/non-genomic mechanisms of resistance. As an additional strategy, several groups have used MS-based phosphoproteomics or RTK-arrays to identify signaling based mechanisms of resistance (16,36,46–48). MS-based phosphoproteomics has typically been applied to in vitro cell culture following long-term treatment and development of resistance, and has been
successful in identifying some common mechanisms of resistance, many of which have been validated in vivo (in cell line xenografts or patient derived xenografts). Here we applied an alternative approach in which subcutaneous cell line xenografts were treated with either osimertinib, JNJ-61186372, or the combination, for either a short time to determine target inhibition or an extended period of time to establish resistant tumors, followed by MS-based phosphoproteomic analysis of these resected tumors to quantify bypass signaling or target re-activation. Importantly, quantifying drug efficacy and bypass signaling in vivo across multiple xenograft tumors provides critical information about the range of responses in different tumors, and therefore yields insight into the potential patient-to-patient variability that may be seen in the clinic.
Our extensive phosphotyrosine profiling of the short-term treatment tumors confirmed the in vivo target efficacy of osimertinib, and we showed that rapid inhibition of target nodes in vivo is associated with TKI treatment but not with bi-specific antibody treatment. Knowing that the two tested compounds differ regarding type of drug (small molecule versus antibody) and mode of action (intracellular versus extracellular), as well as mode of administration (oral versus intra-venous), their individual properties may influence tissue diffusion rates, local drug availability and thus timing of drug efficacy. Moreover, our analysis of resistant tumors enabled the quantification of long-term effects and allowed us to characterize the diversity of adaptive responses to these two types of therapy. These
observations would have been difficult to achieve by studying resistance in in vitro cell cultures given the general high degree of homogeneity between passages and plates of cells and the population averaging that occurs in these systems. The 3D context and in vivo environment of these xenografts enabled resistant tumor outgrowth in a setting accommodating tumor architecture and interactions between cancer cells. While these circumstances still represent a simplified cancer model largely ignoring tumor-stroma and immune cell interactions, the observed diverse repertoire of in vivo resistance mechanisms underscores the usefulness of our approach in mimicking the heterogeneity of patients’ tumors. Moreover, the number and complexity of resistance mechanisms highlights the challenge of treating these resistant tumors.
The ability to identify both unique and consensus in vivo therapy resistance mechanisms in these long-term treated tumors underscores two critical points. First, the existence of unique tumor-specific phosphotyrosine signatures aligns well with the concept of NSCLC as a
A
uthor Man
uscr
ipt
A
uthor Man
uscr
ipt
A
uthor Man
uscr
ipt
A
uthor Man
uscr
ipt
multifaceted disease with many molecular portraits (2). The potential for patient-specific responses to therapy highlights the need for personalized medicine to identify how to most efficiently target sensitive network nodes tailored to and determined by the biology of each individual tumor. Second, in many cases the best therapeutic targets might not be the most activated targets or those with the greatest signal; the consensus signature that emerged from the analysis of all of the resistant tumors revealed a critical weak point in the network across the majority of tumors. The identification of the interconnection between EGFR and SFKs prompted us to co-target these kinase nodes in vitro and confirmed that combined inhibition could serve as a strategy to delay or overcome resistance for a broader group of patients, in agreement with previous studies (36,49–51). While this consensus network signature may be beneficial for many of the tumors, it is unlikely to be optimal for all of the tumors due to the unique resistance mechanisms present in some tumors, as supported by our analysis of individual tumors. Significant challenges remain to identify the optimal treatment for each unique tumor and to determine biomarkers indicating the presence of these unique resistance mechanisms in vivo. To this latter point, performing biopsies of resistant tumors will enable the quantification of phosphorylation signatures, but these may be confounded by spatial heterogeneity and by the labile nature of the phosphorylation sites in resected tumor specimens (52).
While there are many challenges yet remaining, our approach provides a quantitative assessment of target inhibition for osimertinib and JNJ-61186372 through the analysis of short-term treated tumors. Moreover, our approach provides insight into the basics of NSCLC resistance by identification of unique and consensus therapeutic resistance mechanisms through the analysis of recurrent tumors resulting from long-term treatment. Importantly, our analysis of a collection of individual tumors reflected the heterogeneity clinically observed for resistant tumors. Application of this approach, combined with additional systems-level analyses such as transcriptional profiling, exome sequencing, or metabolomics, to additional tumors and treatments will hopefully provide both improved treatment options and biomarkers to improve patient stratification for optimal therapy.
Supplementary Material
Refer to Web version on PubMed Central for supplementary material.
Acknowledgments
Funding: This work was supported in part by a collaborative project with Janssen Research and Development and by NIH grants R01CA096504 and U54CA210180. K.B. Emdal was supported in part by a Novo Nordisk STAR Fellowship. R.J. Reddy was supported in part by NIH training grant T32GM008334. A. Dittmann was supported in part by the Koch Institute Quinquennial Cancer Research Fellowship.
Abbreviations
NSCLC non-small cell lung cancer
EGFR epidermal growth factor receptor
TKI tyrosine kinase inhibitor
A
uthor Man
uscr
ipt
A
uthor Man
uscr
ipt
A
uthor Man
uscr
ipt
A
uthor Man
uscr
ipt
FDA food and drug administration
RTK receptor tyrosine kinase
Met hepatocyte growth factor receptor
HGF hepatocyte growth factor
HER2 human epidermal growth factor receptor 2
IGF1R insulin-like growth factor 1 receptor
TMT tandem mass tag
TFA trifluroacetic acid
IP immunoprecipitation
IMAC immobilized metal affinity chromatography
LC-MS/MS liquid chromatography tandem mass spectrometry HCD higher-energy collisional dissociation
CE collision energy
GO gene ontology
Shc1 Shc-transforming protein 1
Gab1 Grb2-associated-binding protein 1
SFK Src family kinase
References
1. Torre LA, Siegel RL, Ward EM, Jemal A. Global Cancer Incidence and Mortality Rates and Trends--An Update. Cancer Epidemiol Biomarkers Prev. 2016; 25:16–27. [PubMed: 26667886] 2. Chen Z, Fillmore CM, Hammerman PS, Kim CF, Wong KK. Non-small-cell lung cancers: a
heterogeneous set of diseases. Nat Rev Cancer. 2014; 14:535–46. [PubMed: 25056707] 3. Rosell R, Carcereny E, Gervais R, Vergnenegre A, Massuti B, Felip E, et al. Erlotinib versus
standard chemotherapy as first-line treatment for European patients with advanced EGFR mutation-positive non-small-cell lung cancer (EURTAC): a multicentre, open-label, randomised phase 3 trial. Lancet Oncol. 2012; 13:239–46. [PubMed: 22285168]
4. Kobayashi S, Boggon TJ, Dayaram T, Jänne PA, Kocher O, Meyerson M, et al. EGFR mutation and resistance of non-small-cell lung cancer to gefitinib. N Engl J Med. 2005; 352:786–92. [PubMed: 15728811]
5. Pérez-Soler R, Chachoua A, Hammond LA, Rowinsky EK, Huberman M, Karp D, et al. Determinants of tumor response and survival with erlotinib in patients with non--small-cell lung cancer. J Clin Oncol. 2004; 22:3238–47. [PubMed: 15310767]
6. Jänne PA, Yang JC, Kim DW, Planchard D, Ohe Y, Ramalingam SS, et al. AZD9291 in EGFR inhibitor-resistant non-small-cell lung cancer. N Engl J Med. 2015; 372:1689–99. [PubMed: 25923549]
7. Mok TS, Wu YL, Ahn MJ, Garassino MC, Kim HR, Ramalingam SS, et al. Osimertinib or Platinum-Pemetrexed in EGFR T790M-Positive Lung Cancer. N Engl J Med. 2017; 376:629–40. [PubMed: 27959700]
A
uthor Man
uscr
ipt
A
uthor Man
uscr
ipt
A
uthor Man
uscr
ipt
A
uthor Man
uscr
ipt
8. Paez JG, Jänne PA, Lee JC, Tracy S, Greulich H, Gabriel S, et al. EGFR mutations in lung cancer: correlation with clinical response to gefitinib therapy. Science. 2004; 304:1497–500. [PubMed: 15118125]
9. Pao W, Miller VA, Politi KA, Riely GJ, Somwar R, Zakowski MF, et al. Acquired resistance of lung adenocarcinomas to gefitinib or erlotinib is associated with a second mutation in the EGFR kinase domain. PLoS Med. 2005; 2:e73. [PubMed: 15737014]
10. Shih JY, Gow CH, Yang PC. EGFR mutation conferring primary resistance to gefitinib in non-small-cell lung cancer. N Engl J Med. 2005; 353:207–8. [PubMed: 16014893]
11. Sequist LV, Waltman BA, Dias-Santagata D, Digumarthy S, Turke AB, Fidias P, et al. Genotypic and histological evolution of lung cancers acquiring resistance to EGFR inhibitors. Sci Transl Med. 2011; 3:75ra26.
12. Tan CS, Gilligan D, Pacey S. Treatment approaches for EGFR-inhibitor-resistant patients with non-small-cell lung cancer. Lancet Oncol. 2015; 16:e447–59. [PubMed: 26370354]
13. Greig SL. Osimertinib: First Global Approval. Drugs. 2016; 76:263–73. [PubMed: 26729184] 14. Thress KS, Paweletz CP, Felip E, Cho BC, Stetson D, Dougherty B, et al. Acquired EGFR C797S
mutation mediates resistance to AZD9291 in non-small cell lung cancer harboring EGFR T790M. Nat Med. 2015; 21:560–2. [PubMed: 25939061]
15. Wilson TR, Fridlyand J, Yan Y, Penuel E, Burton L, Chan E, et al. Widespread potential for growth-factor-driven resistance to anticancer kinase inhibitors. Nature. 2012; 487:505–9. [PubMed: 22763448]
16. Engelman JA, Zejnullahu K, Mitsudomi T, Song Y, Hyland C, Park JO, et al. MET amplification leads to gefitinib resistance in lung cancer by activating ERBB3 signaling. Science. 2007; 316:1039–43. [PubMed: 17463250]
17. Shi P, Oh YT, Zhang G, Yao W, Yue P, Li Y, et al. Met gene amplification and protein
hyperactivation is a mechanism of resistance to both first and third generation EGFR inhibitors in lung cancer treatment. Cancer Lett. 2016; 380:494–504. [PubMed: 27450722]
18. Yano S, Yamada T, Takeuchi S, Tachibana K, Minami Y, Yatabe Y, et al. Hepatocyte growth factor expression in EGFR mutant lung cancer with intrinsic and acquired resistance to tyrosine kinase inhibitors in a Japanese cohort. J Thorac Oncol. 2011; 6:2011–7. [PubMed: 22052230]
19. Cortot AB, Repellin CE, Shimamura T, Capelletti M, Zejnullahu K, Ercan D, et al. Resistance to irreversible EGF receptor tyrosine kinase inhibitors through a multistep mechanism involving the IGF1R pathway. Cancer Res. 2013; 73:834–43. [PubMed: 23172312]
20. Zhang Z, Lee JC, Lin L, Olivas V, Au V, LaFramboise T, et al. Activation of the AXL kinase causes resistance to EGFR-targeted therapy in lung cancer. Nat Genet. 2012; 44:852–60. [PubMed: 22751098]
21. Takezawa K, Pirazzoli V, Arcila ME, Nebhan CA, Song X, de Stanchina E, et al. HER2
amplification: a potential mechanism of acquired resistance to EGFR inhibition in EGFR-mutant lung cancers that lack the second-site EGFRT790M mutation. Cancer Discov. 2012; 2:922–33. [PubMed: 22956644]
22. Garber K. Bispecific antibodies rise again. Nat Rev Drug Discov. 2014; 13:799–801. [PubMed: 25359367]
23. Przepiorka D, Ko CW, Deisseroth A, Yancey CL, Candau-Chacon R, Chiu HJ, et al. FDA Approval: Blinatumomab. Clin Cancer Res. 2015; 21:4035–9. [PubMed: 26374073] 24. Moores SL, Chiu ML, Bushey BS, Chevalier K, Luistro L, Dorn K, et al. A Novel Bispecific
Antibody Targeting EGFR and cMet Is Effective against EGFR Inhibitor-Resistant Lung Tumors. Cancer Res. 2016; 76:3942–53. [PubMed: 27216193]
25. Grugan KD, Dorn K, Jarantow SW, Bushey BS, Pardinas JR, Laquerre S, et al. Fc-mediated activity of EGFR × c-Met bispecific antibody JNJ-61186372 enhanced killing of lung cancer cells. MAbs. 2017; 9:114–26. [PubMed: 27786612]
26. Cross DA, Ashton SE, Ghiorghiu S, Eberlein C, Nebhan CA, Spitzler PJ, et al. AZD9291, an irreversible EGFR TKI, overcomes T790M-mediated resistance to EGFR inhibitors in lung cancer. Cancer Discov. 2014; 4:1046–61. [PubMed: 24893891]
27. Hennequin LF, Allen J, Breed J, Curwen J, Fennell M, Green TP, et al. N-(5-chloro-1,3-
benzodioxol-4-yl)-7-[2-(4-methylpiperazin-1-yl)ethoxy]-5-(tetrahydro-2H-pyran-4-A
uthor Man
uscr
ipt
A
uthor Man
uscr
ipt
A
uthor Man
uscr
ipt
A
uthor Man
uscr
ipt
yloxy)quinazolin-4-amine, a novel, highly selective, orally available, dual-specific c-Src/Abl kinase inhibitor. J Med Chem. 2006; 49:6465–88. [PubMed: 17064066]
28. Szklarczyk D, Franceschini A, Wyder S, Forslund K, Heller D, Huerta-Cepas J, et al. STRING v10: protein-protein interaction networks, integrated over the tree of life. Nucleic Acids Res. 2015; 43:D447–52. [PubMed: 25352553]
29. Smoot ME, Ono K, Ruscheinski J, Wang PL, Ideker T. Cytoscape 2.8: new features for data integration and network visualization. Bioinformatics. 2011; 27:431–2. [PubMed: 21149340] 30. Huang, dW, Sherman, BT., Lempicki, RA. Systematic and integrative analysis of large gene lists
using DAVID bioinformatics resources. Nat Protoc. 2009; 4:44–57. [PubMed: 19131956] 31. Tyanova S, Temu T, Sinitcyn P, Carlson A, Hein MY, Geiger T, et al. The Perseus computational
platform for comprehensive analysis of (prote)omics data. Nat Methods. 2016; 13:731–40. [PubMed: 27348712]
32. Bliss CI. The toxicity of poisons applied jointly. Ann Appl Biol. 1939; 26:585–615.
33. Reddy RJ, Gajadhar AS, Swenson EJ, Rothenberg DA, Curran TG, White FM. Early signaling dynamics of the epidermal growth factor receptor. Proc Natl Acad Sci U S A. 2016; 113:3114–9. [PubMed: 26929352]
34. Niederst MJ, Engelman JA. Bypass mechanisms of resistance to receptor tyrosine kinase inhibition in lung cancer. Sci Signal. 2013; 6:re6. [PubMed: 24065147]
35. Amanchy R, Periaswamy B, Mathivanan S, Reddy R, Tattikota SG, Pandey A. A curated compendium of phosphorylation motifs. Nat Biotechnol. 2007; 25:285–6. [PubMed: 17344875] 36. Yoshida T, Zhang G, Smith MA, Lopez AS, Bai Y, Li J, et al. Tyrosine phosphoproteomics
identifies both codrivers and cotargeting strategies for T790M-related EGFR-TKI resistance in non-small cell lung cancer. Clin Cancer Res. 2014; 20:4059–74. [PubMed: 24919575]
37. Stover DR, Becker M, Liebetanz J, Lydon NB. Src phosphorylation of the epidermal growth factor receptor at novel sites mediates receptor interaction with Src and P85 alpha. J Biol Chem. 1995; 270:15591–7. [PubMed: 7797556]
38. Furcht CM, Buonato JM, Lazzara MJ. EGFR-activated Src family kinases maintain GAB1-SHP2 complexes distal from EGFR. Sci Signal. 2015; 8:ra46. [PubMed: 25969544]
39. Yoshida T, Okamoto I, Okamoto W, Hatashita E, Yamada Y, Kuwata K, et al. Effects of Src inhibitors on cell growth and epidermal growth factor receptor and MET signaling in gefitinib-resistant non-small cell lung cancer cells with acquired MET amplification. Cancer Sci. 2010; 101:167–72. [PubMed: 19804422]
40. Chen WW, Schoeberl B, Jasper PJ, Niepel M, Nielsen UB, Lauffenburger DA, et al. Input-output behavior of ErbB signaling pathways as revealed by a mass action model trained against dynamic data. Mol Syst Biol. 2009; 5:239. [PubMed: 19156131]
41. Lazzara MJ, Lane K, Chan R, Jasper PJ, Yaffe MB, Sorger PK, et al. Impaired SHP2-mediated extracellular signal-regulated kinase activation contributes to gefitinib sensitivity of lung cancer cells with epidermal growth factor receptor-activating mutations. Cancer Res. 2010; 70:3843–50. [PubMed: 20406974]
42. Hu X, Zhang Z. Understanding the Genetic Mechanisms of Cancer Drug Resistance Using Genomic Approaches. Trends Genet. 2016; 32:127–37. [PubMed: 26689126]
43. Awad MM, Engelman JA, Shaw AT. Acquired resistance to crizotinib from a mutation in CD74-ROS1. N Engl J Med. 2013; 369:1173.
44. Bertotti A, Papp E, Jones S, Adleff V, Anagnostou V, Lupo B, et al. The genomic landscape of response to EGFR blockade in colorectal cancer. Nature. 2015; 526:263–7. [PubMed: 26416732] 45. Van Allen EM, Wagle N, Sucker A, Treacy DJ, Johannessen CM, Goetz EM, et al. The genetic
landscape of clinical resistance to RAF inhibition in metastatic melanoma. Cancer Discov. 2014; 4:94–109. [PubMed: 24265153]
46. Ummanni R, Mannsperger HA, Sonntag J, Oswald M, Sharma AK, König R, et al. Evaluation of reverse phase protein array (RPPA)-based pathway-activation profiling in 84 non-small cell lung cancer (NSCLC) cell lines as platform for cancer proteomics and biomarker discovery. Biochim Biophys Acta. 2014; 1844:950–9. [PubMed: 24361481]
A
uthor Man
uscr
ipt
A
uthor Man
uscr
ipt
A
uthor Man
uscr
ipt
A
uthor Man
uscr
ipt
47. Ramirez M, Rajaram S, Steininger RJ, Osipchuk D, Roth MA, Morinishi LS, et al. Diverse drug-resistance mechanisms can emerge from drug-tolerant cancer persister cells. Nat Commun. 2016; 7:10690. [PubMed: 26891683]
48. Wang YT, Pan SH, Tsai CF, Kuo TC, Hsu YL, Yen HY, et al. Phosphoproteomics Reveals HMGA1, a CK2 Substrate, as a Drug-Resistant Target in Non-Small Cell Lung Cancer. Sci Rep. 2017; 7:44021. [PubMed: 28290473]
49. Haura EB, Tanvetyanon T, Chiappori A, Williams C, Simon G, Antonia S, et al. Phase I/II study of the Src inhibitor dasatinib in combination with erlotinib in advanced non-small-cell lung cancer. J Clin Oncol. 2010; 28:1387–94. [PubMed: 20142592]
50. Wang HY, Hsu MK, Wang KH, Tseng CP, Chen FC, Hsu JT. Non-small-cell lung cancer cells combat epidermal growth factor receptor tyrosine kinase inhibition through immediate adhesion-related responses. Onco Targets Ther. 2016; 9:2961–73. [PubMed: 27284246]
51. Chung BM, Dimri M, George M, Reddi AL, Chen G, Band V, et al. The role of cooperativity with Src in oncogenic transformation mediated by non-small cell lung cancer-associated EGF receptor mutants. Oncogene. 2009; 28:1821–32. [PubMed: 19305428]
52. Gajadhar AS, Johnson H, Slebos RJ, Shaddox K, Wiles K, Washington MK, et al. Phosphotyrosine signaling analysis in human tumors is confounded by systemic ischemia-driven artifacts and intra-specimen heterogeneity. Cancer Res. 2015; 75:1495–503. [PubMed: 25670172]
A
uthor Man
uscr
ipt
A
uthor Man
uscr
ipt
A
uthor Man
uscr
ipt
A
uthor Man
uscr
ipt
Figure 1. Experimental design and phenotypic results: analysis of in vivo target efficacy and drug resistance mechanisms
A. Tumor xenograft models were established for four NSCLC cell lines with EGFR
mutation: H1975, H1975-HGF (overexpressing HGF), HCC827 and HCC827-ER1 (MET amplification). Tumor-bearing mice were treated with the small molecule inhibitor, osimertinib (chemical structure based on (26)) and the bi-specific antibody JNJ-61186372 alone or in combination (combo). Tumors were collected after 6 hours of treatment to evaluate target efficacy and resistant tumors were collected after long-term treatment. B. Box and whisker plots of tumor volume for each xenografted NSCLC cell line on day 1 of treatment. C. Outgrowth of resistant tumors (>50 mm3). n.d., not detected.
A
uthor Man
uscr
ipt
A
uthor Man
uscr
ipt
A
uthor Man
uscr
ipt
A
uthor Man
uscr
ipt
Figure 2. Workflow of quantitative phosphotyrosine profiling of NSCLC xenografts and evaluation of vehicle-treated tumor hetereogeneity
A. Phosphoproteomics workflow of the sample-processing pipeline for quantitative
MS-based analysis of NSCLC xenograft tumors. B. and C. Heatmaps of Pearson’s correlation coefficient (R-value) (B) and hierarchical clustering (Euclidian distance) of phosphopeptide changes (C) for evaluation of vehicle-treated tumor heterogeneity within each xenograft model.
A
uthor Man
uscr
ipt
A
uthor Man
uscr
ipt
A
uthor Man
uscr
ipt
A
uthor Man
uscr
ipt
Figure 3. In vivo target efficacy in H1975 and H1975-HGF xenografts
A. Heatmaps of Pearson’s correlation coefficient (R-value) from H1975 (left) and
H1975-HGF (right) xenograft models for evaluation of target efficacy upon 6 hours of treatment with osimertinib and JNJ-61186372 alone or in combination. B. and C. Hierarchical clustering (Euclidian distance) of relative phosphopeptide changes and extracted phosphotyrosine profiles from selected proteins (EGFR, Shc1 and Gab1) as indicated to evaluate in vivo target efficacy. Results are presented for tumors from H1975 (B) and H1975-HGF (C) xenografts. p, phosphorylated.
A
uthor Man
uscr
ipt
A
uthor Man
uscr
ipt
A
uthor Man
uscr
ipt
A
uthor Man
uscr
ipt
Figure 4. Unique phosphotyrosine rewiring defines resistance to osimertinib and JNJ-61186372 monotherapy in H1975 and H1975-HGF xenografts
A–C. Hierarchical clustering (Euclidian distance) of phosphopeptide changes for resistant
tumors from H1975; JNJ-61186372 (A), H1975-HGF; JNJ-61186372 (B) and H1975-HGF; osimertinib (C) (left panels). Right panels represent bar graphs of the two most significantly overrepresented GO terms (biological process) among up- and downregulated
phosphopeptides for each tumor. Black bars in the heatmap (left panel) represent areas with phosphopeptides (represented by gene name and phosphorylated tyrosine) for which the corresponding gene support a GO term (highlighted and matched by color) in the bar graph (right panel). Triangles indicate association with multiple GO terms (matched by color).
A
uthor Man
uscr
ipt
A
uthor Man
uscr
ipt
A
uthor Man
uscr
ipt
A
uthor Man
uscr
ipt
Figure 5. Unique phosphotyrosine rewiring defines resistance to osimertinib and JNJ-61186372 monotherapy in HCC827 and HCC827-ER1 xenografts
A–C. Hierarchical clustering (Euclidian distance) of phosphopeptide changes for resistant
tumors from HCC827; Osimertinib (A), ER1; JNJ-61186372 (B) and HCC827-ER1; osimertinib (C) (left panels). Right panels represent bar graphs of the two most significantly overrepresented GO terms (biological process) among up- and downregulated phospho(p)-peptides for each tumor. Black bars in the heatmap (left panel) represent areas with phosphopeptides (represented by gene name and phosphorylated tyrosine) for which the corresponding gene support a GO term (highlighted and matched by color) in the bar
A
uthor Man
uscr
ipt
A
uthor Man
uscr
ipt
A
uthor Man
uscr
ipt
A
uthor Man
uscr
ipt
graph (right panel). * denotes multiple phosphorylated tyrosine-containing peptides. Triangles indicate association with multiple GO terms (matched by color).
A
uthor Man
uscr
ipt
A
uthor Man
uscr
ipt
A
uthor Man
uscr
ipt
A
uthor Man
uscr
ipt
Figure 6. Resistant tumors display reduced EGFR and SFK signaling networks and dual targeting of EGFR and residual SFK signaling confers superior growth inhibition
A. Phosphoprotein interaction networks for each group of resistant tumors as indicated. All
proteins are represented by their gene name and have at least one phosphopeptide with a relative ratio <0.5 compared to the 6 h vehicle treated tumors for minimum 6 of 9 tumors (TMT-10-plex) or 4 of 5 tumors (TMT-6-plex). Networks were generated using STRING. Non-connected nodes were not represented. B. Cell viability of H1975-HGF cells treated with osimertinib and saracatinib (left) or dasatinib (right) alone or in combination. The compounds were used at the indicated concentrations. For the combination (combo) treatment a constant ratio was applied for the individual compounds (IC50; osimertinib: 10
A
uthor Man
uscr
ipt
A
uthor Man
uscr
ipt
A
uthor Man
uscr
ipt
A
uthor Man
uscr
ipt
µM, saracatinib: 30 µM, dasatinib: 20 µM). Data represents means ± SEM of three biological replicates. * denotes a synergistic combination effect (ΔI>0).