Ute Eisenberger Harriet C. Thoeny Tobias Binser Mathias Gugger Felix J. Frey Chris Boesch Peter Vermathen Received: 28 May 2009 Revised: 31 August 2009 Accepted: 17 September 2009 Published online: 16 December 2009 # European Society of Radiology 2009
Evaluation of renal allograft function early
after transplantation with diffusion-weighted
MR imaging
Abstract Aims: To determine the inter-patient variability of apparent diffusion coefficients (ADC) and con-current micro-circulation contribu-tions from diffusion-weighted MR imaging (DW-MRI) in renal allografts early after transplantation, and to obtain initial information on whether these measures are altered in histo-logically proven acute allograft rejec-tion (AR). Methods: DW-MRI was performed in 15 renal allograft
reci-pients 5–19 days after transplantation.
Four patients presented with AR and one with acute tubular necrosis (ATN).
Total ADC (ADCT) was determined,
which includes diffusion and micro-circulation contributions. Further-more, diffusion and micro-circulation contributions were separated, yielding
the“perfusion fraction” (FP), and
“perfusion-free” diffusion (ADCD).
Results: Diffusion parameters in the ten allografts with stable function early after transplantation demonstrated low
variabilities. Values for ADCTand
ADCDwere (×10−5mm2/s) 228±14
and 203±9, respectively, in cortex and 226±16 and 199±9, respectively, in
medulla. FPvalues were 18±5% in
cortex and 19±5% in medulla. FP
values were strongly reduced to less than 12% in cortex and medulla of
renal transplants with AR and ATN. FP
values correlated with creatinine clearance. Conclusion: DW-MRI allows reliable determination of diffu-sion and micro-circulation contribu-tions in renal allografts shortly after transplantation; deviations in AR indicate potential clinical utility of this method to non-invasively monitor derangements in renal allografts. Keywords Diffusion . Perfusion . Kidney . Acute rejection . Allograft . Transplantation
Introduction
Intense allograft monitoring and early characterisation of dysfunction after renal transplantation are important to allow initiation of appropriate treatment and to improve the rate of successful outcome. Among others, acute rejection
(AR) remains a major complication after renal transplan-tation, which may reduce both short- and long-term graft
survival [1]. Until now, no reliable and accurate
non-invasive clinical methods were available to diagnose and distinguish between different renal allograft derangements such as AR and acute tubular necrosis (ATN).
Ute Eisenberger and Harriet C. Thoeny contributed equally to this work. U. Eisenberger . F. J. Frey Department of Nephrology and Hypertension,
University Hospital of Bern, Bern, Switzerland
H. C. Thoeny
Department of Radiology,
Neuroradiology and Nuclear Medicine, University Hospital of Bern,
Bern, Switzerland
T. Binser . C. Boesch . P. Vermathen Department of Clinical Research, University Hospital of Bern, Bern, Switzerland
M. Gugger
Department of Pathology, University Hospital of Bern, Bern, Switzerland
P. Vermathen (*)
Department of Clinical Research/ AMSM, University Bern, Pavillon 52, Inselspital,
P.O. Box 35, 3010 Bern, Switzerland e-mail: [email protected] Tel.: +41-31-6328174
Diffusion-weighted MR imaging (DW-MRI) is a promising non-invasive MR imaging method to obtain functional information about the renal allograft. Its application may therefore be instrumental in monitoring patients early after kidney transplantation. DW-MRI yields
a total “apparent diffusion coefficient” (ADCT) that
provides information on diffusion properties, but also includes contributions from concurrent micro-circulation
[2]. Provided diffusion and micro-circulation contributions
can be separated, DW-MRI may in addition provide information on micro-circulation, quantified with the
“perfusion fraction” (FP), and “perfusion-free” diffusion
(ADCD).
Compared with the brain, in which DW-MRI is routinely performed, applications in abdominal organs are only currently evolving because of a number of technical challenges, including respiratory and cardiac motion as
well as susceptibility artefacts [3–5]. Although DW-MRI
has been successfully applied in a number of studies for functional characterisation of native kidneys (for an
overview see [6]), to date only one animal study has
examined transplanted kidneys with DW-MRI [7], and
only one study in human transplanted kidneys has been published, demonstrating the feasibility and reproducibility of DW-MRI in allografts with stable function at least
4 months after transplantation [8]. In addition, the latter
DW-MRI study was the first to separately analyse the micro-circulation contribution in stable human transplanted kidneys. No DW-MRI study has yet been performed in human renal allografts shortly after transplantation, neither in healthy nor diseased patients. Previous studies have suggested that complications in renal allografts, like acute rejection, may lead to altered blood flow and/or changes in
reabsorption and concentration-dilution function [9, 10].
The separation of diffusion and micro-circulation contribu-tions may therefore be especially interesting in this condition.
Almost all previously published DW-MRI measure-ments in kidneys were performed at the lower field strength of 1.5 T, while 3-T MRI is being introduced more and more into clinical routine, mostly because of higher sensitivity
[5]. Previously, we showed that DW-MRI obtained on
1.5-T MRI in transplanted kidneys with good renal function about 9 months after transplantation yields stable and reproducible values for the total apparent diffusion
coef-ficient (ADCT), corresponding to the commonly
deter-mined diffusion parameter, the “perfusion-free” diffusion
coefficient (ADCD) and—although less stable—the
micro-circulation contribution [8].
The main goals of the current DW-MRI study on 3-T MRI in renal allografts shortly after transplantation were to determine the inter-patient variability of diffusion para-meters, including perfusion contributions, and to gain initial information on whether these measures are altered in histologically proven acute allograft rejection, providing a first impression of the sensitivity of the method.
Materials and methods
Patients and volunteers
The local ethics committee approved the study proto-col and all participants provided written informed consent.
The study group comprised 15 renal transplant patients (10 men, 5 women; mean age 47 ± 11 years;
age range 31–65 years), 11 first, 2 second and 2 third
transplantations (Table 1). All transplant recipients
eligible for the study and providing written informed consent were included in the study over a total period of 7 months. Mean time between transplantation and MRI
was 10 ± 4 days (range 5–19 days). Delayed graft
function occurred in four patients. Six patients received a kidney transplant biopsy which showed AR in four patients (two patients with signs of acute humoral rejection, positive C4d staining and presence of donor-specific serum antibodies, and two patients with acute cellular rejection), ATN/cholesterol embolism in one patient, and no AR or ATN, but signs of a donor-derived hyaline arteriolosclerosis in one patient. The last patient was considered to have a normal functioning transplant because no other clinical signs of allograft dysfunction were detected. In addition, 9 of the 15 patients demonstrated no clinical sign of major allograft complications and these patients were also considered to have a stable transplant function. Histological diagnosis
was assessed according to the Banff criteria [11–13].
For those patients undergoing a biopsy, the MR examination was performed within 5 days of the biopsy. No other imaging modality for detection of graft rejection was performed.
The subjects were told to eat and drink moderately; however, exact control of their hydration status was unnecessary, because only a low impact on diffusion
results under normal conditions was expected [6]. All
patients received triple immunosuppressive therapy based on a combination of cyclosporine starting at day 1 post-operatively, mycophenolate mofetil or mycophe-nolic acid and prednisone. Induction therapy was applied with basiliximab (Simulect®) on day 0 and day 4 in all patients. One patient (S13) with a panel reactive antibody (PRA) of 63% at transplantation additionally received intravenous immunoglobulin ther-apy (Octagam® Octapharma, Lachen, Switzerland) from day 0 to 3 post-transplantation.
Anti-rejection therapy consisted of at least three intra-venous methylprednisolone pulses in all patients with signs of AR, and additional plasmapheresis treatment for the two patients with acute humoral rejection.
Serum creatinine (s-Crea) concentrations were obtained from all subjects on the day of the MR examination and were used to calculate the creatinine clearance (eGFRc)
T able 1 Patient characteristics Subject Sex
Recipient age (years) Donor age (years)
T ime period between Tx and MR (days) No. Tx DGF
Biopsy diagnosis/ remark
s-Crea at time of MR examination (μmol/l) eGFRc at time of MR examination (ml/min/1.73 m 2 ) eGFRc 1 year after Tx (ml/min/1.73 2 m ) Results of morphological MRI S1 M 6 2 3 3 1 3 2 0 N A 9 2 8 3 8 0 L ymphocele S2 M 3 4 2 2 1 0 2 0 N A 8 3 108 68 Normal for new (2nd) kidney S3 M 3 5 4 3 7 1 0 NA 90 1 1 1 95 Small lymphocele S4 F 3 1 4 0 5 3 0 NA 63 85 61 Normal S5 F 3 3 4 4 1 9 1 0 N A 1 17 99 130 Normal S6 M 5 3 5 5 9 1 0 NA 174 55 94 Cortical cyst upper pole S7 M 3 8 7 2 7 1 0 Arteriolar hyalinosis 244 44 35 Normal S8 M 4 8 2 2 8 1 0 NA 91 75 50 Normal S9 M 6 5 6 9 1 2 1 1 N A 1 18 68 87 Cortical cyst upper pole S10 M 4 0 2 6 7 1 0 NA 135 78 98 Normal S1 1 M 41 61 6 1 1 A T N /c h o le st er o l embolism 440 24 30 Highly abnormal with patchy hypointensities and absent cortico-medullary dif ferentiation S12 M 5 9 5 8 1 0 1 0 ACR 230 29 27 Reduced cortico-medullary dif ferentiation S13 F 6 1 5 3 1 5 3 0 AHR 102 52 80 Normal S14 F 4 4 6 0 8 1 1 AHR 315 31 No # Normal S15 F 5 1 6 1 1 3 1 1 ACR 348 15 No (death) Absent cortico-medullary differentiation Abbr eviations : M male, F female, Tx transplantation, No. number , DGF delayed graft function, ACR acute cellular rejection, AHR acute humoral rejection, s-Cr ea serum creatinine concentration, eGFRc estimated glomerular filtration rate calculated by Cockcroft –Gault formula, NA no biopsy available, # nephrectomy
After 1 year of clinical post-transplant follow-up, renal function was preserved in 13 patients, one kidney with a previous severe acute rejection episode had to be removed (S14), one patient died from an infectious complication unrelated to allograft function (S15). Follow-up examina-tions did not include DW-MRI.
MR investigations
The MR measurements were performed on a 3-T MRI system (TIM-Trio; Siemens, Erlangen, Germany) using a combination of a spine coil and a phased array body coil with six elements.
Before the patient investigations, the DW-MRI
measurement parameters were optimised to achieve sufficient image quality, which is challenging in the abdomen, especially at higher field strengths. Optimisa-tion included reducOptimisa-tion of echo times and geometric distortions by selection of bandwidth or parallel imaging acceleration factor, or evaluation of the benefit using a dielectric pad to reduce signal voids from dielectric
effects [15]. Morphological imaging included coronal
T2-weighted half-Fourier acquisition single-shot turbo spin-echo (HASTE) imaging, and axial and coronal T1-weighted fast low angle shot (FLASH) gradient-echo imaging. For DW-MRI, a coronal diffusion-weighted multisection single-shot echo-planar imaging sequence was applied. In order to be able to separate micro-circulation from diffusion contributions, ten diffusion
gradient b values between 0 and 700 s/mm2 were
applied (0, 10, 20, 50, 100, 180, 300, 420, 550, 700 s/
mm2). The maximum b value was chosen based on
previously determined renal ADC values leaving
sufficient signal clearly above noise level. The b values were spaced non-equidistantly with several low b values, to account for the fast-decaying contribution from micro-circulation.
The following imaging parameters were used: 11 slices with a thickness of 5 mm and an intersection gap
of 1 mm, field of view = 400 × 400 mm2, matrix = 128 ×
128, six averages, bandwidth = 2,300 Hz/pixel, voxel
size = 3.1× 3.1× 5.0 mm3, phase encoding direction RL.
The diffusion gradients were applied in three orthogonal directions and subsequently averaged, minimising ef-fects of diffusion anisotropy. Parallel imaging (iPAT, GRAPPA) with an acceleration factor of 3 was applied. Respiratory triggering was used to reduce motion artefacts with a minimum TR of 2,800 ms and TE of 64 ms. Slice positioning was identical to the coronal T1-weighted sequence. Minimum acquisition time was 8 min, depending on the breathing cycle. The entire MR examination including positioning, morphological imaging and DW-MRI lasted about 30 min.
Image analysis
All participants’ studies were included in the analysis. The
data were evaluated on an independent workstation using a home-built IDL program (Interactive Data Language, RSI, Boulder, CO, USA).
Morphological evaluation
The morphological images were read by an experienced radiologist, subspecialised in urogenital radiology. The
findings are summarised in Table1.
DW-MRI evaluation
DW-MRI findings were analysed completely blinded with respect to all clinical findings to eliminate any bias. Processing of the DW-MRI data was performed on a pixel-by-pixel basis in two different ways as previously
described [8]. In brief: (1) A single ADC value (ADCT)
was calculated from all b values using a monoexponential fitting model and includes contributions from both diffu-sion and perfudiffu-sion. This method corresponds to the commonly applied procedure. (2) In a second analysis of the same data, diffusion and micro-circulation contribu-tions were separated by biexponential fitting (assuming a fast- and slow-decaying component with increasing b values assigned to perfusion and diffusion contributions, respectively) of the signal intensities at all multiple b
values. This analysis yielded (a) the “perfusion fraction”
(FP), i.e. the contribution of micro-circulation of blood and
movement in predefined structures such as renal tubules,
and (b) an ADC value (ADCD), reflecting predominantly
pure diffusion. From the results for each pixel, maps for the different diffusion parameters were created and could be displayed.
Ellipsoid regions of interest (ROIs) were positioned on coronal T1-weighted images for anatomical guidance and simultaneously on co-registered diffusion images at
b= 0 s/mm2 or on calculated diffusion maps. The ROIs
were placed in the upper, mid and lower poles of the cortex and medulla on several slices covering large parts of the allograft (mean total number of ROIs 11.0 ± 3.8 for both cortex and medulla; mean individual ROI size
0.47± 0.02 cm3 and 0.45 ± 0.02 cm3 for cortex and
medulla, respectively). Single total ROIs were created separately for cortex and medulla by merging all individual ROIs, yielding one ROI for the cortex and one for the medulla. This procedure yields overall cortical or medullary diffusion properties. However, in order to assess possible focal changes in addition, which might be missed or diluted otherwise, an individual ROI
was placed in a “selected region” for each subject, i.e. in a hypo- or hyperintense region within renal tissue on the diffusion maps. This was performed no matter if this region appeared to be within normal range or not. As all processing steps, including diffusion map inspection and ROI positioning, were performed blinded to the
results no bias was introduced by examining “selected
regions”.
Statistical analysis
For this initial study, which aims to determine the feasibility of performing DW-MRI measurements in renal allografts early after transplantation, a sample size of ten patients with stable allograft function and of another five patients with complications was considered sufficient. A power analysis based on these numbers and on previous
DW-MRI results [8] yields a difference between deranged
and stable kidneys of less than 10% in ADCDand ADCT
and of approximately 40% in FPwhich could be detected
at a significance level of 0.05 and a statistical power of 80%. These calculated differences can be presumed reasonable in view of previous results. However, a detailed quantitative comparison between the groups was beyond the scope of the present investigation.
Mean and standard deviations of ADCT, ADCDand FP
were calculated for the ten patients without clinical or laboratory signs of transplant dysfunction and paired t tests were performed for group comparisons between cortex and medulla in stable allografts after testing for normal
distribution with a Kolmogorov–Smirnov Test. The
Mann–Whitney U test for unpaired samples was performed
for comparisons between stable allografts and kidneys with acute rejection. However, because of the low number of patients with transplant dysfunction, the results were compared mainly descriptively as an indication of a possible trend for differences between the groups. Diffu-sion parameters were correlated with the estimated creat-inine clearance by employing Pearson linear regression analysis. A p value of less than 0.05 was considered statistically significant. Statistical analysis was performed with SPSS, version 12.0.1 (SPSS Inc., Chicago, Ill, USA).
Results
Stability of parameters from DW-MRI
No patient data had to be removed from the analysis because of insufficient quality, i.e. all 15 investigated subjects were included in the analysis. Mean values and
standard deviations of ADCT, ADCD and FP values in
medulla, cortex and in selected regions were calculated
from the ten patients with stable allograft function
(Table 2). Standard deviations for all ADC values were
low with coefficients of variation in the range of 4–7%,
while for FPthe variance was greater with approximately
25%. ADCT and FP values were similar in cortex and
medulla. On the other hand, ADCD values were slightly,
but significantly, higher in cortex than in medulla (203±9
vs. 199±9×10⁻⁵mm2/s, p<0.02).
Diffusion maps: examples and comparison with histology
In two subjects (S1, S2) with second transplantation, but stable allograft function, the DW-MRI measurement covered both the recently transplanted functioning kidney as well as the previously transplanted non-functioning kidney within the same image planes. This allows for an illustrative comparison of maps of the derived parameters
between the two kidneys (Fig.1shows the maps of S2) and
may provide a first impression of the sensitivity of this
method. The parameters ADCT, ADCDand especially the
perfusion fraction Fpwere strongly reduced in the older and
insufficiently functioning kidneys compared with the new
allografts (Fig. 1). The overall values for the two older
allografts were ADCT=165 and 169×10−5mm2/s, ADCD=
157 and 153×10−5mm2/s, FP=6 and 11%, for S1 and S2,
respectively.
DW-MRI parameter maps of an allograft with acute
rejection (see Table 1, patient S14) are shown in Fig. 2
together with the corresponding histological sections from
the transplant biopsy. The strongly reduced ADCT, ADCD
and FP in this subject (see Table 2) may correspond to
interstitial leukocytic infiltration, peritubular capillaritis and/or tubular casts as shown on the histological section
(see Fig.2).
Results from DW-MRI in kidneys with relevant functional derangements
The ADCT values of the four grafts with histologically
proven evidence of acute rejection were lower than those of eight (cortex and medulla) or nine (selected regions) of the
ten recipients with stable allograft function (Table2). The
ADCT differences between the two patient groups were
significant for all tissue types (p<0.03).
Compared with ADCT, ADCD values, which mostly
represent pure diffusion, were relatively similar for all
subjects (Table 2). It is interesting to note that the only
kidney that had to be nephrectomised 50 days after the MR measurement because of persistent acute humoral rejection
had by far the lowest ADCTand ADCD values in all the
allografts with an acute rejection demonstrated reduced micro-circulation contributions in medulla (p<0.03), cor-tex (p<0.03) and in selected regions in the allograft (p<
0.01): FP values were lower in all four rejecting kidneys
than in 9/10 (cortex) and in 8/10 (medulla and selected
regions) kidneys with stable function (Fig.3).
ADCT in the single patient with ATN and additional
signs of cholesterol emboli appeared slightly decreased
Fig. 1 Morphological MR images and parameter maps from DW-MRI of one subject (S2) presenting first with an inadequately functioning allograft (right side) and a well-functioning allograft (left side). T1-weighted FLASH-MRI (a), maps for ADCT (b),
ADCD(c) and FP(d). The signal intensity was lower (darker shade)
on all diffusion maps of the first implanted (smaller) kidney
compared with the recently implanted kidney. The difference between the first and the second allograft appears to be most pronounced for FPand to a lesser extent for ADCDand ADCT. A
small haemorrhagic cyst in the upper pole and a small simple cyst in the lower pole of the right kidney are visualised
Table 2 Results from DW-MRI in renal allografts with and without functional derangements
Diagnosis Subject Cortex Medulla Selected regiona
ADCT ADCD FP(%) ADCT ADCD FP(%) ADCT ADCD FP(%)
(10−5mm2/s) (10−5mm2/s) (10−5mm2/s)
Stable renal function S1 217 209 8 209 197 10 218 203 12
S2 240 207 23 246 204 27 241 204 24 S3 230 204 19 225 196 20 221 199 17 S4 200 183 12 194 180 10 192 175 13 S5 225 199 18 216 192 17 218 194 17 S6 246 211 25 241 208 24 240 210 21 S7 233 204 19 240 204 22 233 207 19 S8 240 214 19 234 203 21 221 193 20 S9 220 193 18 221 193 18 218 189 20 S10 234 209 18 234 210 18 235 208 19 Mean ± sd 228±14 203±9 18±5 226±16 199±9 19±5 224±15 198±11 18±4 ATN S11 209 198 8 215 203 9 211 206 6 Acute rejection S12 217 205 9 197 183 10 195 180 11 S13 205 193 10 203 192 9 198 189 9 S14 161 145 11 171 154 12 160 142 13 S15 219 206 11 212 199 10 214 209 6
Mean and standard deviation (sd) were calculated for allografts with normal function.
a
and, in particular, the micro-circulation contribution FPwas
very low in all tissues investigated (Table2and Fig.3).
Comparison between parameters from DW-MRI and estimated glomerular filtration rate calculated
with the Cockcroft–Gault formula (eGFRc)
Significant correlations were determined between eGFRc
and the micro-circulation contribution (FP) in cortex (R=
0.53, p<0.05, Fig.4a), medulla (R=0.52, p<0.05, Fig.4b)
and selected regions (R=0.63, p<0.02, Fig.4c). Estimated
GFRc did not correlate significantly with ADCTor ADCD
in any of the renal regions investigated.
Discussion
The results of this DW-MRI study on 3-T MRI demonstrate that diffusion parameters can be determined in well-functioning renal allografts shortly after transplantation with low inter-patient variability, also including determi-nation of micro-circulation contributions; the magnitude of changes of the parameters assessed in subjects with histologically proven acute rejection or ATN indicates potential clinical utility of the method to non-invasively monitor derangements in renal allografts.
Other non-invasive methods of detecting allograft dysfunction
Many diagnostic attempts have been made to reduce the need for an invasive transplant biopsy, considered the “gold standard” for the diagnosis of parenchymal dysfunc-tion, including acute rejection. Ultrasound characteristics of rejection occur only late after rejection and are
non-specific [16]. The addition of serial measurements of
resistance index by colour-coded duplex ultrasound Fig. 2 Morphological MRIs
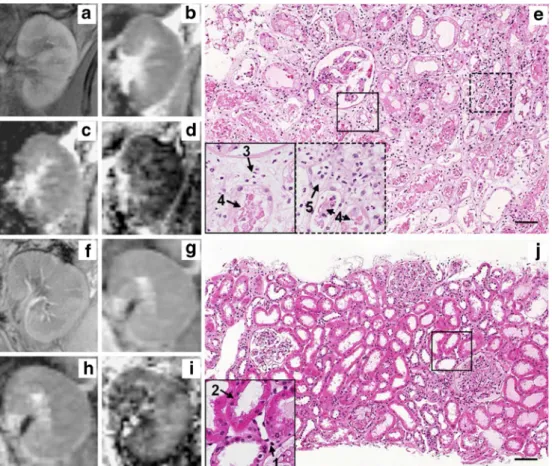
(a), maps for ADCT(b), ADCD
(c), FP(d) and corresponding
histological section (e) for S14 presenting with signs of acute humoral rejection, namely in-terstitial oedema and peritubular capillaritis (5), as well as a low-grade interstitial infiltrate (3). The morphological MR images did not show any conspicuities. For comparison, corresponding MRIs (f–i) of a well-functioning kidney and a normal histological section (j) are also presented. The arrows pinpoint 1 = inter-stitial space, 2 = proximal tu-bule, 3 = interstitial leukocytic infiltration, 4 = tubular cast, 5 = peritubular capillaritis (H&E staining, bar = 100 µm)
Fig. 3 Perfusion fraction, FP(%), in cortex (a), medulla (b) and
“selected regions” (c) for transplanted kidneys with normal function (N), acute rejection (AR) or acute tubular necrosis (ATN)
increases the sensitivity, but specificity remains low [17,
18]. The diagnostic value of renal scintigraphy, especially
for prediction of acute rejection, is also limited [19].
The most consistent sign of acute rejection reported is the loss of cortico-medullary differentiation on
contrast-enhanced MR renography [20], although it appears to be a
relatively non-specific finding in acute rejection, with
overlap with other disease processes [21]. Thus, other
non-invasive methods have to be considered, including MR-based functional renal imaging.
Blood oxygen level-dependent (BOLD) MRI has been shown to be of potential clinical value in transplanted
kidneys [8] and may be helpful for evaluation and
separation of kidney allograft dysfunction like ATN or
acute rejection [22,23]. Previously we have shown that the
relaxation rate from BOLD MRI and FP from DW-MRI
provide complementary information [8]. Accordingly, a
comparison of the two methods in renal dysfunction would be of interest. However, BOLD MRI in renal transplanta-tion appears more challenging at 3 T than 1.5 T and is prone
to artefacts, presently limiting its utility [24].
Stability of parameters from DW-MRI and diffusion and perfusion separation
A separation of diffusion and perfusion contributions from DW-MRI measurements was accomplished in the present
study, yielding ADCD, which reflects primarily pure
diffusion, and FP, the perfusion fraction, which reflects
micro-circulation of blood and/or movement of fluids in predefined structures such as tubules and glomeruli. ADC
values and FP, although less marked, exhibited a low
inter-subject variability in the 10 stable functioning allografts early after transplantation.
The separation of perfusion and diffusion parameters from DW-MRI measurements was first proposed about
20 years ago by Le Bihan et al. [2] and has been discussed
ever since, also for imaging of abdominal organs [25–28].
The current investigation suggests that this separation may be clinically useful and provides additional information compared with the standard procedure of estimating only a
single ADC value, corresponding to ADCTin our analysis.
This separation may lead to a better differentiation between
different entities, as suggested in the present study when the distinct parameters were compared between stable and acutely rejected kidneys. Although speculative on the basis
of only four cases of rejection, the lower FPin grafts with
AR in the presence of relatively unchanged ADCDsuggests
that lower micro-circulation rather than reduced diffusion
accounts for the lower ADCT. A similar finding was
observed recently in a DW-MRI study by Luciani et al. [26]
in patients with liver cirrhosis: While ADCD values
appeared unchanged, indicating unchanged diffusion, the perfusion was decreased in cirrhotic patients. Without the diffusion/perfusion separation, these changes would have been missed, or erroneously attributed to altered diffusion. In the current study, mean values and standard
devia-tions for ADCD and FP in patients with stable allograft
function 10±4 days after transplantation are very similar to those of our previous investigation in 15 stable renal allografts on average 9 months after transplantation, despite differences in measurement parameters and field
strength [8] (previously, ADCDvalues (×10−5mm2/s) were
198±10 and 198±7 in cortex and medulla, respectively; FP
values were 19±4% and 18±5% in cortex and medulla,
respectively). The ADCTvalues were slightly higher in the
allografts of the current study compared with the previous
ones (previously, ADCTvalues (×10−5mm2/s) were 217±
14 and 217±11 in cortex and medulla, respectively). In line
with the present results, ADCT and FP were previously
found to be similar in cortex and medulla of transplanted kidneys, a finding contrary to that of native kidneys with
higher ADC and FPvalues in cortex than in medulla [8]. In
our previous study, ADCD values determined in renal
allografts were also not different in medulla and cortex. In
the present investigation, however, ADCD values were
slightly higher in the cortex compared with the medulla. This may be a spurious difference or may be due to the different time point of the measurements after transplan-tation. Nevertheless, the similarity between the previously and currently determined values, obtained on various imaging systems with different measurement parameters and field strengths, suggests that the results may be comparable in absolute terms across different studies or institutions. However, the separation of micro-circulation contributions and diffusion appears to be a prerequisite. If this separation is neglected, the resulting ADC values will Fig. 4 Correlation between
es-timated glomerular filtration rate (eGFRc) calculated by the Cockcroft–Gault formula and FP
(%) in cortex (a), medulla (b) and selected regions (c). Black diamonds normal function, red diamonds acute rejection, blue circle ATN
depend on the measurement parameters, namely the strength of parameters for diffusion weighting. This most likely explains the anticipated differences between the
ADCTvalues in the previous and current studies. Similarly,
different diffusion-weighting parameters probably account for inconsistencies and differences between published “total” ADC values for native kidneys (for an overview
see e.g. [6,29]).
Functional relevance and limitations of the study
The micro-perfusion contribution was lower in cortex,
medulla and “selected regions” of the four kidney
transplants with evidence of rejection compared with stable transplants. The changes in AR were only slightly
more pronounced in “selected regions” (Fig. 3). Thus,
compared to overall cortical or medullary diffusion
properties the analysis of “selected regions” did not yield
a clearly superior separation of the few allografts with dysfunction. Nevertheless, in combination with simple determination of signal intensities of the diffusion maps the
rather strong ADCTand FPreductions in dysfunction may
suggest a clinical role for visual analysis of individual diffusion maps.
The decreased FP paralleled a reduced estimated GFR.
These results are in line with observations by Jani et al.
[10], who quantified renal blood flow by
para-aminohip-puric acid and GFR by inulin clearance in patients with acute rejection and observed a decrease in renal blood flow by 45 to 70% and a reduced GFR. Besides the rejection process, the impaired haemodynamics might partly be explained by the administration of calcineurin inhibitors
[30]. However, since the immunosuppressive regime in all
our study patients was the same and calcineurin levels comparable (results not shown), it is unlikely that calcineurin inhibition accounts for the differences in micro-circulation observed between patients with and
without functional derangements [31,32]. Thus, according
to our preliminary results, FPmay help to estimate changes
in renal blood flow non-invasively in different parts of the kidney and provide further insight into mechanisms accounting for impaired renal haemodynamics after renal transplantation.
There are a number of limitations to our study: First, although care was taken not to select regions for determining diffusion parameters in the kidneys that were close to the site of biopsy, it cannot be excluded that the biopsy, which was performed mostly in patients with acute rejection, may have affected the results. Second, the patients with rejection had already been given a high dose of methylprednisolone at the time of the MR investigation. Although unlikely, we cannot exclude an effect of this intervention independent of the histologically proven rejection. Third, ROI placement and reading was performed by only one reader and only once, potentially introducing reader related bias and preventing determina-tion of inter- and intra-rater reliability. Forth, the clinical utility of the time-consuming and costly MR investigation awaits confirmation in a larger cohort and no final conclusion on its value in AR can currently be drawn. This is especially true for the single ATN case: although the finding of reduced micro-circulation is reasonable in a physiological sense, it is not possible to draw any clinically relevant conclusion on whether the method allows AR to be distinguished from ATN.
Conclusion
The application of DW-MRI in renal allografts holds promise as a tool for non-invasive detection and monitor-ing of functional and structural derangements early after transplantation.
Acknowledgement This work was supported by the Swiss National Foundation 320000–113512/1 and 320000–111959/1.
References
1. Cecka JM (2003) The OPTN/UNOS renal transplant registry 2003. Clin Transpl 1–12
2. Le Bihan D, Breton E, Lallemand D, Aubin ML, Vignaud J, Laval-Jeantet M (1988) Separation of diffusion and perfusion in intravoxel incoherent mo-tion MR imaging. Radiology 168:497– 505
3. Prasad PV, Priatna A (1999) Functional imaging of the kidneys with fast MRI techniques. Eur J Radiol 29:133–148
4. Schick F (2005) Whole-body MRI at high field: technical limits and clinical potential. Eur Radiol 15:946–959 5. Machann J, Schlemmer HP, Schick F
(2008) Technical challenges and op-portunities of whole-body magnetic resonance imaging at 3T. Phys Med 24:63–70
6. Thoeny HC, De Keyzer F, Oyen RH, Peeters RR (2005) Diffusion-weighted MR imaging of kidneys in healthy volunteers and patients with parenchy-mal diseases: initial experience. Radi-ology 235:911–917
7. Yang D, Ye Q, Williams DS, Hitchens TK, Ho C (2004) Normal and trans-planted rat kidneys: diffusion MR im-aging at 7 T. Radiology 231:702–709 8. Thoeny HC, Zumstein D, Simon-Zoula
S, Eisenberger U, De Keyzer F, Hofmann L, Vock P, Boesch C, Frey FJ, Vermathen P (2006) Functional evaluation of transplanted kidneys with diffusion-weighted and BOLD MR imaging: initial experience. Radiology 241:812–821
9. Venz S, Kahl A, Hierholzer J, Gutberlet M, Windrich B, Bechstein WO, Hosten N, Frei U, Felix R (1999) Contribution of color and power Doppler sonogra-phy to the differential diagnosis of acute and chronic rejection, and tacro-limus nephrotoxicity in renal allografts. Transpl Int 12:127–134
10. Jani A, Polhemus C, Corrigan G, Kwon O, Myers BD, Pavlakis M (2002) Determinants of hypofiltration during acute renal allograft rejection. J Am Soc Nephrol 13:773–778
11. Racusen LC, Solez K, Colvin RB, Bonsib SM, Castro MC, Cavallo T, Croker BP, Demetris AJ, Drachenberg CB, Fogo AB, Furness P, Gaber LW, Gibson IW, Glotz D, Goldberg JC, Grande J, Halloran PF, Hansen HE, Hartley B, Hayry PJ, Hill CM, Hoffman EO, Hunsicker LG, Lindblad AS, Yamaguchi Y (1999) The Banff 97 working classification of renal allograft pathology. Kidney Int 55:713–723 12. Racusen LC, Colvin RB, Solez K,
Mihatsch MJ, Halloran PF, Campbell PM, Cecka MJ, Cosyns JP, Demetris AJ, Fishbein MC, Fogo A, Furness P, Gibson IW, Glotz D, Hayry P, Hunsickern L, Kashgarian M, Kerman R, Magil AJ, Montgomery R,
Morozumi K, Nickeleit V, Randhawa P, Regele H, Seron D, Seshan S, Sund S, Trpkov K (2003) Antibody-mediated rejection criteria-an addition to the Banff 97 classification of renal allograft rejection. Am J Transplant 3:708–714 13. Solez K, Colvin RB, Racusen LC, Haas
M, Sis B, Mengel M, Halloran PF, Baldwin W, Banfi G, Collins AB, Cosio F, David DS, Drachenberg C, Einecke G, Fogo AB, Gibson IW, Glotz D, Iskandar SS, Kraus E, Lerut E, Mannon RB, Mihatsch M, Nankivell BJ, Nickeleit V, Papadimitriou JC, Randhawa P, Regele H, Renaudin K, Roberts I, Seron D, Smith RN, Valente M (2008) Banff 07 classification of renal allograft pathology: updates and future directions. Am J Transplant 8:753–760
14. Cockcroft DW, Gault MH (1976) Pre-diction of creatinine clearance from serum creatinine. Nephron 16:31–41 15. Vermathen P, Eisenberger U, Boesch C,
Thoeny HC (2006) Diffusion weighted imaging in native and transplanted human kidneys at 3T. Initial experi-ence. Proc Intl Soc Magn Reson Med 14:1234
16. Baxter GM (2001) Ultrasound of renal transplantation. Clin Radiol 56:802– 818
17. Hollenbeck M, Hilbert N, Meusel F, Grabensee B (1994) Increasing sensi-tivity and specificity of Doppler sono-graphic detection of renal transplant rejection with serial investigation tech-nique. Clin Investig 72:609–615 18. Tublin ME, Bude RO, Platt JF (2003)
Review. The resistive index in renal Doppler sonography: where do we stand? AJR Am J Roentgenol 180:885– 892
19. Heaf JG, Iversen J (2000) Uses and limitations of renal scintigraphy in renal transplantation monitoring. Eur J Nucl Med 27:871–879
20. Hricak H, Terrier F, Marotti M, Engelstad BL, Filly RA, Vincenti F, Duca RM, Bretan PN Jr, Higgins CB, Feduska N (1987) Posttransplant renal rejection: comparison of quantitative scintigraphy, US, and MR imaging. Radiology 162:685–688
21. Zhang H, Prince MR (2004) Renal MR angiography. Magn Reson Imaging Clin N Am 12:487–503 vi 22. Sadowski EA, Fain SB, Alford SK,
Korosec FR, Fine J, Muehrer R, Djamali A, Hofmann RM, Becker BN, Grist TM (2005) Assessment of acute renal transplant rejection with blood oxygen level-dependent MR imaging: initial experience. Radiology 236:911– 919
23. Djamali A, Sadowski EA, Samaniego-Picota M, Fain SB, Muehrer RJ, Alford SK, Grist TM, Becker BN (2006) Noninvasive assessment of early kid-ney allograft dysfunction by blood oxygen level-dependent magnetic res-onance imaging. Transplantation 82:621–628
24. Agrawal G, Fain SB, Artz N, Wentland AL, Grist TM, Djamali A, Sadowski EA (2009) Blood-oxygen level depen-dent (BOLD) imaging in native and transplanted kidneys on 1.5T and 3.0T. Proc Intl Soc Magn Reson Med 17:2027
25. Muller MF, Prasad PV, Edelman RR (1998) Can the IVIM model be used for renal perfusion imaging? Eur J Radiol 26:297–303
26. Luciani A, Vignaud A, Cavet M, Nhieu JT, Mallat A, Ruel L, Laurent A, Deux JF, Brugieres P, Rahmouni A (2008) Liver cirrhosis: intravoxel incoherent motion MR imaging-pilot study. Radi-ology 249:891–899
27. Le Bihan D (2008) Intravoxel incoher-ent motion perfusion MR imaging: a wake-up call. Radiology 249:748–752 28. Wirestam R, Borg M, Brockstedt S,
Lindgren A, Holtas S, Stahlberg F (2001) Perfusion-related parameters in intravoxel incoherent motion MR im-aging compared with CBV and CBF measured by dynamic susceptibility-contrast MR technique. Acta Radiol 42:123–128
29. Thoeny HC, De Keyzer F (2007) Extracranial applications of diffusion-weighted magnetic resonance imaging. Eur Radiol 17:1385–1393
30. Myers BD, Newton L (1991) Cyclo-sporine-induced chronic nephropathy: an obliterative microvascular renal in-jury. J Am Soc Nephrol 2:S45–S52 31. Nilsson L, Ekberg H, Falt K, Lofberg
H, Sterner G (1994) Renal arteriove-nous shunting in rejecting allograft, hydronephrosis, or haemorrhagic hy-potension in the rat. Nephrol Dial Transplant 9:1634–1639
32. Tinckam KJ, Djurdjev O, Magil AB (2005) Glomerular monocytes predict worse outcomes after acute renal allo-graft rejection independent of C4d status. Kidney Int 68:1866–1874