Publisher’s version / Version de l'éditeur:
Vous avez des questions? Nous pouvons vous aider. Pour communiquer directement avec un auteur, consultez la première page de la revue dans laquelle son article a été publié afin de trouver ses coordonnées. Si vous n’arrivez pas à les repérer, communiquez avec nous à [email protected].
Questions? Contact the NRC Publications Archive team at
[email protected]. If you wish to email the authors directly, please see the first page of the publication for their contact information.
https://publications-cnrc.canada.ca/fra/droits
L’accès à ce site Web et l’utilisation de son contenu sont assujettis aux conditions présentées dans le site
LISEZ CES CONDITIONS ATTENTIVEMENT AVANT D’UTILISER CE SITE WEB.
RTO-TR-AVT-080 - Vortex Breakdown over Slender Delta Wings, pp. 5-1-5-44,
2009-10
READ THESE TERMS AND CONDITIONS CAREFULLY BEFORE USING THIS WEBSITE.
https://nrc-publications.canada.ca/eng/copyright
NRC Publications Archive Record / Notice des Archives des publications du CNRC :
https://nrc-publications.canada.ca/eng/view/object/?id=553d37bb-8c61-4b46-bd47-165cb5e716ce https://publications-cnrc.canada.ca/fra/voir/objet/?id=553d37bb-8c61-4b46-bd47-165cb5e716ce
NRC Publications Archive
Archives des publications du CNRC
Access and use of this website and the material on it are subject to the Terms and Conditions set forth at
Comprehensive experimental studies on vortex dynamics over military
wing configurations in IAR
Xing Huang
Aerodynamics Laboratory Institute for Aerospace Research National Research Council of Canada 1200 Montreal Rd., Ottawa Ont. Canada K1A 0R6ABSTRACT
Vortex dynamics over more than 50 types of military wing configurations have been experimentally investigated. Diamond and delta wings with sweep back angles from 55° to 75° have been tested. The experiments were conducted in two wind tunnels and a water tunnel with more than 10,000 runs at different test conditions. Investigations include flow visualisations (surface and off-surface flow field and vortex behavior), surface pressures (steady and unsteady pressure), air loads (steady and unsteady loads) and motion histories (harmonic, ramp-and-hold, free-to-roll and “forced” free-to-roll), geometry and Re number effects in pitch, roll and coning motion plans. The ranges of angle of attack, roll angle and coning angle are 0°~90°, ±180° and ±360° respectively with maximum non-dimensional frequency 0.2 in pitch and roll and 0.6 in coning respectively. The maximum Re number is 3x10⁶ and maximum Mach number is 0.4 in wind tunnel experiments. The comprehensive data sets have been edited into eight volumes of IAR reports while only a brief of the program is presented here.
5.1 INTRODUCTION
The tactical advantage of high maneuverability and agility of military air vehicles has been an incentive to continually expand their flight envelope. Many high manoeuvre aerial vehicles including UCAVs, take delta wing, double delta wing or diamond wing as basic configurations and operate at near- and post-stall regimes. The flow over the wing area is characterised by the strong leading-edge vortices used for extra aerodynamic forces and control power required to expand the flight envelope and to improve the tactical advantage in air combat. A disadvantage, however, is that the vortices may breakdown resulting in non-linear and time dependent airloads. Conventional aerodynamic models cannot model these features. Due to lack of sufficient understanding of the flow physics, current CFD capabilities and mathematical models are unable to accurately predict the flight mechanics at those flight conditions. Thus, it is crucial to study the flow physics and to establish a completed, comprehensive and quantitatively reliable data set for the development of CFD and analytic solutions applicable to those regimes.
In order to meet the challenges, the Aerodynamics Laboratory in the Institute for Aerospace Research (AL/IAR) has launched a research program. It was initiated from a joint program between IAR and SARL in USAF conducted by E. Hanff (IAR) and J. Jenkins (AFRL/USAF) and their colleagues from 1989 to
19941,2. It produced results on air loads under static and dynamic situation based on a 65° delta wing
configuration but it has less information on flow behavior such as surface pressure, off-surface velocity field, geometry effect (e.g. leading-edge shape, sweep back angle or centerbody effect), and Reynolds number effects, etc. Also since the experiments were conducted in different facilities at different times with different data formats, it was imperative to edit and to evaluate the data sets, so that the extensive work already performed at a high cost could be properly used. Thus more experimental studies were performed thereafter in IAR until 2003 to broaden the base of the original program. All data sets were
RTO-TR-AVT-080 5 - 1
Chapter 5 – COMPREHENSIVE EXPERIMENTAL STUDIES
ON VORTEX DYNAMICS OVER MILITARY
edited and presented in Ref. 3 in a user-friendly format.
Up to now more than 50 types of different military wing configurations were tested in three facilities (two wind tunnels and one water tunnel) with different support systems. The main wind-tunnel entries are listed in Table 1 where some supplementary tests may not be included. A total of over 10,000 runs were conducted between 1989 and 2003. All three motion plans (pitch, roll and coning) and different waveforms were investigated. Comprehensive measurements include surface and off surface flow field, surface pressure, air loads, geometry effect and Reynolds number’s effect etc. The experiments were
performed at angle of attack up to 90°, roll angle up to 180°, Reynolds number up to 3.6 x10⁶ and
non-dimensional frequency up to ±0.2 and ±0.6 in pitch or roll and coning respectively.
The comprehensive program and results have been edited into eight volumes of IAR reports [2], namely: Vol. 1 Test matrix and conditions
Vol. 2 Highlights of the results
Vol. 3 Surface and off-surface flow visualisations in static and dynamic model conditions Vol. 4 Surface pressure in static model conditions
Vol. 5 Surface pressure in dynamic model conditions
Vol. 6 Aerodynamic loads and moments in static and dynamic model conditions Vol. 7 Free-to-roll and “forced” free-to-roll results
Vol. 8 Non-planar experimental results
From author’s knowledge it is one of the most completed, comprehensive and state-of-the-art data set on vortex dynamics over military wing configurations. Given the large amount of information acquired between 1989 and 2003, only briefing of the program and highlights of the results are given here.
5.2 EXPERIMENTAL SET-UP
5.2.1 EXPLOITED AREAS
The test program covers the following exploited areas: • Measurements obtained:
(1) Surface and off-surface flow field, including oil flow, Laser-smoke sheet and Particle-Image-Velocimetry (PIV) measurements.
(2) Surface pressure, including steady surface pressure obtained by pressure sensitive paint (PSP), pressure taps and unsteady pressure by and unsteady pressure transducers.
(3) Air loads, including time-averaged loads in steady model conditions and instantaneous or ensample average unsteady loads in dynamic model conditions.
(4) Geometrical effects, such as leading-edge shape, wing planform (delta wing or diamond wing), centre-body, forebody or aft body etc.
(5) Re number effect.
• Motion plan and motion variable:
(1) Experiments were conducted either in roll, pitch or coning motion at either static or dynamic model
COMPREHENSIVE EXPERIMENTAL STUDIES ON VORTEX DYNAMICS OVER MILITARY WING CONFIGURATIONS IN IAR
conditions.
(2) In rolling motion, roll angle ranged from –180° to +180° with maximum amplitude of 40° around maximum offset of ±50° and with a maximum non-dimensional frequency 0.2. In addition, free-to-roll motion and “forced” free-to-free-to-roll motion were also performed.
(3) In pitch motion, the angle of attack ranged from –4° to 93° with maximum angular rate, maximum angular acceleration and non-dimensional frequency 1900 °/s, 79,000 °/s2 and 0.2 respectively. (4) In coning motion, the coning angle ranged from –360° to +360° with a maximum non-dimensional
coning rate of 0.6.
(5) The motion waveforms included harmonic oscillation, ramp-and-hold motion, quasi-steady coning motion, free-to-roll and “forced” free-to-roll motions.
5.2.2 WIND TUNNELS
The tests were conducted in the IAR low speed wind tunnel (LSWT), USAF/AFRL subsonic tunnel (SARL) and the IAR 1520 water tunnel. Both IAR LSWT and USAF/AFRL SARL wind tunnels are atmospheric facilities with a maximum wind speed of 120 and 200 m/s respectively. The IAR wind tunnel test section is 2.7m wide, 1.83 m high and 4.57m long. Its turbulence intensity levels in wind tunnel are 0.12% at 30m/s and 0.15% at 75m/s. The SARL facility is an open return wind tunnel with test section 2.1m wide, 3m high and 4.57m long. The contraction ratio is 36:1 resulting in a turbulence intensity level of 0.1%. The water tunnel section is 0.38x0.5 m. Both wind tunnels and water tunnel have excellent visual access to the test section, thus facilitating flow visualization experiments.
5.2.3 MODELS
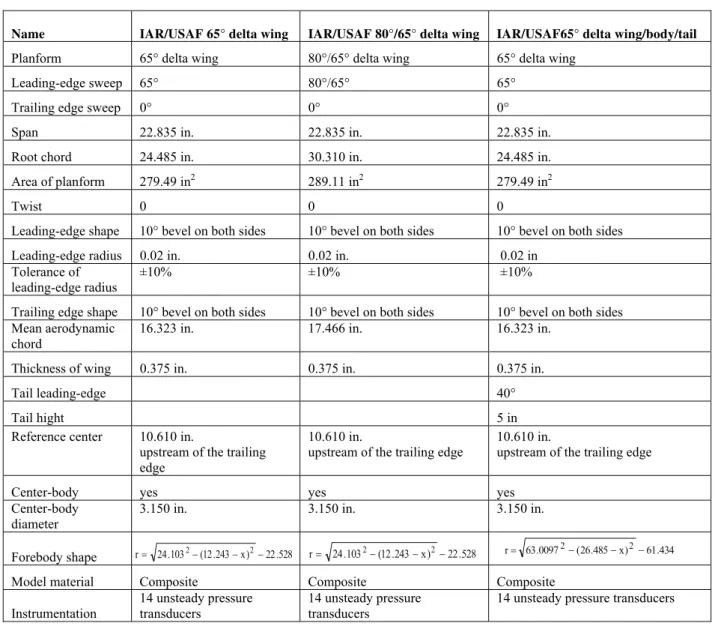
More than 50 types of models were tested including diamond wing, delta wing, double delta wing, wing/body/tail configurations with different leading-edge shapes and centerbody combinations. The tested models can be classified into five major groups:
(1) 55° diamond or delta wing models with different leading-edge shapes and wing-body combinations. (2) 65° delta wing models with different leading-edge shapes and wing-body combinations.
(3) 80°/65° double delta wing model. (4) 65° delta-wing/body/tail models.
(5) Models tested in water tunnel with sweep back angles from 55° to 75°.
The first group models (Fig. 1) were made of aluminium alloy tested in static condition. They have interchangeable leading-edge, aft potion of the wing, centerbody and aft body. Thus the model could be easily changed from diamond to delta wing with different leading-edge shapes and with or without centerbody or aftbody.
The second group (65° wing model) has two different sub-groups (Fig. 2 and Fig. 3). The first sub-group was designed for using in static test condition. The wing consists of upper and bottom halves made of PVC and stainless steel respectively. The upper half (PVC wing half) has 57 pressure taps while the bottom half, which was made of stainless steel, supports the air loads. The leading-edge and centerbody are interchangeable (Fig. 2a). Therefore they have many kinds of combinations (Fig. 2b) such as sharp or rounded leading-edge, with or without centerbody, etc. The second sub-group of 65° delta wing (Fig. 3) took the same geometry as the first sub-group but was designed for using in dynamic test conditions. It can withstand a normal force of 900 kg while having a high stiffness to prevent aeroelastic effects and very low mass and moments of inertia to minimize the inertial loads prevailing under the severe dynamic
COMPREHENSIVE EXPERIMENTAL STUDIES ON VORTEX DYNAMICS OVER MILITARY WING CONFIGURATIONS IN IAR
test conditions.
The third group (double delta wing) was obtained by extending an 85° leading-edge extension (LEX) on a 65° wing model (Fig. 4).
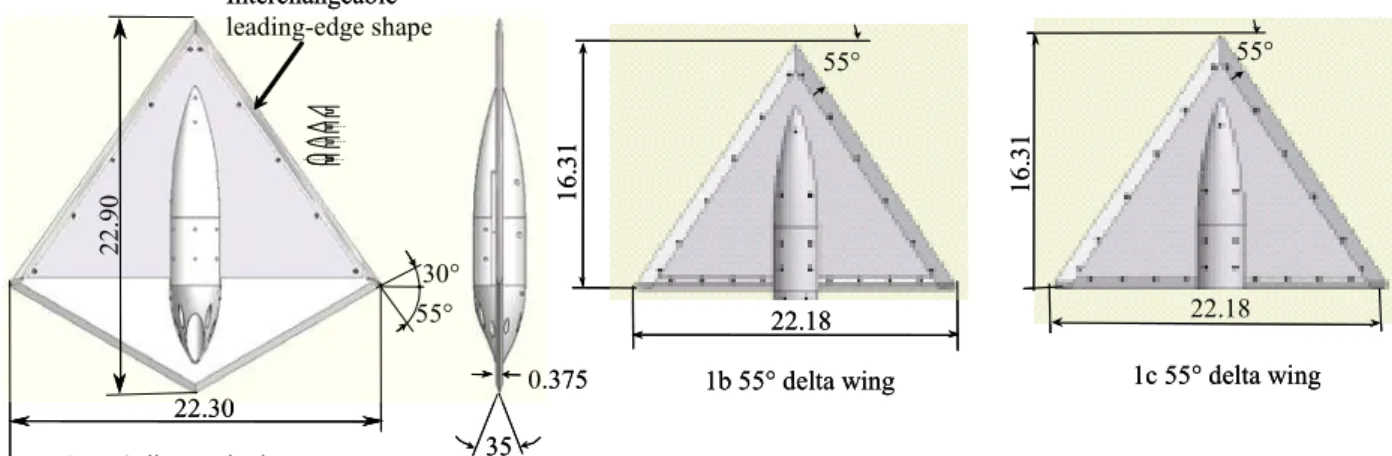
The fourth group has a tail and a tangent ogive forebody with interchangeable cylindrical and elliptical cross-sections mounted on a 65° wing model. The major axis of the elliptical cross-section can be changed from parallel to perpendicular to the wing (Fig. 5a and Fig. 5b). The tail was built with a multi-layer graphite skin and foam core and the centerbody was entirely made of graphite composite. Noses and forebodies were made of aluminium alloys.
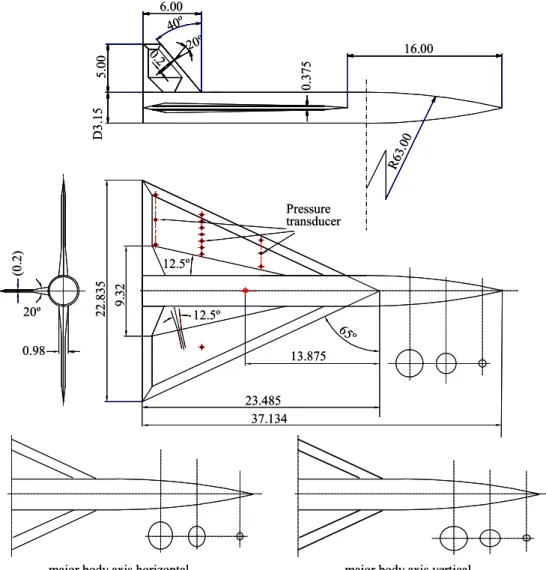
The fifth group tested in water tunnel consists of a 55° model and a 65° model in coning tests (Fig. 6a and 6b) and a series of delta wing model with leading-edge sweep angles ranging from 50° to 75°.
5.2.4 RIGS
Different rigs were used in the tests, namely roll rig, pitch rig and coning rig, which are briefly described below:
5.2.4.1 ROLL RIG
The roll rig is capable of operating in static, forced motion (oscillatory and ramp-and-hold motions), free-to-roll and “forced” free-free-to-roll motion modes. The installation of the roll rig in the LSWT is depicted in Fig. 7a where the angle of attack was adjusted on a horizontal arc. In the case of installation in SARL the angle of attack was adjusted by means of a sector (Fig. 7b). The model was mounted on a one-piece internal five-component strain gauge balance (no axial force). In order to conduct unsteady surface pressure tests, the balance was replaced by a dummy of similar geometry which provided a connector for the pressure transducers leads. The desired model motion was imparted by a hydraulic rotary actuator. The roll angle was sensed by an incremental optical encoder attached to the aft end of the actuator shaft. Free-to-roll tests were performed by modifying the aft end of the rig to include a clutch. By disengaging the clutch, the model was free to roll except for the small friction of the bearings. Under these conditions the roll angle could be monitored by the rotary encoder which was attached to the aft end of the driveshaft.
5.2.4.2 PITCH RIG
A general view of the pitch rig is shown in Fig.8. The model was mounted on a balance that was an integral part of the sting, which was supported by bearings at the end of the support strut. A linear hydraulic actuator caused the model to pitch via a bell crank and linkage that connected it to an extension of the sting aft of the supporting bearings. The pitch axis was 431.8 mm aft of the balance reference center. The pitch angle was obtained from the output of a linear encoder incorporated in the actuator.
5.2.4.3 CONING RIG
The coning rig is a unique orbital platform apparatus. Fig. 9 shows its installation in IAR water tunnel. An annular platform rode on the thinner outer surface of a stationary cylinder. This configuration resulted in minimal aerodynamic interference as the strong interference of support was eliminated by virtue of the absence of the rotating support arm which is inevitable in conventional rotary rigs. A 5-component internal balance supported the model and was connected to the annual platform. The model could be tested in static, quasi-steady coning or ramp-and-hold coning motions. The maximum coning rate was ±0.6. The Re number was in the order of 104 in the water tunnel.
COMPREHENSIVE EXPERIMENTAL STUDIES ON VORTEX DYNAMICS OVER MILITARY WING CONFIGURATIONS IN IAR
5.2.4.4 RIGS IN STATIC TESTS
The rigs employed in static wind tunnel or water tunnel experiments were conventional sting type support with a five- or six-component internal balance.
5.2.5 EXPERIMENTAL TECHNIQUES
5.2.5.1 FLOW VISUALIZATION
Emphasis in flow visualisation was placed on the observation of the three-dimensional separated flow and, particularly, the vortical flow present on the leeward side of the model. Furthermore, surface oil flow visualisation was performed under static conditions which was extensively used to determine skin friction topology and its evolution as the attitudes (angle of attack, roll and sideslip angle, etc.) were changing. In the roll experiments with laser-smoke sheet techniques, the flow was seeded with kerosene or Rosco fluid by a single vapor dispensing probe located approximately 1.5m and 2.3m upstream of the model apex at LSWT and SARL respectively. Under these conditions the plume diameter was approximately 6 - 8 cm at the impingement location, which was selected to maximise the visibility of the leading-edge vortices. A light sheet produced with a 15 W argon-ion laser oriented normal to the model axis was traversed to observe the flow at different model stations. Images were recorded with two cameras: a high speed video camera capable of recording at 1000 frames/sec and a Super VHS studio quality camera to produce better definition.
In the pitch experiments natural condensation was used to seed the flow in view of the large vertical displacement of the model apex. Likewise, the laser sheet orientation was selected to longitudinally intersect one leading-edge vortex core while being approximately normal to the wing surface.
Surface flow visualization was accomplished by means of mineral and/or silicone oils mixed with titanium dioxide. The viscosity of the mixture was tailored to optimize the observation of the desired features. Photographs were taken to capture the surface flow patterns during and after the wind tunnel runs. Videos were taken during the run to resolve some ambiguities regarding the direction of the flow.
The coning test and part of the geometry effect on vortex breakdown were conducted in water tunnel. Dye was injected from orifices with diameter of 0.39 mm located on both wing halves at 6.2% centerline chord. Flow visualization images were taken by two CCD cameras that provide a side and a rear view of the flow field.
5.2.5.2 UNSTEADY MEASUREMENTS
The dynamic data consist of forces, moments and surface pressures coherent with the model motion. The signals of forces and moments are typically more or less contaminated by noise due to unsteadiness of dynamic test, which must be minimised in order to obtain representative results. This was done by taking ensemble averages of the signals over a number of motion periods which in turn required data sampling synchronous with the model motion. Hydraulic servo-valves of different capacities were used to generate the desired and more accurate motions over the large range of amplitudes and angular rates used. Tare measurements were done in air due to the impossibility of evacuating the wind tunnel.
Unsteady surface pressures were measured by means of 14 unsteady pressure transducers mounted on the leeward surface of the 65° delta wing at 0.75 root chord as shown in Fig. 3.
5.2.5.3 PSP AND PIV TECHNIQUES
COMPREHENSIVE EXPERIMENTAL STUDIES ON VORTEX DYNAMICS OVER MILITARY WING CONFIGURATIONS IN IAR
The working principle of Pressure Sensitive Paint (PSP) is based on the photoluminescence of some molecules, which are dissolved in a polymer, being quenched by oxygen. The air pressure at the polymer surface determines the amount of oxygen in the film. As a result, the intensity emitted by the paint depends on the pressure at the paint surface. The advantage of PSP is that it provides the pressure data at any point where the surface is optically accessible. It is particularly useful for CFD validation where the results need to be assessed everywhere on the model. The usual graphical presentation of CFD results can thus be easily and globally compared to PSP measurements. However, at low speed flow conditions, special care in data acquisition and reduction has to be considered since the relative changes of intensity could be below the noise level of the intensity measurements or smaller than the effect of a temperature gradient on the model.
In Particle Image Velocimetry (PIV) measurements, a double frame/double exposure and cross-correlation method was used to record the traces and their local displacement. Different sizes of interrogation window and time period between the laser pulses were used to yield the best correlation results. Both global and local seeding methods were applied. For local seeding method, the local seeds were made of kerosene or Rosco fluid by means of a single vapor dispensing probe located approximately 1.5m upstream of the model apex in LSWT. While for global seeding method, an MDG water-base fog fluid was released downstream test section from a fog machine while the fan idled to help circulate the fog. When the tunnel was judged to have sufficient seeding particles, the wind speed was increased to achieve the desired wind speed.
5.2.5.4 FREE-TO-ROLL AND “FORCED” FREE-TO-ROLL OPERATION
In free-to-roll operation mode the model motion history was recorded with the sampling process being started by the clutch release command, thereby ensuring that the recorded signal covered the required time interval.
Given the impossibility of directly obtaining unsteady surface pressure data during free-to-roll motions, these pressure data were obtained in the forced motion mode by duplicating the model motion equal to that obtained under free-to-roll conditions. Unsteady pressure transducers mounted on the upper surface of the port wing half were used to obtain the instantaneous value of the pressures. The corresponding pressures on the starboard wing were inferred by conducting experiments with the same motion histories with roll angles of opposite sign.
5.3 SAMPLES OF EXPERIMENTAL RESULTS
The extensive database has been collected and edited into eight volumes and the data set will be accessible to authorised organisations through the web in the future. Here only few of some of the sample results are briefly described.
5.3.1 SURFACE FLOW VISUALIZATION
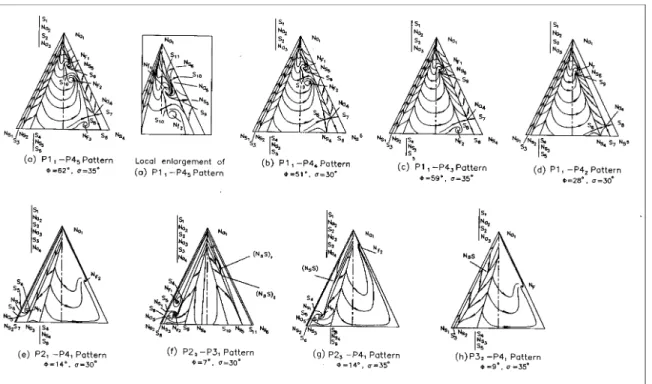
Varieties of mean surface flow topologies and evolutions have been observed as the governing parameter changes. As an example the evolution of the flow topology on 65° delta wing as a function of roll angle is shown from Fig. 10a to Fig. 10d. At very high model roll angles, the topology exhibits a concentrated leading edge vortex on the leeward wing half, characterised by the presence of one, two or three separation lines corresponding to the primary, secondary and tertiary vortices (Fig. 10a). At lower roll angles at least one whorl corresponding to a focus where the secondary or tertiary vortex lifts off the surface (Fig. 10b). Further reductions in roll angle results in the primary vortex breakdown moving on to the model creating the characteristic kink in the secondary separation line at the breakdown location (Fig. 10c). When the wing half under consideration is sufficiently to windward, and the primary vortex breakdown is near or at the apex, a variety of spiral or reverse patterns may develop (Fig. 10d). At extreme roll angles a
COMPREHENSIVE EXPERIMENTAL STUDIES ON VORTEX DYNAMICS OVER MILITARY WING CONFIGURATIONS IN IAR
separation bubble develops destroying any discernible pattern. The evolution of correlating topology is shown in Fig. 11.
5.3.2 OFF SURFACE (LASER SMOKE SHEET AND PIV) FLOW VISUALIZATION
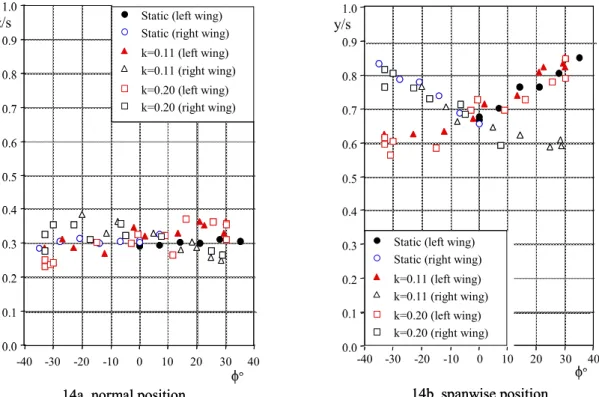
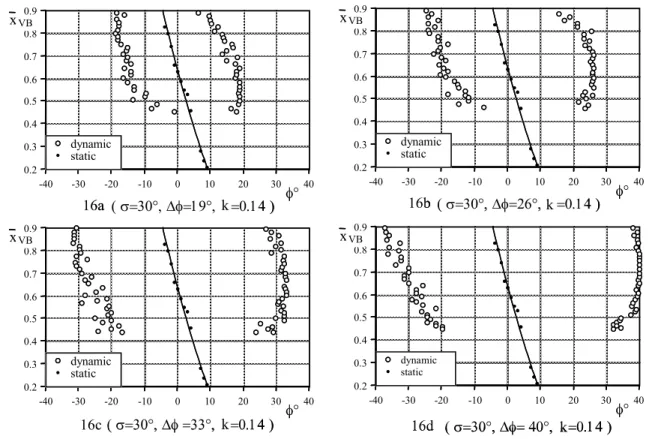
A bulk of the off-surface flow visualisation was performed to investigate vortex characteristics, including core diameter and location, its image brightness profile, vortex breakdown movement and unsteady behavior.For 65° delta wing model, Fig. 12 shows the grey level profiles instantaneously taken from individual images through vortex core under oscillatory conditions at different model stations. For a given attitude the non-dimensional core diameter (diameter/local semi-span) in the intact part of the vortex has been found to be relatively constant, and the smaller this diameter the further aft breakdown occurs. Under rolling oscillations, the core diameter shrinks when the corresponding wing half moves to leeward (Fig. 13). Fig. 14 depicts the position of the vortex core as a function of roll angle, showing that the normal position of the core is essentially independent of roll angle and frequency suggesting that its response time is in the order of a convection time for 65° delta wing configuration. To compare with, the response of breakdown location is at least an order of magnitude longer. As examples Fig. 15 and Fig. 16 show the effect of oscillation frequency or amplitude on breakdown location respectively.
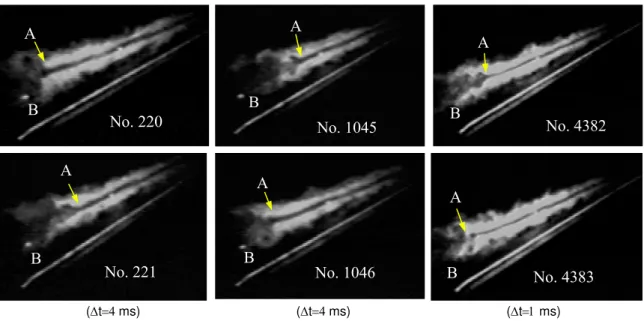
The unsteady behavior of the breakdown region, defined as the region between the first kink in the vortex filament (Point A) and breakdown to large scale turbulence (Point B) is also quite remarkable with different appearances (Fig. 17). Fig. 18 shows a sequence of frames separated by 4 ms or 1 ms. Point A is seen to move in excess of 20% centerline chord, whereas Point B remains virtually stationary. The speed
of response of point A is found to be approximately 0.5U∞ cosα on the basis of the consecutive pairs of
images as seen in Fig. 18.
Under dynamic test conditions a deterministic motion of points A and B are superimposed to the above unsteady behavior. Significant time lags are present in the instantaneous positions of points A and B with respect to their corresponding average static locations. This lag is a function of the motion history leading up to the instant in question. Furthermore, the distance between points A and B increases and decreases relative to the steady value during pitch-up and pitch down motions respectively (Fig. 19).
The motion induced camber effect on vortex breakdown has been investigated. As an example Fig. 20a shows rolling motion induced quasi-steady camber effect on vortex breakdown by a deformed wing surface (Fig. 20b) which satisfies the simulation of quasi-steady condition at rolling motion. The motion induced camber effect delays vortex breakdown on rolling-down side while promote vortex breakdown on rolling–up side. Investigations on other motion plans were also conducted and can be found in Ref. 3.
The PIV measurements clearly show the field of velocity vector and vorticity vector over upper surface. As an example, Fig. 21 shows a preliminary result over a 65° delta wing. More post-processed figures can be found in the fellow-up reports (Ref. 3).
5.3.3 OFF SURFACE (DYE INJECTION) FLOW VISUALIZATION
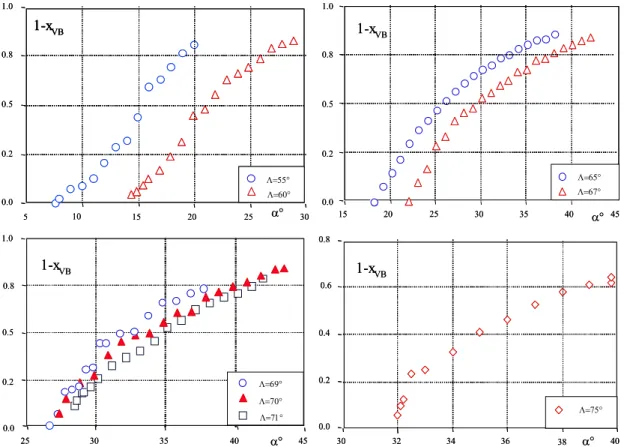
Off surface flow visualisation in water tunnel was conducted by dye injection. To investigate the effects of leading-edge sweep back angle, leading-edge shape, centerbody and coning rate on the vortex behavior were the major tasks in the water tunnel experiments.
Fig. 22 shows the observed time-averaged vortex breakdown locations over various delta wings vs. angle of attack covering a sweep angle range of 55°~75°. These figures clearly show that the relationship between the time-averaged breakdown locations and angle of attack is smooth with increasing slope
COMPREHENSIVE EXPERIMENTAL STUDIES ON VORTEX DYNAMICS OVER MILITARY WING CONFIGURATIONS IN IAR
toward the trailing edge. The increment of angles of attack for 75° delta wing is much smaller when vortex breaks down in the aft reflecting its faster movement at lower angles of attack. Nevertheless, the relationship between the vortex breakdown location and the angle of attack exhibits a continuous and parabolic behavior, which is, in principle, similar to those wings with smaller sweepback angles.
The effects of leading-edge shape, trailing edge shape and centerbody on vortex breakdown were also
investigated and can be found in Ref. 3. The results about different leading-edge bevels suggest that the
effectiveness of the leading-edge bevel is related to the ratio of its width to the thickness of the pre-separation boundary layer, which stands to reason that the bevel modifies the pressure gradient in the vicinity of the leading edge, thus influencing the vorticity generation. No significant effect of centerbody on vortex breakdown appears during the experiments.
The effect of motion induced quasi-steady camber effect on vortex breakdown during coning motion is
shown in Fig. 23. Generally speaking, coning motion promotes the breakdown on advancing side of the
wing while delays the breakdown on the receding side. Other than vortex breakdown location, the trajectory of vortex core is also affected as seen in Fig. 23.
5.3.4 FORCE AND MOMENT MEASUREMENTS
Static force and moment tests revealed the extremely non-linear nature of the aerodynamic airloads at high incidence. As an example, Fig. 24 shows the static rolling moment coefficient as a function of roll angle for different sting angles. At σ=15° there is only one roll stable point at φ=0°, whereas at σ=30° there are three trim points. Interestingly the attractor basin for the trim point at 0° is very small. For σ=35°, the
point at φ=0° becomes unstable. Similar phenomena can be observed in coining motion as shown in Fig.
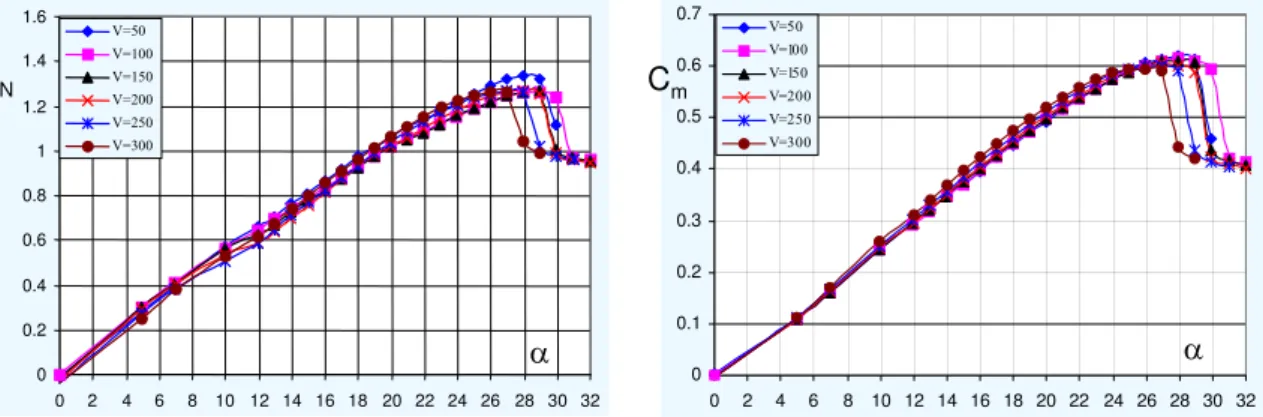
25. The rolling moment coefficient is mostly affected by the coning rate. When the angle of attack exceeds certain value, the rolling moment becomes nonlinear with unstable point at φ=0°. The results in pitch cases also exhibit similar behavior. As an example, Fig. 26 shows the normal force and pitching moment on a 55° diamond. The angles when the vortex breakdown is across the trailing edge or at the apex are also marked in these figures. It is clear that there are severe discontinuities appear at these two angles. It is found that the free stream speed and the leading-edge shape have noticeable effect on the angle where the discontinuity appears, especially for 55 wing as shown in Fig. 26.
Dynamic tests also revealed severe nonlinearities in airloads but they are quite different from static ones. As examples, Fig. 27 shows the rolling moment and normal force at different rolling frequencies and roll angle offset respectively. It should be noted that the unsteady effects are not only observed at moderate to high reduced angular rate (Φ&) but even at extremely low ones as shown in Fig. 28 where transient ramp-and-hold motion results between φ = ±16° are depicted together with static ones for σ = 30°. The dynamic loads agree closely with the static ones for 16° >|φ|> 12°. Elsewhere the dynamic loads overshoot the static values by increasing amounts depending on the reduced angular rate. As can be observed, even for non-dimensional rolling frequency Φ& < 0.001 a very distinct overshoot is present, which persists for most of the motion. However, the dynamic loads retain the "wiggle" present in the static case. These nonlinearities and differences from static ones are also observed in pitching cases as one example depicted in Fig. 29 during transient pitching maneuvers between α = 0° and 60°.
The importance of vortex breakdown on the loads can also be observed in rolling cases as shown in Fig. 30. The rolling moment coefficient observed at different reduced frequencies is compared with a hypothetical steady value that assumes no breakdown on the leeward wing and breakdown at the apex on the windward one. The solid symbols indicate points on the oscillation cycle where the aforementioned hypothetical condition is met, whereas the clear symbols indicate that breakdown occurs over at least one of the two wing halves. It is immediately apparent that significant discrepancies between the two curves are present only in the latter case. From the above it follows that for the cases under consideration, the
COMPREHENSIVE EXPERIMENTAL STUDIES ON VORTEX DYNAMICS OVER MILITARY WING CONFIGURATIONS IN IAR
steady value of the rolling moment is approximately applicable even under dynamic conditions provided that no breakdown is present on the wings.
5.3.5 SURFACE PRESSURE MEASUREMENTS
Surface pressure measurements include results from pressure taps, PSP measurements and unsteady pressure transducers obtained in either pitch or roll plan.
Pressure taps were applied to measure the surface pressure on models with different combinations (leading-edge shape, centerbody or faring, etc.). As examples measurements between with and without centerbody are shown in Fig. 31 for different angles of attack. It is noticed that only at higher angle of attack the centerbody causes more suction on the vicinity of nose area. There is no global effect is observed when the centerbody exists.
PSP provided profound pressure informations on 55° diamond wing, 55° delta wing and 65° delta wing with different leading-edge and centerbody conditions. The information provided by PSP is particularly useful for CFD validation where the results need to be assessed everywhere on the model. It is also very useful for investigating the geometry effect. As examples the surface pressure on different combinations of 65° delta wing, 55° diamond wing and 55° delta wing with different combinations (rounded or sharp leading-edge, with or without centerbody) are shown in Fig. 32 and Fig. 33. Compare with 65° delta wing the vortex core over 55° diamond or delta wing locates more close to the leading-edge. The results between 55° diamond wing and 55° delta wing exhibit that the location of vortex breakdown over diamond wing is aft of corresponding delta wing. The leading-edge shape has larger effect than that of 65° delta wing. For the sharp leading edge the leading edge vortex starts right at the apex. As examples Fig. 34 show the comparisons of section results from PSP plots between sharp edge and round leading-edge as shown in Fig. 34. For the sharp leading-leading-edge, the leading-leading-edge vortex starts right at the apex (see left two graphics). While for the round leading-edge, the leading-edge vortex forms at almost 8% downstream of the apex. Moreover, the primary vortex orthemain suction over the wing with round leading-edge is more outboard compared with the wing with sharp leading edge. Furthermore, the secondary vortex is much weaker over the wing with round leading edge than that with sharp leading edge.
The unsteady surface pressures measured at static and dynamic model conditions provide important information about the spectra of the pressure, which indicates the footprint of the vortex and its breakdown. These data further confirm the fluctuations observed in the flow visualizations. As examples the results obtained on the 65° delta wing in pitch plan (either in static or dynamic) are presented from Fig. 35 to Fig. 44. More information about unsteady pressure measured of the two models in pitch, roll and free-to-roll conditions are included in Ref. 2.
The pressure measurements on the 65° delta wing under static model conditions at several typical angles of attack are shown in Fig. 35a to Fig. 35f for different angles of attack, e.g. 1) α=1°; 2) α= 16°; 3) α=25° and 29°; 4) α=47° and 5) α=51°, corresponding to different flow states: 1) no separation, 2) weakly vortex forming, 3) strong vortex and breakdown across the transducer, 4) strong reverse flow and 5) wake flow.
At α=1° the signals from the pressure transducers shown in Fig. 35a can be taken as the back ground noise from the wind tunnel since there is no flow separation. When angle of attack increases to the second period (α=16°), there are clear peaks that appear at high frequencies and at the pressure transducers P3 to P5 as seen in Fig. 35b, indicating the existence of spiral vortex. Further increasing the angle of attack, results in the vortex breakdown location moving close to the transducers, and a fluctuation in the lower frequency band becomes obvious as illustrated in Fig. 35c to 35d for α=25° and 29° respectively. These figures confirm the existence of a serious axial fluctuation in the vortex breakdown location as observed in
COMPREHENSIVE EXPERIMENTAL STUDIES ON VORTEX DYNAMICS OVER MILITARY WING CONFIGURATIONS IN IAR
flow visualization experiments. When vortex breakdown is near the apex, the spiral and reverse flow remain alive until the flow becomes separated wake flow at even higher angles of attack. The corresponding pressure footprint can be found in Fig. 35e and 35f for α=47° and 51° respectively. At α=47° there are some remarkable pressure fluctuations at f=18Hz, corresponding to St=0.84. While at α=51° this peak moves to a lower frequency, indicating a large-scale low frequency wake-like flow pattern.
Under dynamic conditions much more profound information about the unsteady pressure has been found. As examples, Fig. 36 to Fig. 41 show the unsteady pressure measurements, either in the time domain or in the frequency domain, at pitch-up or pitch-down conditions (α: 50°↔70°, 10°↔70°, 20°↔40° and 30°↔40°).
Fig. 36 and Fig. 37 show the unsteady pressures during pitch-up (α: 50°→70°) or pitch-down (α: 70°→50°) respectively. The time period is 0.675sec. These pressure measurements are the simplest among the other test cases as there is no vortex breakdown and spiral flow involved. The pressures in the time domain show that there is neither a noticeable phase shift between the motion and the measured pressure nor phase shift between pressures obtained in different pressure transducers. The spectra show that there very little power other than that at the primary motion frequency.
Comparing the pressure footprints for the cases when there is a simple vortex, vortex breakdown, or spiral flow appears, is much more complex. Fig. 38 and Fig. 39 show the unsteady pressures at pitch-up (α: 10°→70°) or pitch-down (α: 70°→10°) respectively at ∆t=0.675 sec. The results in time domain show that the pressure response functions at each pressure transducer are quite different. Also there are quite significant phase shifts between the different pressure transducers, indicating there exists a spanwise wave in pressure. The spectra shown in Fig. 39b exhibit that, in addition to the primary motion, the axial and spanwise fluctuation of the vortex and its breakdown location may result in a noticeable power density at higher frequencies.
The above complex spectral and spanwise phase shift become even vigorous when the vortex and its breakdown occupy the major period of the motion. As examples Fig. 40 and Fig. 41 show the unsteady pressure spectra and time histories measured at each pressure transducer for pitch-up (α: 20°→40°) or pitch-down (α: 40°→20°) respectively at ∆t=0.675 sec. In the time domain there are almost opposite pressure response functions between pressures at transducers P1 to P3 and P4 to P6, while the pressure response function in P7 takes another shape. These figures clearly demonstrate that the vortex and its breakdown will result in a much stronger spanwise wave compare with the case that no vortex or vortex breakdown is involved.
In addition to spectral information, the moving average of the results in time dominie during dynamic model condition, either in roll or in pitch motion, shows the dynamic correlation between the pressure and the motion. As an example, Fig. 41 shows plots and contours of the pressure coefficient as a function of roll angle for non-dimensional rolling frequency k=0 and 0.14 respectively. The spanwise stations of those pressure transducers are indicated in Fig. 3. The first plot in Fig. 42 depicts static data plotted according to a fictitious sinusoidal roll motion. The maximum suction, corresponding to the condition when the leading edge vortex is strongest over the instrumented model station, occurs at φ ≈5° where Cp= -1.8. The second plot shows the case that the model was oscillated with an amplitude of 40° at k=0.14. Here the maximum suction has increased considerably (Cp= -2.5) and has shifted to φ ≈ 30° where the wing is on the windward side during the downstroke. The features in the two plots are quite different, demonstrating the dramatic impact of dynamic effects. In pitch case, the surface pressures at the seven transducers on the port wing half with the corresponding motion in Fig. 19 are shown in Fig. 43. The static ones are superimposed. These characteristics consistent with that of vortex breakdown movement and normal force (Fig. 19 and Fig. 30) and provide good correlation between vortex breakdown, normal
COMPREHENSIVE EXPERIMENTAL STUDIES ON VORTEX DYNAMICS OVER MILITARY WING CONFIGURATIONS IN IAR
force and surface pressure in dynamic situation. The unsteady pressure during free-to-roll motion was measured by a duplicated free-to-roll operation mode or “forced” free-to roll mode. As an example, Fig 44 shows the changes of surface pressure during free-to-roll motion when the model was released from φ =64°. The corresponding free-to-roll motion history is described in the following section.
5.3.6 FREE-TO-ROLL EXPERIMENTS
In free-to-roll experiments, the 65° and 65°/80° models were release from different roll angles at different angles of attack. One of the early findings of the program was the presence of multiple roll trim points (attractors), a phenomenon not previously observed. Fig. 45 depicts four free-to-roll motion histories in the phase plane. It is interesting that the 65° delta wing at σ=30° consistently trims at φ=0 for 2°>φi>60°. For other values of the initial roll angle, the model trims at ±21° depending on the sign of the initial angle. The presence of intersections between the trajectories clearly indicates that the rolling moment does not only depend on the instantaneous roll angle and angular rate but is dramatically affected by the motion history.
5.3.7 FOREBODY/WING/TAIL RESULTS
As expected, the addition of a forebody has an important impact on the flow, specifically, the presence of forebody vortices and their interaction with the leading-edge ones result in very substantial changes of the airloads at moderate to high angles of attack. As no attempt was made to fix transition on the forebody, an erratic behavior of the static loads was observed which is contrary to the case of the delta wing that separation is well defined at the sharp leading edge. Fig. 46 depicts the loads observed at several runs for σ = 30°. Most of the scatter occurs at small roll angles although it is present everywhere to a lesser extent. The loads are not symmetrical (or anti-symmetrical) about the origin due to the asymmetric forebody vortex shedding, which as suggested by the load discontinuities switch position at φ ~ -8°. Tests could not be performed near the above roll angle as potentially damaging, rapidly diverging lateral oscillations of the sting were induced. The large oscillation amplitude suggests that a positive feedback results from the coupling between the forebody vortex switching and model motion.
5.4 CONCLUSIONS
The data sets cover wide areas. It is one of the most completed and comprehensive data set about vortex dynamics over military wing configurations.
There are numerous findings in these data sets, which are important and valuable.
It is not only valuable for validation and verification of current CFD solutions but especially valuable for validation and verification of future CFD solutions as so many unsteady and detail information provided. As the data sets have been edited in a consistent and user-friendly format, it will be very convenient for the users in their applications.
5.5 REFERENCES
[1]
Hanff, E.S., and Jenkins, S.,"Large-Amplitude High-Rate Rolling Experiments on a Delta and Double DeltaWing," AIAA Paper 90-0224, Jan. 1990.
[2]
Hanff, E.S., Jenkins, J.E., Huang, X.Z., Myatt, J.H. and Addington, G.A., “Hightlights of the NRC/USAF/DNDJoint Program on Manoeuvering Aerodynamics”, Canadian Aeronautics and Space Journal, September 2001, Volume 47, No. 3.
[3]
Huang, X., “IAR program on maneuvering aerodynamics over military wing configurations”, To be published in2005.
COMPREHENSIVE EXPERIMENTAL STUDIES ON VORTEX DYNAMICS OVER MILITARY WING CONFIGURATIONS IN IAR
APPENDIX
–
BRIEFING OF IAR PROGRAM
GENERAL DESCRIPTION OF THE MODELSDesignation IAR Military Wing Program
Wind tunnel/water tunnel entries See Table 1
Type Full model
Reference Ref. 1, 2, 3
MODEL GEOMETRY (more than 50 types of models tested see Fig. 1 in [1])
IAR and IAR/AFRL 65° delta wings (wind tunnel models) see table 2 for detail
IAR 55° diamond wings and 55° delta wings (wind tunnel models) see table 2 for detail
IAR/AFRL80/65 double delta wings (wind tunnel models) see table 2 for detail
IAR/AFRL 65° wing/body/tail configurations (wind tunnel models) see table 2 for detail
IAR 55°and 65° delta wings (water tunnel models in coning tests) see table 2 for detail
IAR 50°~75° delta wings (water tunnel models) see table 2 for detail
WIND TUNNELS/WATER TUNNEL LSWT wind tunnel (IAR)
Type of tunnel Close-circuit atmospheric type
Test section dimensions Height: 6 ft, width: 9ft, length: 15 ft
Maximum speed 390 ft/sec
Contraction ratio 9
Turbulence in empty tunnel ≤ 0.12% at free stream speed of 100 ft/sec
Type of side walls Solid with large optical quality plexiglass windows
Type of roof Solid with large optical quality plexiglass windows
Support Sting attached to wind tunnel strut (Fig. 2)
Tunnel resonance No evidence of resonance in present test
Reference Ref. 2
SARL wind tunnel (AFRL)
Type of tunnel Open-circuit atmospheric type
Test section dimensions Height 10 ft, width 7ft, length: 15 ft
Maximum speed 660 ft/sec
Contraction ratio 36
Turbulence in empty tunnel ≤ 0.1%
Type of side walls Solid with large optical quality plexiglass windows
Type of roof Solid with large optical quality plexiglass windows
Support Sting installed on quadrant (Fig. 2)
Tunnel resonance No evidence of resonance in present test
Reference Ref. 3
IAR water tunnel (Eidetics)
Type of tunnel Close-circuit with open-test section and vertical return
Test section dimensions Height 20 in., width 15in and length 6 ft
Maximum speed 1 ft/sec
Contraction ratio 6:1
Turbulence intensity level ≤ 1%
Velocity uniformity ≤±2%
Mean flow angularity ≤±1° in both pitch and yaw angle
Type of side walls Large optical quality plexiglass windows
Support OPLEC or sting installed on quadrant (Fig. 2)
Reference Ref. 4
MODEL MOTION
Motion plan Pitch, roll and coning plans
General description of the motions Rolling about body axis
COMPREHENSIVE EXPERIMENTAL STUDIES ON VORTEX DYNAMICS OVER MILITARY WING CONFIGURATIONS IN IAR
Pitching about an axis downstream of the reference centre Coning about balance reference centre
Motion waveforms Static
Sinusoid oscillation in roll and in pitch Ramp-and-hold:
Constant velocity
Constant acceleration at both ends
Only constant acceleration at both ends (double parabola) Quasi-steady in coning
Free-to-roll Motion parameters
Maximum oscillation amplitude ∆σ=90° in pitch, ∆φ=40° in roll and ∆Ω=360° in coning
Maximum mean angle φ0 =± 50° in roll, σ0=0°~90° in pitch and Ω0=360° in coning
Maximum non-dimensional frequency ϖ=0.2 in pitching and rolling oscillation and Ω&&& =0.6 in coning
Maximum of angular rate in pitch and roll 4500 °/sec
Maximum of angular acceleration 500,000 °/sec2
Maximum initial roll angle in free-to-roll 90°
Tare friction in free-to-roll Approximately constant (independent of rate)
Mechanical Inertial in free-to roll 0.15 lbs-in-sec2
Method of applying motion Inexorable hydraulic system in pitching and rolling motions
OPLEC system in coning motion
Motion precision 0.175° in roll and pitch, 0.1° in coning
Sting angle precision 0.1°
TEST CONDITIONS
Maximum model planform area/tunnel area 0.0296 (SARL)
0.0357 (LSWT) 0.1286 (water tunnel)
Maximum model span/tunnel width 0.272 (SARL) and 0.4 (water tunnel)
Maximum model span/tunnel height 0.300 (LSWT)
Maximum model root-chord/ tunnel-height 0.204 (SARL)
Maximum model root- chord/ tunnel-width 0.227 (LSWT)
Maximum blockage at α=30° 0.0148 (SARL)
0.0179 (LSWT)
0.074 (water tunnel)
Position of model in tunnel Standard side position (LSWT)
Standard upright position (SARL)
Standard downright position in static test (Water tunnel)
Range of wind tunnel total pressure Atmospheric (SARL)
Atmospheric static pressure (LSWT)
Definition of model sting angle Angle between body axis and tunnel axis
MEASUREMENTS
Surface skin friction and topology Oil flow
Off-surface flow visualization and topology Laser-smoke sheet
Vortex core location and diameter
Vortex breakdown locations
Off-surface flow field PIV measurements
Steady pressure in static conditions pressure taps
Steady pressure in static conditions PSP measurements
Steady pressures in static conditions pressure transducers
Unsteady pressures in static conditions pressure transducers
Unsteady pressures in dynamic conditions pressure transducers
Steady forces in static conditions Measured directly
Integrated pressure
Unsteady forces in dynamic conditions Measured directly
COMPREHENSIVE EXPERIMENTAL STUDIES ON VORTEX DYNAMICS OVER MILITARY WING CONFIGURATIONS IN IAR
Measurement of actual motion of model
Measurement of free-to-roll motion history
Wind tunnel interference assessment
Support interference assessment
INSTRUMENTATION Pressure transducers
Type of transducers Kulite pressure transducers (LQ-47-25A) with “B” screen
Operation mode Absolute
Sensitivity range: 3.21~4.46 mv/psi.
Zero pressure output: <±5% full scale
Position of transducers See Fig. 1
Installation of transducers Using RTV adhesive flush (00.000.005
− ) to upper surface. Fill trough
with clear epoxy filler fair to upper surface.
Principle and accuracy of calibration Kulite: static calibration at beginning of tunnel entry, offset
measurement every 30 minutes.
Position of orifices See Fig. 1
Pressure sensitive paint (PSP)
Calibration method Both in situ calibration and a priori calibration methods were
used for 65° delta wing while only a priori calibration
method with a constant temperature assumption was used for 55° diamond and delta wing.
Position of thermocouples only on 65° delta wing, See Fig. 1
Position of pressure taps See Fig. 1.
Pressure taps
Number of pressure taps and thermocouple 57 taps on 65° delta wing, 3 taps on canter body of 55°
diamond and delta wings, 2 thermocouples on 65° delta wing
Position of taps and thermocouple See Fig. 1
Diameter of pressure taps and thermocouple 0.032 in.
Steady loads (Internal balance 1) Used in SARL and LSWT wind tunnel
Type of transducers Strain gauge
Type of measuring system Five components balance with maximum range:
Normal force N=2,000 lbs
Side force Y=1,000 lbs
Rolling moment l=3,000 lbs-in
Method and accuracy of calibration Maximum and relative deviations:
Normal force ∆Nmax =±2 lbs, δNmax=0.1%
Pitch moment ∆µmax=±5 lbs-in (∆xmax= 0.005 in)
Side force ∆Ymax =±2 lbs, δYmax=0.1%
Yawing moment ∆νmax=±5 lbs-in (∆ymax= 0.005 in)
Rolling moment ∆lmax=±6 lbs-in δClmax=0.2%
Steady loads (Internal balance 2) Able Corporation 1” MKXXII B six-component balance
Type of transducers Strain gauge
Type of measuring system Six components balance with maximum range:
Normal force N=950 lbs
Side force Y=600 lbs
Axial force X=120 lbs
Rolling moment l=350 lbs-in Pitching moment m=1,900 lbs-in Yawing moment n=990 lbs-in
Accuracy0.25% of maximum load in any series of loading of a single
element or 0.5% compared with the best straight line fit.
COMPREHENSIVE EXPERIMENTAL STUDIES ON VORTEX DYNAMICS OVER MILITARY WING CONFIGURATIONS IN IAR
Interactions Seventy percent of the possible first order interactions are ≤ 0.5%. An additional 20% of the first order interactions are ≤1%. The remaining 10% of the first order interactions are ≤3%. All interactions in excess of 1% are linear within ±10% of the interaction output.
Steady loads (Internal balance 3) Used in IAR 1520 water tunnel
Type of transducers Strain gauge with diameter 7/16 in and length of 2.7 in.
Type of measuring system Five components balance with maximum range:
Normal force: N=14 lbs
Side force Y=1.75 lbs
Pitching moment m=7 lbs-in. Yawing moment n=1.75 lbs-in. Rolling moment l=3 lbs-in.
Calibration loading Normal force 0.44 lbs
Side force 0.22 lbs
Torque 0.3 lbs-in.
Resolution 1% of maximum calibration load
Sensitivities N=3.07 mv/lbs S=24.53 mv/lbs m=6.16 mv/lbs-in. n=24.4 mv/lbs-in l=11.5mv/lbs-in Unsteady loads
Type of transducers Internal balance 1
Measurement method Ensemble average of coherent samples over several cycles
Method and accuracy of calibration Model motion
Method of measurement Angular encoder on drive shaft aft end
Accuracy ±0.1°
Sting acceleration (horiz. and vert.) Accelerometer EGA-125*-10D
Non-linearity: ±1%
Range: ±10 g
Limit: ±50 g
Them.Z ±1%FS/100°F
TSS ±2.5% /100°F
Processing of unsteady loads
Pressure signal conditioning system See Fig. 11 (up to 1991) and Fig. 12
Loads signal conditioning system See Fig. 11 (up to 1991) and Fig. 12
Processing data Ensemble average over more than 30 (harmonic motion), or 9
cycles (ramp-and-hold motion) PIV measurement
Seeding Local seeding and global seeding method
Data acquisition Cross-correlation method
COMPREHENSIVE EXPERIMENTAL STUDIES ON VORTEX DYNAMICS OVER MILITARY WING CONFIGURATIONS IN IAR
Table 1 Wind tunnel and water tunnel entries
Year Tunnel Configuration Motion Measurements
1989 IAR 6x9 LSWT IAR/AFRL 65˚ delta wing Roll Surface flow
IAR/UFRL 85˚/65˚ Free-to-roll Laser sheet smoke
double delta wing Motion history
Unsteady loads
Unsteady pressure
1990 IAR 6x9 LSWT IAR/AFRL 65˚ delta wing Roll Surface flow
Free-to-roll Laser sheet smoke
Motion history
Unsteady loads
Unsteady pressure
1991 USAF/AFRL/SARL IAR/AFRL 65˚ delta wing Roll Surface flow
7x10 wind tunnel Free-to-roll Laser sheet smoke
Motion history
Unsteady loads
Unsteady pressure
1993 USAF/AFRL/SARL IAR/AFRL 65˚ delta wing Static in roll Surface flow
summer 7x10 wind tunnel and pitch Laser sheet smoke
Static loads
1993 USAF/AFRL/SARL IAR/AFRL 65˚ delta wing Pitch Surface flow
Fall 7x10 wind tunnel IAR/AFRL 65˚ delta Laser sheet smoke
wing/Forebody/Tail Motion history
Unsteady loads
Unsteady pressure
1994 USAF/AFRL/SARL IAR/AFRL 65˚ delta wing Roll Surface flow
7x10 wind tunnel IAR/AFRL 65˚ delta Laser sheet smoke
wing/Forebody/Tail Motion history
Unsteady loads
Unsteady pressure
1995 IAR 6x9 LSWT
IAR 65˚ deformed delta
wing
Roll induced
camber Laser sheet smoke
1996~1997 IAR 15x20 Water IAR 50˚~79˚ delta wings Static in roll Off-surface flow vis.
tunnel and pitch Geometry effect
Reynolds number's effect
1998~1999 IAR 15x20 Water IAR 65˚, 70˚ delta wings Static in pitch Off-surface flow vis.
tunnel Active vortex control
2000 IAR 15x20 Water IAR 55˚, 65˚ delta wings Coning Off-surface flow vis.
tunnel Static/quasi static loads
2001 IAR 15x20 Water IAR 65˚, 70˚ delta wings Static in pitch Off-surface flow vis.
tunnel Active vortex control
2002 IAR 6x9 LSWT IAR 65˚ delta wings Static in roll Surface flow
and pitch Laser sheet smoke
PSP
PIV
Static loads
Static pressure
Reynolds number's effect
Geometry effect
COMPREHENSIVE EXPERIMENTAL STUDIES ON VORTEX DYNAMICS OVER MILITARY WING CONFIGURATIONS IN IAR
Table 1 Wind tunnel and water tunnel entries (Cont.)
Year Tunnel Configuration Motion Measurements
2003 IAR 6x9 LSWT IAR 55˚ diamond wing Surface flow
IAR 55˚ delta wings Laser sheet smoke
IAR 65˚ delta wings PSP
PIV
Static loads
Static pressure
Reynolds number's effect
Geometry effect
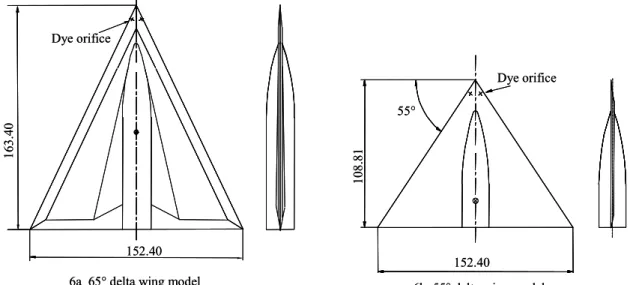
Table 2 Wind/water tunnel models tested Table 2a IAR/USAF wind tunnel models
Name IAR/USAF 65° delta wing IAR/USAF 80°/65° delta wing IAR/USAF65° delta wing/body/tail
Planform 65° delta wing 80°/65° delta wing 65° delta wing
Leading-edge sweep 65° 80°/65° 65°
Trailing edge sweep 0° 0° 0°
Span 22.835 in. 22.835 in. 22.835 in.
Root chord 24.485 in. 30.310 in. 24.485 in.
Area of planform 279.49 in2 289.11 in2 279.49 in2
Twist 0 0 0
Leading-edge shape 10° bevel on both sides 10° bevel on both sides 10° bevel on both sides
Leading-edge radius 0.02 in. 0.02 in. 0.02 in
Tolerance of leading-edge radius
±10% ±10% ±10%
Trailing edge shape 10° bevel on both sides 10° bevel on both sides 10° bevel on both sides Mean aerodynamic
chord
16.323 in. 17.466 in. 16.323 in.
Thickness of wing 0.375 in. 0.375 in. 0.375 in.
Tail leading-edge 40°
Tail hight 5 in
Reference center 10.610 in. 10.610 in. 10.610 in.
upstream of the trailing edge
upstream of the trailing edge upstream of the trailing edge
Center-body yes yes yes
Center-body diameter
3.150 in. 3.150 in. 3.150 in.
Forebody shape
Model material Composite Composite Composite
Instrumentation
14 unsteady pressure transducers
14 unsteady pressure transducers
14 unsteady pressure transducers 528 . 22 ) x 243 . 12 ( 103 . 24 r= 2− − 2− r= 24.1032−(12.243−x)2−22.528 r= 63.00972−(26.485−x)2−61.434
COMPREHENSIVE EXPERIMENTAL STUDIES ON VORTEX DYNAMICS OVER MILITARY WING CONFIGURATIONS IN IAR
Table 2b IAR wind tunnel models
Name IAR 65° delta wing IAR 55° diamond wing IAR 55° delta wing
Planform 65° delta wing 55° diamond wing 55° delta wing
Leading-edge sweep 65° 55° 55° Trailing edge sweep 0° 30° 0°
Span 22.835 in. 22.835 in. 22.835 in.
Root chord 24.485 in. 22.90 in. 16.300 in.
Area of planform 279.49 in2 249.30 186.14 in2
Configurations 10° bevel (B), body, fairing (3E) large radius, r0=0.046 in. (1A) large radius, r0=0.046 in. (2A)
10° bevel (B), body, no windward
fairing (3D) small radius, r0=0.023 in. (1B)
small radius, r0=0.023 in. (2B)
10° bevel (B), body, no leeward
fairing (3C) bevel on both sides (1C)
30° bevel (B) (2C)
10° bevel (B), body, no fairing (3B) 30° bevel (W), flat leeward (1D) 30° bevel (W), flat leeward (2D)
10° bevel (B), no leeward body and fairing (3AU)
30° bevel (W), flat leeward, no leeward body (1F)
30° bevel (W), flat leeward, no leeward body (2F)
10° bevel (B), no leeward body, no fairing (3U)
30° bevel (L), flat windward (1E)
30° bevel (L), flat windward (2E)
10° bevel (W), body, fairing (2E) 30° bevel (B), no leeward body (1G)
30° bevel (B), no leeward body (2G)
10° bevel (W), body, no windward
fairing (2D)
large radius, r0=0.046 in., no aft body (3A)
10° bevel (W), body, no leeward
fairing (2C)
small radius, r0=0.033 in., no aft body (3B)
10° bevel (W), body, no fairing (2B)
bevel on both sides,no aft body (3C)
10° bevel (W), no leeward body and
fairing (2AU)
flat leeward, 30° bevel (W), no aft body (3D)
10° bevel (W), no leeward body, no
fairing (2U)
flat leeward, 30° bevel (W) no leewardbody, no aft body (3F)
10° bevel (L), body, fairing (1E)
flat windward, 30° bevel (L), no aft body (3E)
10° bevel (L), body, no leeward
fairing (1D)
30° bevel (B), no leeward body and aft body(3G)
10° bevel (L), body, no leeward
fairing (1C)
10° bevel (L), body, no fairing (1B)
10° bevel (L), no leeward body and
fairing (1AU)
10° bevel (L), no leeward body, no
fairing (1U)
MAC 16.323 in. 15.261 in. 16.323 in.
Wing thickness 0.375 in. 0.375 in. 0.375 in.
Reference center 10.610 in. upstream of the trailing edge
10.610 in. upstream of the trailing edge
10.610 in. upstream of the trailing edge
Center-body diameter
3.150 in. 3.150 in. 3.150 in.
Forebody shape Aft body shape
Model material PVC(Upper) Aluminum alloy Aluminum alloy
Stainless steel (lower)
Instrumentation PSP, 57 pressure taps six-component balance
PSP, pressure taps, six-component balance
PSP, pressure taps, six-component balance 528 . 22 ) x 243 . 12 ( 103 . 24 r= 2− − 2− r= 24.1032−(12.243−x)2−22.528 r= 24.1032−(12.243−x)2−22.528 612 . 7 x 9 r= 2 − 2 − r= 92 −x2 −7.612
COMPREHENSIVE EXPERIMENTAL STUDIES ON VORTEX DYNAMICS OVER MILITARY WING CONFIGURATIONS IN IAR
Table 2c IAR water tunnel models
Name water tunnel 55° delta wing
water tunnel 65° delta wing used in coning motion
water tunnel delta wing models
Planform 55° delta wing 65° delta wing Delta wings
Leading-edge sweep 55° 65° 55°, 60°, 65°, 67°, 69°, 70°, 71°, 75° Trailing edge sweep 0° 0° 0°
Span 6 in. 6 in. 4.66 in., 4.24 in.,3.83in.,
3.64 in.,3.44 in.,2.68
Root chord 4.28 in. 6.433 in. 3.33in, 4.04 in., 5 in.
Area of planform 12.85 in2 19.30 in2 from 6.698 in2 to 11.657 in2
Twist 0 0° 0°
Leeward
leading-edge shape flat(L) 15° bevel (W) 10° bevel (B)
flat, 10° bevel, 30° bevel, 45° bevel
trailing edge shape flat(L) 15° bevel (W) 10° bevel (B)
flat, 10° bevel, 30° bevel, 45° bevel
Mean aerodynamic
chord 2.856 in 4.2887 in from 2.22 in to 3.333 in
Thickness of flat area
0.375 in. 0.099 in. 0.04in., 0.08 in., 0.37 in. in. Reference center 10.610 in. upstream of the
trailing edge
2.787 in. upstream of the
trailing edge
Center-body diameter
0.821 in. 0.821 in. 0.821 in. (65° delta wing
only)
Forebody shape
65° delta wing only Tolerance of
leading-edge radius
±10% ±10% ±10%
Model material Aluminum alloy Aluminum alloy Aluminum alloy Instrumentation
5-component balance and 2 dye orifices
5-component balance and 2
dye orifices 2 dye orifices
970 . 5 ) x 275 . 1 ( 380 . 6 r= 2− − 2 − r= 6.3802−(3.224−x)2−5.970 r= 6.3802−(3.224−x)2−5.970
COMPREHENSIVE EXPERIMENTAL STUDIES ON VORTEX DYNAMICS OVER MILITARY WING CONFIGURATIONS IN IAR
Fig 1 IAR 55° diamond wing and delta wing model with interchangeable leading-edges
Fig. 2a IAR 65° delta wing model with interchangeable parts Upper wing half
Upper centerbody
Upper fairing
13 pressure taps at x=0.4 15 pressure taps at x=0.6
17 pressure taps at x=0.7 Lower wing half
Fig. 2a IAR 65° delta wing model with interchangeable parts Upper wing half
Upper centerbody
Upper fairing
13 pressure taps at x=0.4 15 pressure taps at x=0.6
17 pressure taps at x=0.7 Lower wing half
Case 3E Case 4AU Case 4B Case 4C Case 4D Case 4E Case 3D Case 3C Case 3AU Case 2U Case 2AU Case 2B Case 3U Case 3B Case 2C Case 2D Case 2E Case 1E Case 1D Case 1C Case 1B Case 1AU Case 4U Case 1U
Fig. 2b Combinations of IAR 65° delta wing models with interchangeable centerbody and leading-edge Case 3E Case 3E Case 4AU Case 4B Case 4C Case 4D Case 4E Case 3D Case 3C Case 3AU Case 2U Case 2AU Case 2B Case 3U Case 3B Case 2C Case 2D Case 2E Case 1E Case 1D Case 1C Case 1B Case 1AU Case 4U Case 1U
Fig. 2b Combinations of IAR 65° delta wing models with interchangeable centerbody and leading-edge Case 3E 1a 55° diamond wing 22.30 22 .90 55° 30° 35 0.375 22.18 55° 16 .31 22.18 55° 16 .31
1b 55° delta wing 1c 55° delta wing Interchangeable leading-edge shape 1a 55° diamond wing 1a 55° diamond wing 22.30 22 .90 55° 30° 35 0.375 22.18 55° 16 .31 22.18 55° 16 .31
1b 55° delta wing 1c 55° delta wing Interchangeable
leading-edge shape
1a 55° diamond wing
COMPREHENSIVE EXPERIMENTAL STUDIES ON VORTEX DYNAMICS OVER MILITARY WING CONFIGURATIONS IN IAR
30. 31 0 22.835 80° 65° Pressure transducer
Fig. 3 IAR/AFRL 65° delta wing model Fig. 4 IAR/AFRL 80°/65° double delta wing model
24. 4 8 5 D3.150 22.835 65˚ 20 Pressure transducer
Fig. 5 IAR/AFRL 65° wing/body/tail model
R6 3.0 0 16.00 5.0 0 6.00 40º 20º D3 .1 5 0.3 7 5 Pressure transducer 12.5º 12.5º 13.875 65º 9.3 2 22 .83 5 0.98 20º 0.2 (0 .2 ) 23.485 37.134
major body axis horizontal major body axis vertical
COMPREHENSIVE EXPERIMENTAL STUDIES ON VORTEX DYNAMICS OVER MILITARY WING CONFIGURATIONS IN IAR
6a 65° delta wing model 6b 55° delta wing model Fig. 6 IAR water tunnel 65° and 55° delta wing models
152.40 10 8 .8 1 55° 152.40 16 3 .4 0 Dye orifice Dye orifice
Fig. 7 Roll rig in IAR and SARL wind tunnels Tunnel floor
Tunnel ceiling
Sting
Strut
Model
7a Roll rig installed in IAR wind tunnel
Tunnel floor Tunnel ceiling
Sting Model
7b Roll rig installed in SARL wind tunnel
-4°~93° Reference center Sting Strut Model Tunnel floor 724.81 404.14 30 48 2133.6 35% MAC Tunnel ceiling
Fig. 8 General view and installation of pitch rig in SARL wind tunnel
6a 65° delta wing model 6b 55° delta wing model
Fig. 6 IAR water tunnel 65° and 55° delta wing models 152.40 10 8 .8 1 55° 152.40 16 3 .4 0 Dye orifice Dye orifice
Fig. 7 Roll rig in IAR and SARL wind tunnels Tunnel floor Tunnel ceiling Sting Strut Model Tunnel floor Tunnel ceiling Sting Strut Model
7a Roll rig installed in IAR wind tunnel
Tunnel floor Tunnel ceiling Sting Model Tunnel floor Tunnel ceiling Sting Model
7b Roll rig installed in SARL wind tunnel
-4°~93° Reference center Sting Strut Model Tunnel floor 724.81 404.14 30 48 2133.6 35% MAC -4°~93° Reference center Sting Strut Model Tunnel floor 724.81 404.14 -4°~93° Reference center Sting Strut Model Tunnel floor 724.81 404.14 30 48 2133.6 35% MAC 30 48 2133.6 35% MAC Tunnel ceiling
Fig. 8 General view and installation of pitch rig in SARL wind tunnel
COMPREHENSIVE EXPERIMENTAL STUDIES ON VORTEX DYNAMICS OVER MILITARY WING CONFIGURATIONS IN IAR
σ=30°, φ= −28° σ=30°, φ= −16° σ=30°, φ= −14° σ=30°, φ= −7° σ=30°, φ= −4.6° 10a concentrated vortex pattern 10b vortex “whorl” pattern
σ=30°, φ= 0° σ=35°, φ= 2.5° σ=35°, φ= 2.5° σ=35°,φ=2.5°
10c vortex bursting patterns observed on different wing areas
Model Tunnel Floor Stationary cylinder Rotating cylinder Strut Belt Support Arm Sector Water surface
Fig. 9 OPLEC Coning rig in IAR water tunnel
σ=30°, φ= 14° σ=30°, φ= 47° σ=30°, φ= 51° σ=35°, φ= 59° σ=35°, φ= 62°
10d reversed flow patterns observed on windward wing half Fig. 10 Skin friction topologies on 65° delta wing in roll
COMPREHENSIVE EXPERIMENTAL STUDIES ON VORTEX DYNAMICS OVER MILITARY WING CONFIGURATIONS IN IAR
Fig. 11 Evolutions of topological changes at different roll and sting angles (Λ=65º) φ=36° φ=0.0122 φ=−0.0122 φ=28° φ=0.0199 φ=−0.0199 φ=20° φ=0.0242 φ=−0.0242 φ=0.0223 φ=−0.0223φ=24° φ=16° φ=0.0256 φ=−0.0256 φ=8° φ=0.0274 φ=−0.0274 φ=0° φ=0.0279 φ=−0.0279 φ=0.0278 φ=−0.0278φ=4° φ=32°
φ=0.0168 φ=−0.0168φ& φ& φ& φ=40° φ=0
φ& φ&
φ&
φ& φ& φ& φ& φ& φ&
φ& φ& φ& φ& φ& φ& φ& φ=36° φ=0.0122 φ=−0.0122 φ=28° φ=0.0199 φ=−0.0199 φ=20° φ=0.0242 φ=−0.0242 φ=0.0223 φ=−0.0223φ=24° φ=16° φ=0.0256 φ=−0.0256 φ=8° φ=0.0274 φ=−0.0274 φ=0° φ=0.0279 φ=−0.0279 φ=0.0278 φ=−0.0278φ=4° φ=32°
φ=0.0168 φ=−0.0168φ& φ& φ& φ=40° φ=0
φ& φ&
φ&
φ& φ& φ& φ& φ& φ&
φ& φ& φ& φ& φ& φ& φ&
Fig. 12 Gray level profiles through vortex core under rolling oscillatory conditions
(σ=30º, ∆φ=40º, k=0.04, φ0=0º)
COMPREHENSIVE EXPERIMENTAL STUDIES ON VORTEX DYNAMICS OVER MILITARY WING CONFIGURATIONS IN IAR