Publisher’s version / Version de l'éditeur:
Vous avez des questions? Nous pouvons vous aider. Pour communiquer directement avec un auteur, consultez la première page de la revue dans laquelle son article a été publié afin de trouver ses coordonnées. Si vous n’arrivez Questions? Contact the NRC Publications Archive team at
[email protected]. If you wish to email the authors directly, please see the first page of the publication for their contact information.
https://publications-cnrc.canada.ca/fra/droits
L’accès à ce site Web et l’utilisation de son contenu sont assujettis aux conditions présentées dans le site LISEZ CES CONDITIONS ATTENTIVEMENT AVANT D’UTILISER CE SITE WEB.
Student Report (National Research Council of Canada. Institute for Ocean Technology); no. SR-2006-21, 2006
READ THESE TERMS AND CONDITIONS CAREFULLY BEFORE USING THIS WEBSITE.
https://nrc-publications.canada.ca/eng/copyright
NRC Publications Archive Record / Notice des Archives des publications du CNRC :
https://nrc-publications.canada.ca/eng/view/object/?id=dcc305be-f4b3-4c2d-b12e-7c9edc2ba9c2 https://publications-cnrc.canada.ca/fra/voir/objet/?id=dcc305be-f4b3-4c2d-b12e-7c9edc2ba9c2
NRC Publications Archive
Archives des publications du CNRC
For the publisher’s version, please access the DOI link below./ Pour consulter la version de l’éditeur, utilisez le lien DOI ci-dessous.
https://doi.org/10.4224/8896219
Access and use of this website and the material on it are subject to the Terms and Conditions set forth at
Wake survey: procedures and troubleshooting
DOCUMENTATION PAGE
REPORT NUMBER
SR-2006-21
NRC REPORT NUMBER DATE
August 2006
REPORT SECURITY CLASSIFICATION
Unclassified DISTRIBUTIONUnlimited
TITLE
Wake Survey: Procedures & Troubleshooting
AUTHOR(S)
David St. George
CORPORATE AUTHOR(S)/PERFORMING AGENCY(S)
National Research Council, Institute for Ocean Technology (NRC-IOT)
PUBLICATION
---
SPONSORING AGENCY(S)
National Research Council, Institute for Ocean Technology (NRC-IOT)
IMD PROJECT NUMBER
421009
NRC FILE NUMBER
--
KEY WORDS
Wake, survey, troubleshooting PAGES 19 + app.
FIGS.
10 TABLES
SUMMARY
(See attached: Page i)
ADDRESS National Research Council
Institute for Ocean Technology Arctic Avenue, P. O. Box 12093 St. John's, NL A1B 3T5
National Research Council Conseil national de recherches Canada Canada Institute for Ocean Institut des technologies Technology océaniques
WAKE SURVEY: PROCEDURES & TROUBLESHOOTING
SR-2006-21
David St. George August 2006
SUMMARY
This report documents the present practices involved in completing a wake survey at the National Research Council Canada (Institute for Ocean Technology). To begin the report, background information is provided in defining a wake survey. The introduction also provides a very brief synopsis of the history behind wake survey procedures, comparing past and present equipment used in implementation. Following this, preparation methods used on the wake probe during this work term; both pitot tube bleeding and water depth testing are addressed. Within water depth testing is
explanation of the three different tests: Flow samples, step samples, and drift samples. Then there is a brief discussion on the testing and data analysis stages of wake
surveying. Unfortunately though, these stages were never reached during this work term. This was due to various behavioural problems with particular pressure
transducers which showed tendencies of unresponsiveness after lengthy submersion in water. However, this was not the only obstacle causing difficulty during this semester. Instruments used in transmitting pressure signals have also acted inadequately. To learn more about the performance of all equipment used in the wake survey process, various troubleshooting methods have been used and are documented. These include testing for relationships between wire impedance, voltage, and applied hydrostatic pressure in each transducer. The results and conclusions of these tests close the
discussion. To complete the report, three recommendations are made which may assist in guiding any future work completed on improving wake survey equipment.
TABLE OF CONTENTS
1.0 INTRODUCTION... 1
1.1 Background Information ... 1
2.0 PREPARATION PROCEDURES... 4
2.1 Bleeding the Pitot Tube... 4
2.2 Water Testing... 5
2.2.1 Data acquisition & analysis... 6
2.2.2 Long-term (drift) samples... 6
2.2.3 Step samples... 7
2.2.4 Flow samples... 8
2.3 Installation of Probe Positioning Apparatus... 9
3.0 TESTING... 11
4.0 TROUBLESHOOTING... 13
4.1 Re-bleeding of Pitot Tube ... 13
4.2 Impedance Measurement ... 14
4.3 External Power Source ... 14
4.4 Compensator Tweaking ... 16
5.0 CONCLUSIONS... 17
6.0 RECOMMENDATIONS... 18
7.0 REFERENCES... 19
LIST OF FIGURES Figure 1: Pitot tube with incoming flow vector ... 2
Figure 2: Bleeding pitot tube... 5
Figure 3: Plot of long-term (drift) sample ... 7
Figure 4: Plot of step sample... 8
Figure 5: Plot of flow sample. ... 9
Figure 6: Probe positioning apparatus mounted to model ... 10
Figure 7: Positioning stage platform against propeller shaft. ... 10
Figure 8: A plot of νX/νS against θ. ... 12
Figure 9: Tabular results for external voltage test. ... 15
APPENDICES Appendix A: Igor Procedures
Appendix B: Transducer Connection Appendix C: Impedance Test Setup Appendix D: Impedance Test Results
1.0 INTRODUCTION
1.1 Background Information
Performing a wake survey on a ship model is a very useful and important tool in determining the effectiveness of a hull design. The purpose of wake surveying is to evaluate the water flow, through pressure measurements, experienced by the propeller of a vessel. This is important as analysis of this exercise can be used to gauge vessel attributes such as: propeller and fuel efficiency, flow noise, and cavitation issues. Completing a wake survey assists in determining the correct propeller for a vessel under specific conditions.
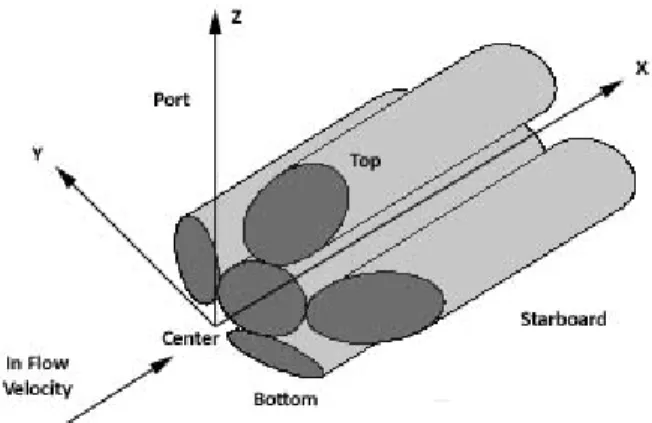
A wake survey is completed using a 5-hole pitot tube mounted such that it lies directly parallel to the shaft of the propeller. All holes are situated on the tip of an extended probe head. One hole exists in absolute center of the head, while the remaining four are oriented at 45º angles in each compass direction, adjacent to the center hole. The pitot tube, using an external positioning apparatus and software, moves in concentric circles. These circles are measured in multiples of the established propeller radius. The ratios used in wake survey testing can range anywhere from 30% to 110% of this original radius.
Figure 1: The five hole pitot tube. It is customary to use the labels (Port, Starboard, etc.) to distinguish between the five transducers when performing tests.
The actual reading of pressures comes from five piezoelectric transducers (one for each pitot tube hole), which sit in a casing immediately aft of the pitot tube. These
transducers are extremely sensitive to atmospheric changes, making them very
valuable for testing purposes. However, they can be, occasionally, very unpredictable. This pertains to the fact that they are very delicate and acquired measurements can be affected greatly by the slightest amount of air contact.
Each pressure transducer used in the current wake survey setup has its own individual connection and links to what is known as the Wake Survey Pressure Signal Conditioner Unit (SCU). The main purpose of this unit is to convert the 5-pin connection that exists for each respective transducer, into a 10-pin connection, which can be linked to a Data Acquisition System (DAS) for sampling. Also, the unit contains adjustable compensators that assist in exaggerating voltage (pressure) changes experienced by the transducer, making data analysis easier.
This particular wake survey system was introduced in 1994-95 as a replacement to a system that was deemed inefficient for numerous reasons. One of which was the tediousness involved in keeping all of the pressure transducers free from air bubbles since five probe heads were used in testing. Hence, this meant that all five probes had to be consistently bled and monitored for contamination. Also, to complete an entire wake survey was very time consuming as each of the five probe heads had to be moved simultaneously for each set of points at only intervals of 5 degrees. Using the procedures in place presently, a wake survey can be completed in a full working day (not including preparation time). Complimentary to that point, the pressure transducers presently are much closer to the physical measurement location, giving more accurate and quicker readings.
Regardless of the speed at which a wake survey can be completed with the present system, it is still problematic due to the fragility that exists within the pressure
transducers and the volatility of the existing SCU. During the work term, many new questions have come up about the procedures and equipment used in completing a wake survey. For that reason, this report will document the preparation procedures and troubleshooting methods performed in an attempt to provide an answer to these
2.0 PREPARATION PROCEDURES 2.1 Bleeding the Pitot Tube
As mentioned previously, the pressure transducers are very sensitive and delicate. If an air pocket comes into contact with any of the transducers, pressure readings would be potentially unusable. To prevent this from occurring, a technique known as bleeding was introduced. Bleeding the pitot tube involves immersing the pitot tube, and
essentially the pressure transducers, with Dow Corning 200 (silicon oil). The silicon oil is very inert and will not react with the transducers. It is very useful in that it provides a high surface tension that is impervious to air.
By adjusting a round nut that encloses the transducers, silicon oil can be seeped down through the pitot tube and into the shell. By repeatedly bleeding and refilling the plastic encasement that shields the pitot tube over a long period of time, it can be assured that the silicon oil is properly immersed and air pockets do not exist and will not transcend the seal that is created. Normally, about two to three hours of bleeding should be
performed in addition to the pitot tube being immersed overnight in silicon oil before any significant testing is performed. This is usually a sufficient duration to ensure a quality measurement.
Figure 2: The pitot tube being bled inside its plastic encasement. Turning the round nut (shown, bottom) allows the silicon oil to seep through, bleeding the transducers inside. Silicon oil is entered through two screw holes in the top (not shown).
Once this procedure has been performed, it is always a good idea to connect the wake probe to the SCU and to the DAS to acquire preliminary voltage readings using GDAC’s Digital Meter program. This application allows the user to view an instantaneous reading of the voltage through each transducer. This is beneficial as it provides a quick glance regarding whether or not all equipment is working appropriately. Allowing the pitot tube to bleed while running this program would be of assistance, as results should show a steady alteration, be it increasing or decreasing, in voltage.
2.2 Water Testing
In continuing the preparation process of completing a wake survey, it was decided that using NRC-IOT’s Cavitation Tunnel would be an excellent opportunity during this work term to test the pressure transducers and pitot tube using a variety of techniques such as shifting the water depth and applying flow velocity. These changes in test conditions
would not be available to us if the Trim Dock at the Towing Tank was used. They are imperative in determining whether all the components of the wake probe are functioning properly for the actual wake survey.
2.2.1 Data acquisition & analysis
The software used for the data sampling is the standard NRC, in-house OpenVMS software package GEDAP. GEDAP provides a great deal of flexibility in not only being able to provide data acquisition through the GDAC software, but also in plotting through GPLOT software. The GPLOT software provides an excellent, quick view of the
acquired data. However, the more user-friendly and powerful software solution exists in Igor Pro 5.03, developed by WaveMetrics. This application is excellent for detailed analysis. User functions can be written and executed. Also, built-in functions called wave packages, provide functionality in comparing data acquired by all five transducers. For analysis of much of the data in these samples, various Igor procedure files
containing functions were written as a shortcut when repeatedly analyzing similar plots and data. Two of the procedures written during this work term have been included in Appendix A.
2.2.2 Long-term (drift) samples
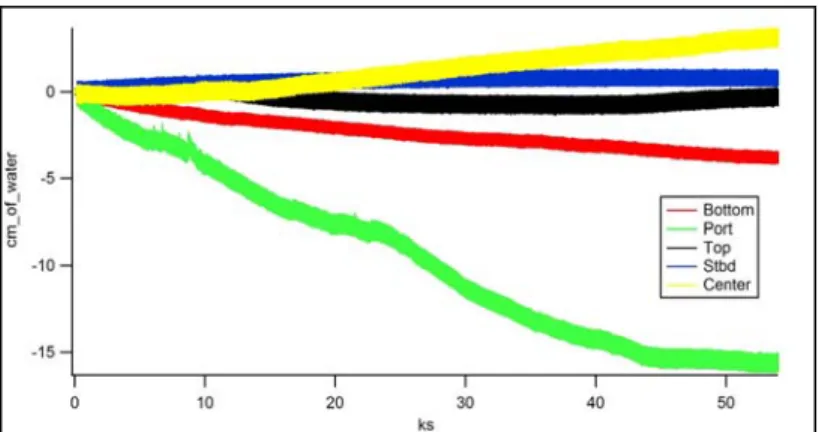
It is customary to acquire long-term samples on the wake probe in static water conditions. The duration of a long-term sample is usually between ten and sixteen hours. These samples assist in checking for voltage drifting and air pockets around the transducers. One of these samples is displayed in Figure 3.
Figure 3: Long-term (drift) sample. Extensive drift is displayed by the transducers positioned in the port, centre, and bottom holes of the pitot tube.
2.2.3 Step samples
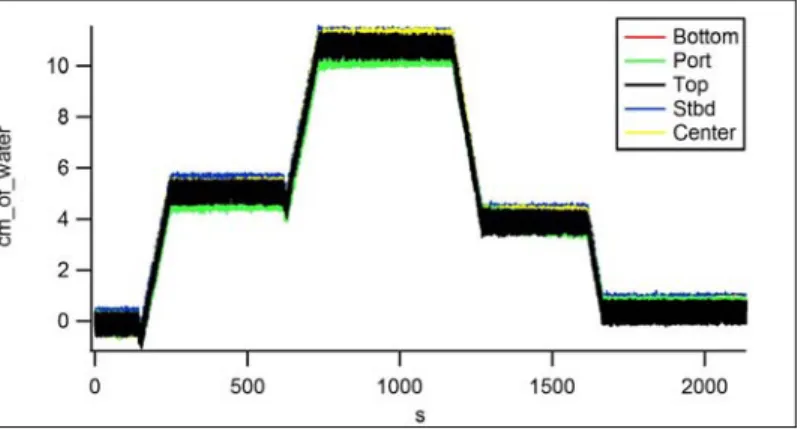
Also completed in the Cavitation Tunnel is what is characterized as a “step test”. A step test consists of adjusting the water level in set time intervals during a sample to see whether congruency exists between all five transducers. This sample is completed by starting a sample with what is known as a tare section, where no experimental variables are changed for a set period of time. It is very important to have a tare section in every type of sample completed, as it provides a reference for the rest of the data in that sample. Following the tare section, the water depth is usually altered in a systematic fashion both upward and downward (but not past the pitot tube head), leaving a large time interval between each change so that it can be properly analyzed graphically. This test could also be performed using the probe positioning apparatus with the associated controller software (instead of using the Cavitation Tunnel’s capabilities). However, due to the age of the software, a memory limit exists prohibiting an excess number of
chosen depths. An example of one of these samples is displayed in Figure 4. This test is performed mainly to ensure congruency between all five transducers, as they should
experience essentially the same pressure in during these tests. Also, it is important in ensuring a transducer’s proper reaction to depth change and providing a decent assessment of drift.
Figure 4: Graph of pressure readings following a step sample. In this example, all five transducers overlap graphically, hence they are all performing congruently and responding appropriately to depth changes.
2.2.4 Flow samples
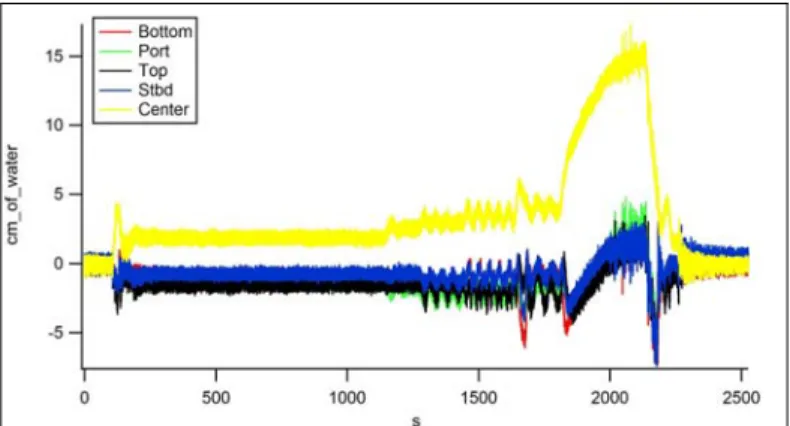
The final type of test involves using the full potential that exists within the Cavitation Tunnel. In using its ability to flow water through the tank around the pitot tube, a much more complete assessment of the performance of the transducers can be achieved. Also, by making some slight apparatus adjustments, testing the wake probe at varying angles of pitch and yaw can be essential in determining a presence of symmetry between opposing transducers. It is common to perform a flow sample, increasing the water velocity in intervals of 0.25 m/s up to 1.5 m/s An example is shown in Figure 5.
Figure 5: A flow sample. The center transducer experiences the most pressure from the various flow rates during this sample.
2.3 Installation of Probe Positioning Apparatus
The only extensive external, model-based preparation for a wake survey exists in installing and homing the probe positioning stage for the wake probe. The apparatus consists of two servomotors which control both x and y movement, limiting a total vertical range to approximately 26 centimetres. The positioning stage is complimented by a Microsoft QuickBasic application that can position the probe using both polar and rectangular co-ordinates. Further discussion of this application involves its purpose in final wake survey testing which is presented in Section 3.0.
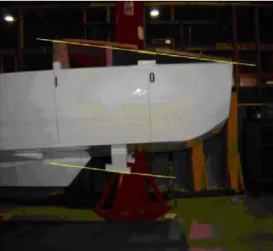
Physically speaking, the positioning stage sits at the stern of the model. In order to have the wake probe directly parallel with the shaft of the propeller, the angle that the shaft lies at must be measured. Equivalent to this angle, a small platform typically has to be constructed so that the probe positioning apparatus and consequently, the wake probe work parallel to the propeller plane. This platform also has to be produced such that the positioning stage can reach over the stern of the model and concurrently position the
wake probe with reasonable depth. Depth of the wake probe is important due to the circular trajectory of the wake probe during testing, which if calibrated incorrectly, could result in the pitot tube striking the hull of the model. For this reason, it is important to install and test the probe positioning apparatus and controls onshore using a rod or extra pitot tube before placing the model into water.
Figure 6: The above figure displays the probe positioning apparatus mounted on the stern of a model. The probe positioning apparatus uses two servomotors to move the wake probe in x and y directions defined by its complimentary QuickBasic software written at NRC.
Figure 7: A constructed, inclined platform is mounted at the same angle as the propeller shaft. This is to ensure the wake probe is parallel to the propeller plane.
3.0 TESTING
Once all the preparation duties have been completed and tested with adequate
success, the actual wake surveying can begin. The completion of a wake survey test, with all the points in the chosen concentric circle ratios acquired, occurs at a constant speed. However, it is normal to perform a wake survey test at a variety of speeds. In this case, all points desired must be acquired at all set speeds. The probe positioning software automatically sorts the chosen data points into runs. These runs maximize what points can be sampled in one tow carriage trip, decreasing the amount of time needed to complete a wake survey.
After completion of all runs at determined speeds, a GEDAP algorithm uses recorded information such as carriage (or model) speed,
ν
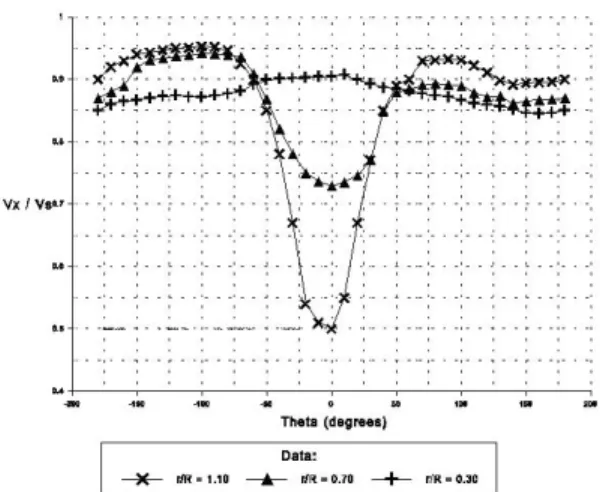
S, acquired pressures, and probeposition to calculate three velocity parameters: νx (axial), νt (tangential), and νR (radial).
These velocities are used in creating a plot of νX/νS vs. θ (a polar degree measure of
each recorded position) using each propeller ratio as its own curve. An example is in Figure 8. The plots created can be used in a Matlab application where the user can interactively fit a curve to the acquired data by altering various critical points on the transposed plot.
Figure 8: A plot of ν /ν against θ. Each fitted curve is representative of a propeller radius ratio.
X S
Unfortunately, during this work term, the volatility of the transducers became an
unsurpassable impediment. Hence, testing and data analysis was not completed to the extent desired. Much time was spent developing theories concerning reasoning behind the behavior of these transducers. The following section entitled “Troubleshooting” discusses this.
4.0 TROUBLESHOOTING
During the work term, the ability to execute a proper wake survey was greatly inhibited by unforeseen issues that have arisen. The problems experienced have been mainly related to particular transducers appearing to “die” (reading in GDAC as ±10 V) once in contact with fresh water for greater than approximately twelve hours, but later begin working again after being re-bled repeatedly. Many methods in trying to understand why these problems occur have been introduced, with diverse results. The following section discusses these approaches and conclusions.
4.1 Re-bleeding of Pitot Tube
The option of re-bleeding the pitot tube is never a bad idea, however it is an
inconvenient one if the wake probe is already installed onto the stern of a model, or is in water. Due to the time it takes to properly bleed the transducers, and to reinstall the wake probe, it is best left as a last resort to solving the problem of a faulty transducer. This method is adequate for assurance that a particular transducer is truly faulty and an air pocket was not present on the face of its membrane. Bleeding the pitot tube can occasionally assist in reviving the transducers back to a usable state, as it has worked during this work term. However, it provides very little insight into the reasoning for their behaviour.
4.2 Impedance Measurement
Another approach analyzed in the various attempts to alleviate transducer problems was to try and understand the effect of pressure on the impedance in the wires for each transducer. Each connection from every individual transducers contains five wires: red and black for power, green and white for signal output, and an additional wire for grounding out (or vent). A picture of the split connection possessed by these
transducers is displayed in Appendix B. It was garnered a possibility that a change in impedance while changing pressure could provide indicate to an issue regarding the choice in transducers used in the Wake Survey process. This measuring procedure was completed using a breakout box to easily divide the five wires within the cable, and a multi-meter to measure the impedance. A picture of the setup is displayed in Appendix C. The results in Appendix D, show that there is no relationship between impedance and pressure. Needless to say, this approach was unsuccessful in solving the problems regarding a faulty transducer.
4.3 External Power Source
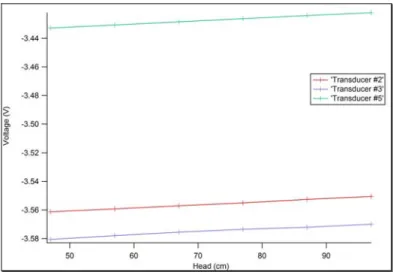
To isolate the pressure transducers from the signal-conditioning unit, it was decided to connect an external power source (measured at approximately 7.0 V) to a breakout box with the transducer wires mentioned previously. While doing this, the amount of “head” (or hydrostatic pressure) about the pitot tube was changed. Using a multi-meter, the changing voltage was measured. As displayed in both Figure 8 and Figure 9, for each working transducer, there is a linear (although both increasing and decreasing,
the voltage. Furthermore, the linear correlation exists in the hundredths and
thousandths of volts. This method proved though that at least the transducers were responding to change, implying functionality. Completing this test produced questioning of the SCU, considering the DAS displayed readings of some transducers being
saturated (±10 V), while this test showed that transducers were functional. In addition, between the individual transducers and the DAS, data manipulation can only occur at the SCU. Transducer Head (cm) 1 2 3 4 5 47 -3.5613 -3.5806 3.5313 -3.4327 57 -3.5592 -3.578 3.529 -3.4306 67 -3.557 -3.5755 3.5262 -3.4284 77 -3.555 -3.5735 3.5233 -3.4262 87 -3.5526 -3.5721 3.5209 -3.424 Voltage (V) 97 N/A -3.5505 -3.57 3.519 -3.422
Figure 9: Results of power transducers externally and their response to head change. It can be seen that all of the transducers respond to change in pressure applied except for Transducer #1, which could not emit a stable reading at all
whatsoever.
Figure 10: This is a plot of the data from Figure 8, with transducers 2, 3, and 5. An obvious linear relationship can be seen from this.
4.4 Compensator Tweaking
In some situations, a signal coming from each transducer is inaccurately modified after being passed through the signal-conditioning unit. The compensators that transmit the signal, can excessively exaggerate the voltage through the transducer. If this occurs, readings can falsely give the idea that a transducer is saturated or dead when it is really not. Sometimes, tweaking the associated channel compensators inside the SCU can alter the voltage to a value, which is more representative of the real voltage. If the voltage is still saturated and stays stationary during tweaking, the compensators are not causing the problem.
5.0 CONCLUSIONS
A wake survey is a very beneficial process in learning about the behaviour of a model in a relatively short amount of time. However, the current flaws in our configuration are proving lethal in allowing proper testing to be completed. While testing on the actions of the transducers is ongoing, there still has not been enough information gathered from previous work to use as a guide in investigating possible solutions.
At this point in time, many uncertainties exist in this wake survey program. For instance, the external power source test established a possible problem with the Signal
Conditioning Unit due to the response of the transducers against the saturated readings that GDAC was providing. Also, the SCU has been problematic due to its fragility. While tweaking the compensators inside the unit, touching various parts of the hardware have a tendency to skew voltage values considerably.
Nevertheless, not all of the uncertainties exist in the SCU. After having the same transducer die on two consecutive occasions after submerging the pitot tube in fresh water, questions about the physical attributes of the transducers have arisen. This has mainly to do with the fact that only one of five transducers died, meaning that minor differences may exist on an individual basis between each transducer.
6.0 RECOMMENDATIONS
Although much advancement has been made in refining the techniques involving a wake survey during the term, many additional obstacles have emerged and have yet to be surmounted. Recommendations for future work on the Wake Survey system would include:
• Analysis of the Signal Conditioning Unit must be completed. After ongoing work and tweaking with the SCU, it has been noted that measured
voltages have a tendency to change drastically even if the slightest contact is made with the hardware inside the unit. Such a problem is not minor in scope. Work involved in this project may include manufacturing a suitable replacement.
• Continuing work in determining the cause of sudden transducer death and revival. It has been noted that temperature may have an affect on the transducers although this was not tested during the work term.
• Active consideration of previous wake survey practices in comparison to the current procedure. Due to the great difficulty experienced recently in reaching the testing stages, it is definitely worthwhile to contrast present and past experiences to determine whether the older method is more efficient.
7.0 REFERENCES
Hoskins, Paul. (1995): “Wake Survey Analysis and Positioning Software Manual”. NRC/IMD Laboratory Memorandum, March.
Appendix A: Igor Procedures
// autograph.ipf
// Auto-graphing Procedure For Igor Pro 5.03 // Written By: David St. George
// Work Term I Student
// This procedure, upon compilation, can create a graph with a legend // automatically by just selecting "Graph Current .DAC With
// Colors/Legend" from the "AutoGraph" menu.
// Note: Waves labelled "Top, Stbd, Center, Port, Bottom" are labelled // via the .DACON file built in GEDAP. These must be changed
// if used for another .DACON file.
#pragma rtGlobals=1 // Use modern global access method. Menu "AutoGraph"
"Graph Current .DAC With Colors/Legend", Autograph() End
function Autograph()
Display Bottom,Port,Top,Stbd,Center
ModifyGraph rgb(Top)=(0,0,0) // Coloured Black
ModifyGraph rgb(Stbd)=(0,12800,52224) // Coloured Blue ModifyGraph rgb(Center)=(65280,65280,0) // Coloured Yellow ModifyGraph rgb(Port)=(16384,65280,16384) // Coloured Green ModifyGraph rgb(Bottom)=(65280,0,0) // Coloured Red
Legend/C/N=text0/A=MC ShowInfo
// zero.ipf
// Taring Procedure For Igor Pro 5.03 // Written By: David St. George
// Work Term I Student
// Upon compilation of this procedure, you must drag and drop // both the circular icon (A) and the square icon (B) onto the two // points that you would like to use as a tare. Once this is complete, // select "Tare Data" from the menu entitled "Tare" and your graph(s) will // be tared. Note: Waves labelled "Top, Stbd, Center, Port, Bottom" are // labelled via the DACON file built in GDAC. These must be changed if using // for another .DACON file.
#pragma rtGlobals=1 // Use modern global access method.
ShowInfo
Menu "Tare"
"Tare Data", zero() end
Function zero()
wave Bottom, Top, Stbd, Port, Center
WaveStats/R=(xcsr(A),xcsr(B)) Center Center = Center - V_avg
WaveStats/R=(xcsr(A),xcsr(B)) Bottom Bottom = Bottom - V_avg
WaveStats/R=(xcsr(A),xcsr(B)) Top Top = Top - V_avg
WaveStats/R=(xcsr(A),xcsr(B)) Stbd Stbd = Stbd - V_avg
WaveStats/R=(xcsr(A),xcsr(B)) Port Port = Port - V_avg
Appendix B: Transducer Connection
This is an extension for the transducer cable known as a “pigtail”. It takes the five-pin connection of the transducer and splits the wires inside so various
measurements can be done. Shown are the five different wires mentioned in Impedance Measurement (Section 4.0.2).
Appendix C: Impedance Test Setup
This is the configuration used in measuring the impedance across each combination of 4 wires in each transducer. Displayed in the center is what is called a “breakout box”. By placing the wires from the pigtail into this box, a multi-meter can be used to measure various details across desired ports. The pigtail was connected to the transducer, that had various levels of pressure applied to it through the pitot tube. The results of this test are shown in Impedance Test Results (Appendix D).
Appendix D: Impedance Test Results
Impedance Measurements with ~70 cm Head Transducer 1 2 3 4 5 R/W 0.2501 3.08 2.153 0.875 2.924 R/B 0.778 2.018 2.064 1.692 1.949 R/G 0.696 1.005 1.045 0.879 1.009 B/W 0.696 1.124 0.1036 2.529 1.039 B/G 0.731 1.075 1.076 0.852 1.004 Wire Branch Combo Impedance (KΩ) G/W 0.777 2.136 1.165 1.176 1.979
Impedance Measurements with ~80 cm Head Transducer 1 2 3 4 5 R/W 0.2546 3.07 2.2 0.874 2.92 R/B 0.779 2.012 2.063 1.693 1.944 R/G 0.697 1.003 1.045 0.877 1.006 B/W 0.698 1.117 0.1543 2.528 1.04 B/G 0.732 1.072 1.076 0.852 1.002 Wire Branch Combo Impedance (KΩ) G/W 0.78 2.125 1.213 1.715 1.977
These two tables compare impedance values measured in the wires of the individual connections of all five transducers. It can be seen that no uniform change in impedance exists with the addition of head to the pitot tube.