Academic and Research Staff
Prof. D. Kleppner Dr. M. T. Myint Dr. C. A. Kocher Dr. D. E. Pritchard
Graduate Students
G. N. Carter E. M. Mattison F. G. Walther
F. Y. Chu P. F. Winkler
RESEARCH OBJECTIVES AND SUMMARY OF RESEARCH
Our group is concerned with atomic structure and the interaction between atoms. We are also involved in applications of superconductivity to problems in atomic physics and to problems of energy detection.
1. We are carrying out experiments to determine the triplet and singlet potentials between atoms by measuring differential scattering cross sections with a spin-selected atomic beam. We report here the results of a series of experiments to measure the triplet potential for various alkali-alkali systems.
2. We are continuing an absolute determination of the ratio of the magnetic moments of the proton and electron. This work is in its final stages.
3. In an attempt to undertake scattering experiments with atomic hydrogen we are investigating a new type of superconducting detector designed to count individual atoms. The device is also potentially capable of detecting infrared radiation with unprecedented sensitivity. Although it is still a rather speculative project, first results have been encouraging.
D. Kleppner
A. SPIN-EXCHANGE SCATTERING 1. Alkali-Alkali Spin Exchange
We have completed preliminary measurements of differential spin exchange cross sections for collisions of Na with K, Rb, and Cs, and for K colliding with Rb and Cs.
These measurements determine the angular dependence of both the probability of exchange and the spin-summed differential cross section at a particular energy. For the systems K-Cs and K-Rb we have made measurements at several energies.
We observe rainbows and supernumerary rainbows in the sum differential cross sec-tion for all of the alkali-alkali systems that we have studied (see Fig. V-1). This rain-bow structure occurs only in the triplet-state scattering because the singlet potential
is sufficiently deep to cause orbiting at the energies of our collisions (-1/5 eV). Since the singlet interaction contributes only 1/4 of the sum cross section, only a small
This work is supported by the Joint Services Electronics Programs (U. S. Army, U. S. Navy, and U. S. Air Force) under Contract DA 28-043-AMC-02536(E), and in part by the U. S. Navy (Office of Naval Research) under Contract N00014-67-A-0204-0006.
v=. II x 105 cm/sec Av/v = 0.05 0 000 0 000 000 o SI I I I I I 0 50 100 150 200 250 300 8cof m (millirad) (a) 0 0 0 0 0 0 v =1.06 x 105cm/sec Av/v = 0.05 I I t ! i I 200 8 cofm (millirad) 300 400 Fig. V-1. (a) (b)
Sum cross section Sum cross section
for K on Rb. for K on Cs. O 0 0 00 o o Ix 105 5 x 10⁴ - 5xIO42 X 104 -I x104 103 2x10 lx
F
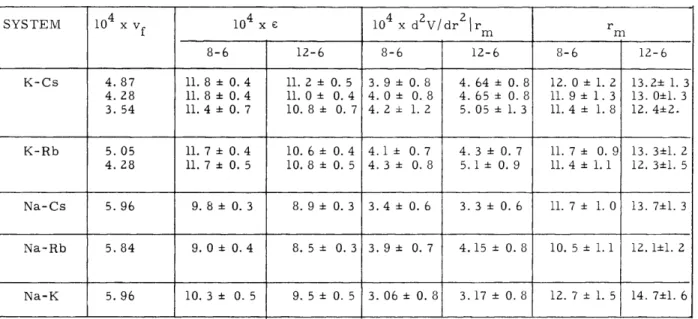
5x102 Ix 10 -5 x 10 -2x 10 2 I x 102 -5x 10Table V-1. Comparison of well depths and curvature for 8-6 and 12-6 potentials (in atomic units).
SYSTEM 104 xv 104 x E 104 x d2V/dr2 r r 8-6 12-6 8-6 12-6 8-6 12-6 K-Cs 4. 87 11. 8 ± 0. 4 11. 2 ± 0. 5 3. 9 ± 0. 8 4. 64 ± 0. 8 12. 0 + 1. 2 13.2 i1. 3 4.28 11.8±0.4 11. 0+ 0.4 4.0± 0.8 4.65+ 0.8 11.9+ 1.3 13.0+1.3 3.54 11.4 ± 0.7 10.8 ± 0.7 4.2 ± 1.2 5.05 ± 1.3 11.4 1.8 12.4±2. K-Rb 5. 05 11. 7 ± 0.4 10. 6 ± 0.4 4.1± 0. 7 4. 3 0. 7 11. 7 0. 9 13. 3±1. 2 4.28 11.7 ± 0.5 10.8 ± 0.5 4.3 0.8 5.1 0.9 11.4 1.1 12. 3 1.5 Na-Cs 5. 96 9. 8 ± 0. 3 8. 9 ± 0. 3 3. 4 0. 6 3. 3 0. 6 11. 7 1. 0 13. 7±1.3 Na-Rb 5. 84 9. 0 ± 0.4 8. 5 ± 0. 3 3. 9 0. 7 4.15 ± 0. 8 10. 5 1.1 12. 1±1. 2 Na-K 5.96 10. 3 ± 0. 5 9. 5 ± 0. 5 3. 06 ± 0. 8 3.17 ± 0.8 12. 7 1. 5 14. 7±1. 6
correction is necessary before applying the tables of Hundhausen and Pauly, which per-mit a two-parameter fit to the triplet potential. It may be argued on both physical3 and mathematical2 grounds that the rainbow and supernumerary rainbow structures are determined principally by the well depth and the curvature of the potential at the bottom of the well, respectively.
Table V-1 shows that the well depths and well curvatures of the triplet potentials that were obtained from our data by using Hundhausen and Pauly's table for a Lennard-Jones
8-6 potential ansatz. If a Lennard-Jones 12-6 potential were used instead, the well
depth would be approximately 10% smaller, and the curvature would be somewhat greater (see Table V-i). In the systems on which measurements were made at more than one energy, the well depths and curvatures agreed within experimental error.
The probability of exchange is determined solely by the difference between the mag-nitude and phase of the triplet and singlet scattering amplitudes
I + [x(O)] 2- Zx(O) cos [6(0)]
Pexex ( ) = 6 + 2[x(0)]2 (1)
where x(8) = ifl I/f 3 i, and 6 is the relative phase of fl and f3. For small angles it may
be shown3 that x i1, so that 6 may be determined directly from Pex* For larger angles,
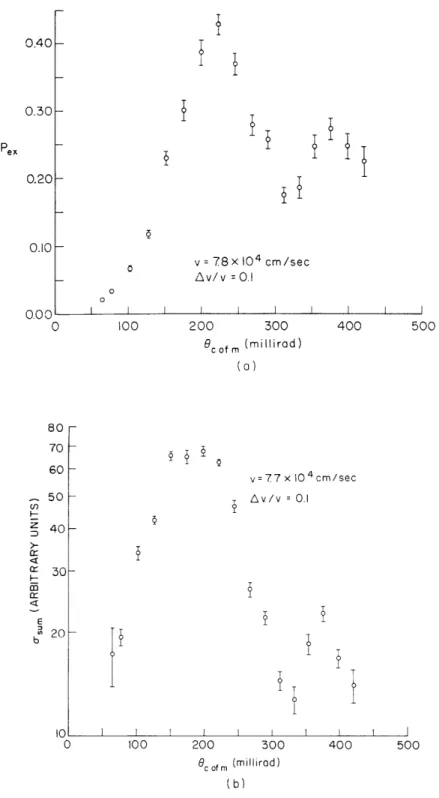
x may differ from 1 and, also, averaging processes in the apparatus tend to damp out the oscillatory structure of Pex (see Fig. V-Z). But x changes slowly relative to 6,
v =78x104 cm/sec Av/v = 0.1 200 300 cof m (millirad) (a) v= 77x 10 4 cm/sec Av/v = 0.1 100 200 SI I i I 300 400 500
&c ofm (millirod)
(b)
Fig. V-2. (a) Probability of exchange for K on Cs.
(b) Exchange cross section for K on Cs.
0.40 0.30 0.20 -0.10 i 0.00 400 500 50 40 20
-so it is possible to identify the angles at which 6 passes through multiples of rr/2. Thus it is possible to determine 6 for a reasonably wide range of angles.
10-
--4 Fig. V-3. Comparison of theoretical (solid line)
-4
- "
10 -and experimental values of difference
potential (-2) in Na-Cs. Dashed line
V is van der Waals' potential shown for
(a.u) comparison. 6 is a multiple of Tr/2
for points with horizontal error bars. -5
10
10 12 14 16 18
R
(ao)--The following argument provides a simple method for obtaining a preliminary anal-ysis of the data: When the impact approximation is valid and the difference between the singlet and triplet potentials is smaller than their sum, the phase difference, 6, is determined by the difference potential, V3 - V1
6(b) = 11 (V3-V1) dl. (2)
rel coli
Unfortunately, this relationship determines 6 as a function of impact parameter b - not scattering angle. To make a comparison of 6(0) and 6(b), and thereby extract the difference potential from our measurements, it is necessary to find a connection between the scattering angle and the impact parameter. We do this by assuming that the van der Waals potential, which is larger than the difference potential, causes all of the angular deflection. Using theoretical expressions for the van der Waals potential in alkalis4 (terms through 1/R 1 0 must be included), we have calculated the impact parameter asso-ciated with each scattering angle and have converted the experimentally determined 6(6) to a function of impact parameter. We have then used Eq. 2 to deduce the difference potential. The resulting difference potentials have been in good agreement with the results of Dalgarno and Rudge,5 even when the procedure is extended to smaller impact param-eters where the difference is comparable with the van der Waals potential (see Fig. V-3).
(V. ATOMIC RESONANCE AND SCATTERING)
It should be stressed that the analytical procedures outlined here are not sufficiently powerful to extract the singlet and triplet potentials from cross-section measurements. When quantum effects are important in a scattering process (as in the cases under
dis-cussion) there is no mathematical procedure for extracting the potentials from the cross sections; techniques exist only for calculating the cross sections from the potentials. We are completing a computer program to calculate cross sections quantum mechani-cally from the potentials (using partial wave analysis with the JWKB approximation for the phase shifts). We anticipate that the techniques described here will complement this program in two important respects: first, they will permit us to construct sensible guesses for the potentials from which the cross sections can then be computed exactly, and second, they will give us insight on how to adjust the guessed potentials when they fail to account for the experimental cross sections in all particulars.
One of the potential parameters that we hope to determine from our measurements is the van der Waals coefficient. Thus far, there has been only one experimental deter-mination6 of C6, which is a factor of two lower than theoretical estimates.4 We hope to determine C6 by analysis of rapid oscillations in the spin-exchange cross section which result from quantum-mechanical interference between positions of the triplet wave scattered from opposite sides of the target atom. (These oscillations have been observed in scattering of Na and K, not shown in the figures.) Knowing the correct value of the van der Waals coefficient is essential for more detailed determination of the potentials from our data, and its independent determination by absolute measurement of the cross section would be valuable.
2. Data Processing for Crossed-Beam Scattering System
7
The apparatus for measuring differential spin-exchange cross sections permits the determination of interatomic potentials at moderate distances (8-20 ao) in many new atomic systems. Since several thousand measurements are typically made for each system, the need for an automatic data-handling and reduction system was apparent. The requirements for the system are the following.
1. "Reading out" the two dual scalars.
2. Processing information (scattering angle, beam intensity, beam velocity, pres-sure, etc.) and instructions from operator.
3. Sorting out bad data, performing averages, estimating errors.
4. Correcting data for machine aberations and imperfections. This involves sorting out calibration runs from actual data.
5. Presenting data in usable form. 6. Possible analysis of the data.
We considered using a small on-line computer (such as a PDP-8) for this system, but concluded that the convenience of having quick results did not justify the expense of
time and money. Moreover, we felt that a small computer would prove inadequate for requirements 5 and 6.
The final system consisted of a Teletype (Model 33) and a solid-state scanner (Hammer NE-11) to interface the scalars with the teletype. The output consists of mul-tiple readings of the scalars, interspersed with comments typed in by the operator in a standard format. The typewritten output from the teletype is the "lab notebook," while the punched tape is converted to punched cards which are edited and submitted to the IBM 360 computer for processing. The conversion of the tape to IBM cards proved difficult because the teletype does not use the same 8-hole code as IBM. We solved this problem by writing a translating program for use on the PDP-1 computer.
The first run through the IBM 360 computer is made only to perform averaging and error analysis for data taken under identical experimental conditions (generally 5 to 10 pairs of points, with each pair consisting of a "beam on" and "beam off" average for 6 sec). This preliminary step is complicated because the noise is not random: Super-posed on the normal
T
counting statistics is noise from the hot-wire filament which tends to come in "clumps" of 10-1000 atoms. We found that selection criteria based on the geometric mean of the counting fluctuations (NN- ) and the observed fluctuationsav
;. (Ni-Na) came closest to reproducing our judgment about which points were
1
)a
affected by filament noise. The estimated error is the computed standard deviation increased slightly when points are discarded, or when the average of the differences differs from the difference of the averages (these may differ because different points may be thrown out in the three averaging processes).
After the preliminary analysis, the original data (approximately 2000 numbers) have been reduced in bulk by a factor of approximately five. The output from the first anal-ysis is now easily prepared for the final analanal-ysis by the insertion of control cards telling whether the data are "calibration" or "experimental," and indicating also the manner of display. The computer then corrects the data for machine errors (step 4) and plots the results with the aid of the Calcomp computer. Figs. V-i and V-2 are samples of the output from the Calcomp (retouched for publication).
3. Recirculating Alkali Oven
We have developed a recirculating alkali oven for use in scattering experiments when an intense jet beam is desired. The design is similar to the one described by Babitch and Bell, except that our beam is vertical and we recirculate at intervals rather than continuously.
Our recirculating oven is shown in Fig. V-4. All alkali atoms that do not pass through the hole in the skimmer condense on the inside of the water-cooled box (mul-tiple bouncing does not appear to be significant). To recirculate the condensed metal,
(V. ATOMIC RESONANCE AND SCATTERING)
steam is passed through the water-cooling lines; this melts the metal and permits it to drain back to the oven through the return tube. It takes less than 5 min to recirculate, and there appears to be no limit to the number of recirculations other than the slow con-sumption of alkali.
BEAM DIRECTION 0.250" EXIT HOLE
WATER- COPPER SKIMMER
COOLED ROD 0.080"
BOX
0.035"
NOZZLE
FRONT
HEATERS 5 /2" Fig. V-4. Recirculating alkali oven.
3/16" OD I i 0.015 WALL I I RETURN I HEATERS TUBE I - BACK I I LIQUID ALKALI
We have, thus far, used the oven to recirculate potassium. We observe a maximum flux of 2. 0 X 1018 atoms/sec sterad with an alkali-vapor pressure of 5 mm behind the nozzle. The jet action limited the velocity distribution Av/v to 29% (FWHM). Under these conditions alkali consumption was 2. O0 gm/hr (-1 gram is necessary to wet all sur-faces of the box and plug up the recirculating tube).
We feel that the design could be improved by using a cold skimmer (to reduce scat-tering near the skimmer), and by reducing the diameter of the recirculating tube to 1/8" (to insure plugging of the return line after recirculation and to reduce heat loss from the oven).
D. E. Pritchard, G. N. Carter,
F. Y. Chu, D. Kleppner References
1. D. E. Pritchard, G. N. Carter, F. Y. Chu, and D. Kleppner, Quarterly Progress Report No. 88, Research Laboratory of Electronics, M. I. T., January 15, 1968, p. 15; D. E. Pritchard, D. C. Burnham, and D. Kleppner, Phys. Rev. Letters 19,
1363 (1967).
2. E. Hundhausen and H. Pauly, Z. Physik 187, 305 (1965).
4. For the C6, the leading term, we use A. Dalgarno and W. D. Davison, Mol. Phys. 13,
479 (1968). For C8/C 6 we use W. D. Davison, J. Phys. B [Ser. 2] (Proc. Phys.
Soc.) 1, 139 (1968). For C1 0/C 6 we use P. R. Fontana, Phys. Rev. 123, 1865 (1961).
5. A. Dalgarno and M. R. H. Rudge, Proc. Roy. Soc. (London) A286, 519 (1965). 6. U. Buck and H. Pauly, Z. Physik 185, 155 (1965).
7. D. C. Burnham, D. E. Pritchard, and D. Kleppner, Appl. Phys. Rev. 86, 19 (1967); Quarterly Progress Report No. 86, Research Laboratory of Electronics, M. I. T., July 15, 1967, p. 19.
8. D. Babitch and C. M. Bell, Quarterly Progress Report No. 85, Research Laboratory of Electronics, M. I. T. , April 15, 1967, pp. 1-4.
B. MAGNETIC MOMENT OF THE PROTON
1. Introduction
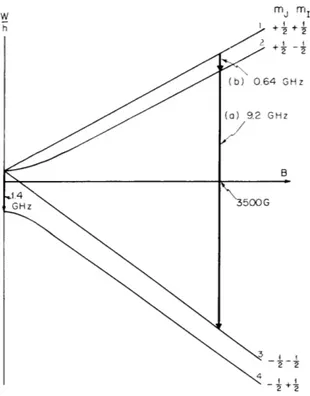
The object of this work is to measure the proton g-factor, in terms of the electron g-factor, to a precision of one part in 108. The experiment has been described in pre-vious reports., '2 Briefly, the idea is to measure the frequencies of the electron and proton spin-flip transitions in atomic hydrogen in a 3500-G magnetic field. This is accomplished by using a hydrogen maser operating in a very homogeneous magnetic field. The maser is operated as a narrow-band amplifier at the frequency of the electron
w m I m h + + ' (b) 0.64 GHz (a) 9.2 GHz B -1.4 GHz 3500G 22 4
(V, ATOMIC RESONANCE AND SCATTERING)
spin-flip transition. The output level of the maser amplifier changes when the proton spin-flip transition is stimulated. (See Fig. V-5.) This double-resonance technique enables the precise determination of the two resonant frequencies, from which the g-factor ratio can be calculated by using the Breit-Rabi formula. The limiting factor in this work is the precision to which the proton frequency is known, since the proton is coupled to the electron spin 40 times more strongly than to the external field. Thus it is necessary to measure the proton frequency to a precision 40 times higher than that desired for the g-factor ratio.
2. Data Acquisition Methods
A newly developed automatic data-accumulation system has been described in a pre-vious report.2 This system was developed for cw observation of the double resonance, with a feedback system for locking the magnetic field (and hence the electron transition frequency) to an initial value. The RF power for stimulation of the proton transition is digitally swept in frequency across the proton resonance, and its effect on the output of the maser amplifier is recorded digitally. In order to observe the double resonance by this method, it is necessary to keep the field locked within a small fraction of the elec-tron linewidth.
Thus far, this system has been less satisfactory than was anticipated, primarily because of low-frequency (10-100 Hz) jitter in the magnetic field. This jitter is com-parable to the electron linewidth H e) 10 and makes precise locking of the
Ho
field impossible.
The source of this jitter has not been isolated, but it appears to stem from noise in the ambient field in the laboratory. It is not due to thermal fluctuations, for, although the magnetic field is very temperature-sensitive, it has a thermal time constant of 4 days, and is also extremely well temperature-regulated. Microphonic effects seem to be ruled out also, for the entire apparatus is "floating" on inflated air mounts, and the observed signal is quite insensitive to vibrations in the room.
A solution to the field-jitter problem might be to place a damping coil in the magnet L
gap. The coil must have a time constant
7
- that is large compared with the period of the jitter. Ideally, the coil would consist of a superconducting loop; however, asimple copper loop with a cross section of approximately 1 in.2 should give a long enough time constant (~0. 05 sec) to be useful. We intend to try such a scheme.
In the meantime, we have developed an alternative data-accumulation system that is relatively insensitive to field jitter. This is a version of the pulse technique used in the early stages of this experiment. 3 In this technique the atoms are given a 900 pulse at the electron transition, and the free-induction ringing is observed [Fig. V-6 (upper)].
If the proton transition is then stimulated, atoms are removed from the radiative state, thereby quenching the ringing signal [Fig. V-6 (lower)]. The double-resonance line
Fig. V-6. Free precession maser signals: (upper) electron resonance only; (lower) double resonance (periodic quenching results from stimulation of proton transition). Time scale: 1 msec/division.
can be traced by observing a rectified ringing signal as the frequency is swept. A boxcar integrator is gated "on" for approximately two decay times following the pulse, and several pulses are averaged to yield the integrated output at each frequency point. (The same digital sweeping and data-recording equipment that was used in the cw method mentioned above is also employed here.) This pulse method has the advantages over the cw method of higher signal-to-noise ratio and of relative insensitivity to frequency jitter. The latter results from taking a time average of a rectified sinusoidal signal, which is relatively insensitive to small frequency modulations.
3. Results
The observed signal has been greatly improved in recent weeks. Modifications in the storage-bulb geometry and increased magnetic field homogeneity have increased the decay lifetime from 2 msec to 4 msec, corresponding to an electron linewidth of
-8
80 Hz (a fractional linewidth of 1 x 10-). Improvements in the atomic hydrogen source have increased the atomic flux by a factor of 5, thereby resulting in a corresponding gain in signal-to-noise. (Present S/N [power] z 600.)
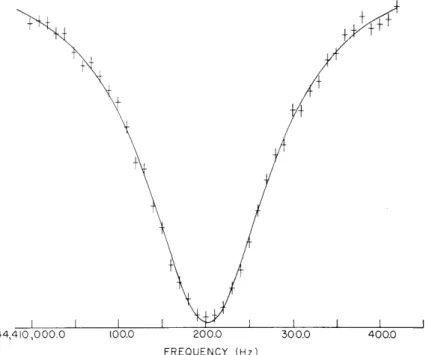
Recent data have been taken by the pulse technique described above. Some 20 to 40 digital data points are taken in each sweep across the line, and a 4-parameter least-squares fit is done to determine the best-fitting Lorentzian curve. A typical set of points and the best fit to them is shown in Fig. V-7. The proton double-resonance line-width for this observation method is limited by the electron lineline-width (80 Hz). Signal-to-noise of the proton line is greatly improved by power broadening to 150-200 Hz, and most of our data are taken at these levels. The center frequency for the proton transi-tion, V12, can be determined for a single sweep within a standard deviation of 1-2 Hz.
(V. ATOMIC RESONANCE AND SCATTERING)
FREQUENCY (Hz)
Fig. V-7. Typical trace of proton (double-resonance) line with with best-fit Lorentzian curve.
The g-factor ratio is computed from v12 and v23 (the electron resonance frequency). There is no problem in measuring v2 3 to within 100 Hz, which is sufficient precision that uncertainties in v23 do not limit the precision of the g-factor ratio.
4. Systematic Effects
Present efforts are directed to searching for and eliminating systematic errors. Data taken during the course of an evening seem to show small nonrandom patterns of behavior, and some of the lines seem to be slightly asymmetric.
The major effect that we have found is a slight dependency on magnetic field con-figuration. If the field is distorted, by means of a small coil inserted into the magnet, shifts in g /g p of up to 1. 5 X 10- 7 have been observed. It can be shown4 that shifts in
a resonance line of up to a linewidth can occur in a motional averaging system (such as atoms sampling different values of a magnetic field) if there exist small regions of extreme field value, where radiating atoms can accumulate phase rapidly. We have exactly this sort of situation, for, although the field is quite homogeneous (2. 5 X 10- 7) in the spherical bulb region, larger inhomogeneities are found in the neck by which atoms enter and leave the bulb. The atoms spend only 17o of the time in the neck, but can accumulate phase rapidly there, and thus give rise to a shift.
of high inhomogeneity. This would be the case if a collimator were placed immediately at the bulb entrance. The bulb storage time T would not be decreased (in fact, it could be increased), and atoms that exit from the collimator into the inhomogeneous field
region would be pumped away before significant phase accumulation could occur. 5. Future Plans
We have designed and are awaiting construction of the collimated storage bulb described above, and the field damping coil, which has also been mentioned. We are also studying ways of optimizing the flux of atoms into the bulb, and hope that the maser can be made to oscillate. Should this occur, an extremely high-precision measurement-8
of gs /gp would be achieved. In any case, we are hopeful that our goal of 1 X 10⁸
pre-cision can be obtained in the next few months.
P. F. Winkler, F. G. Walther, D. Kleppner References
1. Quarterly Progress Report No. 84, Research Laboratory of Electronics, M. I. T., January 15, 1967, p. 27.
2. Quarterly Progress Report No. 89, Research Laboratory of Electronics, M. I. T., April 15, 1968, p. 1.
3. T. Myint, D. Kleppner, N. F. Ramsey, and H. G. Robinson, Phys. Rev. Letters 17, 405 (1966).
4. D. Brenner, Ph.D. Thesis, Harvard University, 1968 (unpublished).
C. SUPERCONDUCTING PARTICLE COUNTER
1. Introduction
Superconducting thin films have been successfully employed as efficient radiant energy detectors.1 - 3 These have been bolometer type integrating devices, however, which are relatively insensitive compared with a single-particle counter such as the phototube. We are trying to develop a new superconducting switching device that is triggered by an energy pulse of approximately 1 eV or less. This could be provided
by the absorption of an incident infrared photon or by the energy released because of chemical reaction of an incident atom with a suitable coating material. For example, when a hydrogen atom is incident on the surface of the switching element which has chlorine condensed on it, the following reaction is typical:
H + CL 2 - HC1 + CL + 2 eV.
Since the thermal relaxation time for thin films can be very short (we have observed relaxation time of less than 50 nsec for 1000 A Sn film), the device would increase the
(V. ATOMIC RESONANCE AND SCATTERING)
sensitivity of detecting atomic hydrogen and infrared photons by orders of magnitude with numerous applications in atomic physics, spectroscopy, astronomy, and a host of other fields.
2. Principle of Operation
The switch consists of a superconducting thin film in thermal contact with an insu-lating substrate. An incident particle transfers its energy to the film at a point from which the heat is transported by diffusion of normal electrons. The initial local tem-perature rise may, however, be large enough to drive a portion of the film normal. Under static conditions, this normal volume would be impossible to detect, since any bias current would detour around it. We shall show, however, that, at the time scale
of interest, inductive effects are sufficiently large to cause dissipation by the bias cur-rent in the normal volume. The Joule heat that is produced adds to the original heat pulse, and a regenerative process can occur which enlarges the normal volume and
causes a further dissipation of energy. The process will continue until it is externally terminated, or the entire film is driven normal. A sensing circuit detects the event and resets the film.
a. Power Regeneration
If a portion of the superconducting thin film is driven normal by an incident particle the bias current will detour about it. For superconducting thin films the current flow is essentially two-dimensional. The surface current density distribution, j(r, 0), can be represented by the superposition of a uniform current and a line dipole field
jr =-j
cos Ojr
Oinside j normal region (1)j = jo sin o
2 a
J= cos
r
2 outside normal region (2)
a
S= -o sin
r
where jo is the applied surface current density, and a is the radius of the normal disc. The energy stored on account of this current distribution is
W stored TT - r12 ds ds 1 2' (3)
s
be evaluated to give 3.2=
W z p a 2 (1 + small correction terms).
stored o o
Initially, the inductive effect will maintain the current to flow through the normal area with a power dissipation given by
P =)V V
E2 dv = 0 dV = Tj 2oa2 ,
where V is the volume of the normal region, J is the volume current density, a is
n 0
the normal conductivity of the material, and d is the the thickness of the film.
The current dissipates energy while it changes its direction. The rate of change of stored energy is P = W from which it follows that the time constant, T, for detour of the current is
T = o- oad.
For t <<- , the power dissipated is approximately constant. For t > T, the total energy dissipated is Wdidis s = PT = Wstoredstored'
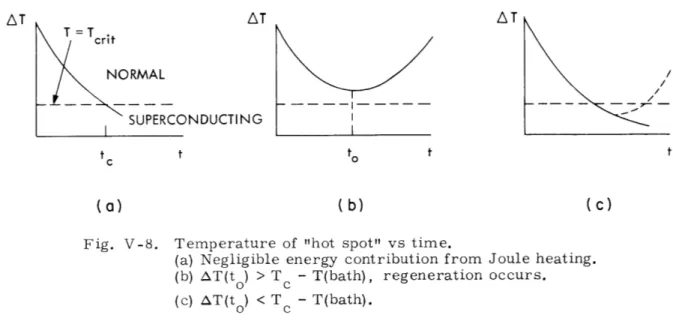
b. Growth of the "Hot Spot"
From the initial "hot spot," heat spreads radially by diffusion. takes place the temperature will fall as shown in Fig. V-8a. Here temperature deviation, AT = T - T(bath), is shown as a function of
(b)
If no regeneration the instantaneous time. At time t thec
T=T crit crit NORMAL / / / / SUPERCONDUCTING
(a)
(c)
Fig. V-8. Temperature of "hot spot" vs time.
(a) Negligible energy contribution from Joule heating. (b) AT(to) > Tc - T(bath), regeneration occurs. (c) AT(t ) < Tc - T(bath).
(V. ATOMIC RESONANCE AND SCATTERING)
temperature falls below the critical value, Tc, and the normal volume reverts to the superconducting state.
When a bias current is present, the situation shown in Fig. V-8b can occur. The initial heat pulse diffuses radially outward and the temperature starts to fall. But if Joule heating caused by persistent flow of the bias current through the normal region is sufficient, the temperature will start to rise. The temperature stops falling at time t and, if AT(to) > Tc - T(bath), regeneration will occur and the "hot spot" will grow.
Alternatively, if the situation is as shown in Fig. V-8c, with AT(to) < Tc - T(bath), then the temperature will continue to fall, since the film will revert to the superconducting state before regeneration can occur.
These ideas can readily be made quantitative. Consider a normal region of volume V. The energy density decreases because of radial flow in the film, that is, to increase in V, we can neglect heat leakage to the substrate during the short times of interest, while at the same time it increases due to dissipation by the bias current. In estimating the last effect, we shall assume that T (that relaxation time for exclusion of the bias
current) is small compared with to, so that the energy dissipated has its maximum value, numerically equal to the stored energy, Eq. 4.
If the initial energy introduced by the particle is Eo, then the energy density is
E W
W + dis (7)
V V V
and the average temperature rise is given by
W E W
W o dis
CV CV CV (8)
where C is heat capacity per unit volume of the film. The rate of change of temperature then is
d (AT) o d V1 1 d is
d (A T) = d + d ( d (9)
dt C dt V Cdt V
The volume V = ira2d, grows by radial diffusion, where
a = fvt, (10)
with f the mean-free path, and V the average velocity of the normal electrons. Hence, from Eqs. 4, 9, and 10,
.2
d 1 Eo ___
(A T) (11)
d
The temperature stops falling when -(AT) = 0, at to, given by
0 o
to = (12)
and the average temperature rise at to is
1/3T(to)
/
AT(t 3 \40 E 4 ) (13)
If the transition width of the film is 6T, then the requirement for regeneration is AT(to) > ST.
3. Experimental Progress
Our initial efforts have been directed toward developing instrumentation to observe the regeneration effect in thin films. To facilitate this, we have used a high-energy alpha particle source to provide the triggering particles. We shall describe in more detail our initial efforts, which have been successful.
The apparatus consists of standard glass helium dewars with pressure control and electronic temperature regulation.
The Sn films used in the experiment are vacuum deposited on sapphire substrates, 1/16 in. thick, cooled to liquid nitrogen temperature. The background pressure in the evaporator is typically 3 X 10⁻⁷ mm Hg, with the pressure rising to 5 X 10⁻⁶ mm during deposition. The dimensions of the films are 1 cm long X 300 4 wide X 1000 A thick. The
electrical resistance of the normal film at liquid helium temperature is typically 20 2. The measured transition width is typically 60 mdeg when the measuring current is
0.5 mA. This width is probably due to irregularities near the edges of the film. After the film is mechanically trimmed with a diamond tool to a width of ~50 L, the resistance and transition width are typically 55 2 and 15 mdeg, respectively.
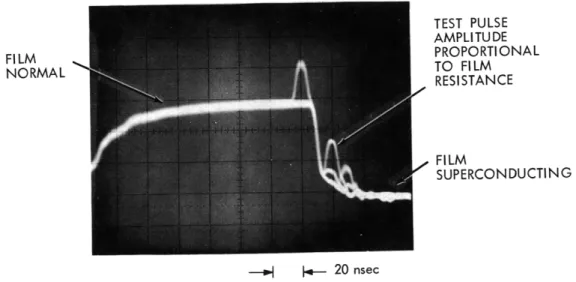
The thermal relaxation time of the film has been measured with a double current pulse method. The first pulse delivers enough current to drive the film completely normal. This is followed by a sensing pulse that can be variably delayed with respect to the first pulse and is such that it gives a detectable signal (when the film is normal) without appreciably disturbing the state of the film. The trace of a multiple-exposure photograph shown in Fig. V-9 (horizontal scale: 20 nsec/cm) is a typical measurement. It indicates a thermal relaxation time of less than 50 nsec for the film.
In the present tests the bias current is turned off as soon as the film goes normal, and is automatically reset in ~1 psec, which gives the film ample time to
241
(V. ATOMIC RESONANCE AND SCATTERING) TEST PULSE AMPLI TU DE FILM PROPORTIONAL NORMAL TO FILM RESISTANCE SUPERCONDUCTING -~ - 20 nsec
Fig. V-9. Trace from an oscilloscope photograph of the resistance of a super-conducting film that is driven normal by a current pulse. The current pulse is turned off at the indicated time, and the resistance of the
film is monitored by a small delayed pulse. (Multiple-sweep photo-graph with varying delay times.)
It should be pointed out that because the range of the particles is large compared with the film thickness, only approximately 20 keV is delivered to the film.
The parameters of the film are as follows: d = 1000 A a = 3. 6 X 10⁷ mho/m Jo = 160 A/m 5 v= 4 X 10 m/sec C = 1. 4 X 10- 3 J/cm3/°K (Shiffman4).
The time constant for exclusion of current from the normal spot is calculated to be -10
T = 10 sec, and the time at which the temperature starts to increase is calculated to be to = 7 X 10- 9 sec, both of which are consistent with the assumptions in the proceeding analysis.
Equation 13 then predicts that a 20-keV particle will yield a temperature rise AT = 14 mdeg. The observed transition width is 6T = 15 mdeg, which means that pulses should be detectable when the film is maintained close to the critical temperature. Our observations confirm this.
Although it may seem a long way to go from detecting a 20-keV particle to detecting a 1-eV particle, Eq. 13 indicates that this may indeed be feasible. A figure of merit
is (Eoj4); if this product is kept constant, AT(to) is unaltered. Hence, an increase of 10 in the current density would suffice to detect 1-eV particles with the present arrange-ment. Even this may not be necessary, since a decrease in the transition width by a factor of, say, 5 would lead to a decrease in minimum detectable energy by a factor of 125.
Our immediate plans are to pursue both of these possibilities, and to attempt to detect low-energy particles.
M. T. Myint, D. Kleppner References
1. D. H. Andrews, W. F. Bneksch, Jr., W. T. Ziegler, and E. R. Blanchard, Rev. Sci. Instr. 13, 281 (1942).
2. D. H. Martin and D. Bloor, Cryogenics 1, 159 (1961). 3. C. L. Bertin and K. Rose, J. Appl. Phys. 39, 2561 (1968).
4. C. A. Shiffman, et al. , Rev. Mod. Phys. 36, 127 (1964). (Because of a scale error,