Publisher’s version / Version de l'éditeur:
Analytical Chemistry, 82, 9, pp. 3922-3928, 2010-04-02
READ THESE TERMS AND CONDITIONS CAREFULLY BEFORE USING THIS WEBSITE. https://nrc-publications.canada.ca/eng/copyright
Vous avez des questions? Nous pouvons vous aider. Pour communiquer directement avec un auteur, consultez la
première page de la revue dans laquelle son article a été publié afin de trouver ses coordonnées. Si vous n’arrivez
Questions? Contact the NRC Publications Archive team at
[email protected]. If you wish to email the authors directly, please see the first page of the publication for their contact information.
Archives des publications du CNRC
This publication could be one of several versions: author’s original, accepted manuscript or the publisher’s version. / La version de cette publication peut être l’une des suivantes : la version prépublication de l’auteur, la version acceptée du manuscrit ou la version de l’éditeur.
For the publisher’s version, please access the DOI link below./ Pour consulter la version de l’éditeur, utilisez le lien DOI ci-dessous.
https://doi.org/10.1021/ac100532r
Access and use of this website and the material on it are subject to the Terms and Conditions set forth at
Accurate and precise determination of silver isotope fractionation in
environmental samples by multicollector-ICPMS
Luo, Yan; Dabek-Zlotorzynska, Ewa; Celo, Valbona; Muir, Derek C. G.;
Yang, Lu
https://publications-cnrc.canada.ca/fra/droits
L’accès à ce site Web et l’utilisation de son contenu sont assujettis aux conditions présentées dans le site LISEZ CES CONDITIONS ATTENTIVEMENT AVANT D’UTILISER CE SITE WEB.
NRC Publications Record / Notice d'Archives des publications de CNRC:
https://nrc-publications.canada.ca/eng/view/object/?id=7826786a-6ed4-49b4-b8a4-46e9e821ae06 https://publications-cnrc.canada.ca/fra/voir/objet/?id=7826786a-6ed4-49b4-b8a4-46e9e821ae06
Environmental Samples by MC-ICP-MS
Yan Luo1, 2, Ewa Dabek-Zlotorzynska2, Valbona Celo2, Derek C. G. Muir3and Lu Yang*1
1: Chemical Metrology, Institute for National Measurement Standards, National Research Council Canada, Ottawa, Ontario, Canada, K1A 0R6.
2: Analysis and Air Quality Section, Air Quality Research Division, Atmospheric Science and Technology Directorate, Science and Technology Branch, Environment Canada, Ottawa, Ontario, Canada, K1A 0H3.
3: Aquatic Ecosystem Protection Research Division, Environment Canada, Burlington, Ontario, Canada L7R 4A6.
Abstract
High precision silver isotope ratios in environmental samples were determined by multicollector inductively coupled plasma mass spectrometry (MC-ICP-MS). Purification of Ag from sample matrices was performed by a two stage tandem column setup with use of anion and cation exchange resin, sequentially. It was found that a 1 % HNO3and 3 % HCl was efficient to
stabilize Ag in the final purified sample digests prior to MC-ICP-MS determination. Pd at 2 µg g -1was added to both sample and Ag standard solution as a common doping matrix as well as an
internal standard for mass bias correction. Mass discrimination and instrument drift were corrected by a combination of internal normalization with Pd and standard-sample-standard bracketing, without assuming identical mass bias for Pd and Ag. NIST SRM 978a (silver isotopic standard reference material) was used for method validation and subjected to column separation and sample preparation processes. A value of -0.003±0.010 ‰ for 107/109Ag (mean and 2SD,
n=4) was obtained, confirming accurate results can be obtained using the proposed method. To the best of our knowledge, this is the first report on 107/109Ag variations in
environmental samples. Significant differences in Ag isotope ratios were found among NIST SRM 978a standard, sediment CRM PACS-2, domestic sludge SRM 2781, industrial sludge 2782 and the fish liver CRM DOLT-4. The sediment CRM PACS-2 has very small negative 107/109Ag value of -0.025±0.012 ‰ (2SD, n=4). The domestic sludge SRM 2781 has a negative
107/109Ag value of -0.061±0.010 ‰ (2SD, n=4), whereas industrial sludge SRM 2782 has a
positive 107/109Ag value of +0.044±0.014 ‰ (2SD, n=4), which may indicate the contribution of
Ag from different anthropogenic inputs. DOLT4 has much larger negative value of -0.284±0.014 ‰ (2SD, n=4), possibly caused by biological processes. These observations confirm
that Ag isotope fractionation may provide a useful tool for fingerprinting sources of Ag in the environment and for studying a wide variety of chemical and biological processes in nature. High precision of better than ±0.015 ‰ (2SD, n=4) obtained in real sample matrices makes the present method well suited for monitoring small Ag isotope fractionation in nature.
Key words: Isotope ratios, MC-ICP-MS, Isotopic fractionation, Ag, Biological tissue, sediment, sludge.
INTRODUCTION
Silver is a well-known environmental pollutant and its environmental implications are of great concerns especially since new technologies, such as recent advances in nanotechnologies, have rapidly increased nanosilver (n-Ag) usage in consumer products1, ranging from socks,
paints, bandages, food containers and even food supplements that claim to include some form of n-Ag1-2. The increased release of n-Ag into the environment could pose potential toxic effects on
aquatic organisms and may have an effect on the human life1-2, consequently Ag has been
defined as a high priority toxic metal in risk assessment studies by Environment Canada under Chemical Management Plan (CMP) monitoring and surveillance program list3. On the other side,
little is known about the behavior, exposure routes and fate of n-Ag after being released into the environment. As a result, there is an important need to develop new approaches for fingerprinting, tracking and understanding the sources of silver in the environment.
Isotope fractionation of non-traditional stable isotopes can be used as a valuable tool for studying the biogeochemical cycles of metals4. We therefore propose to use high precision of Ag
isotope ratio analysis by MC-ICP-MS as a novel approach for fingerprinting sources of this element in the environment and for studying a wide variety of chemical and biological processes relating to Ag in nature. Notably, silver isotopic composition in the environment has not been studied in depth compared to other heavy metal pollutants such as Hg5-19. Only recently, Yang et
al.20 reported up to +0.83‰ level variations in 107Ag/109Ag ratios in several Ag fortified
consumer products. Such Ag isotope variations suggested that Ag isotopic composition may be a useful tracer for studying its various chemical and biological processes in nature. However, the study of Yang et al.20was limited to a few Ag fortified consumer products using MC-ICP-MS
environmental samples are urgently required.
Previous studies with use of MC-ICP-MS have reported precisions of Ag isotope ratios in geological samples in a range of 0.13~2‰21-22to 0.05‰ by Schonbachler et al23-24. The study of
Yang et al. also achieved a similar precision of 0.05‰ for Ag fortified consumer products20.
However, such precision might not be enough to distinguish small fractionation of Ag isotopes in the environment. The purpose of this work was to develop a more precise and optimized method for the accurate and precise determination of Ag isotope ratios in a few typical environmental sample matrices including a biological tissue, sediment and sludge to prove the concept. In this study, mass discrimination and instrument drift are corrected for by implementation of a combination of internal normalization with Pd and standard-sample-standard bracketing, without assuming identical mass bias for Pd and Ag, similar to previous used method20.
EXPERIMENTAL SECTION
Instrumentation. A Thermo Fisher Scientific Neptune (Bremen, Germany) MC-ICP-MS equipped with 9 Faraday cups and a combination of cyclonic and Scott-type spray chambers with a PFA self-aspirating nebulizer MCN50 (Elemental Scientific, Omaha, NE, USA) operating at 50 µl min-1 was used for all measurements. The plug-in quartz torch with sapphire injector was
fitted with a platinum guard electrode. Low resolution mode was used in this study with Rpower(5, 95%) 300. Optimization of the Neptune was performed as recommended by the manufacturer;
typical operating conditions are summarized in Table 1.
A quadrupole ICP-MS DRC ELAN6100 (PerkinElmer Sciex, Thornhill, Ontario, Canada) or a sector field ICP-MS Element2 from Thermo Fisher Scientific (Bremen, Germany) was used for a semi-quantitative analysis. A Digiprep Jr block heater and 50 mL volume Teflon tubes (SCP Science, Quebec, Canada) were used for evaporation of samples. A Thermo IEC
Centra CL3 (Thermo Fisher Scientific, North Carolina, USA) was used for centrifuging samples. Empty 2 mL columns (part number: AC-141-AL) and 25 mL extension funnels (part number: AC-120) were purchased from Eichrom Technologies LLC (Darien IL, USA).
Reagents and Solutions. Reagent grade nitric and hydrochloric acids (Fischer Scientific Canada, Ottawa, Ontario, Canada) were purified in-house prior to use by sub-boiling distillation of reagent grade feedstock in a quartz still. Environmental grade HF and H2O2 was purchased
from Anachemia Science (Montreal, Quebec, Canada). High-purity (18 M cm) de-ionized water (DIW) was obtained from a NanoPure mixed bed ion exchange system fed with reverse osmosis domestic feed water (Barnstead/Thermolyne Corp, Iowa, USA). SRM 978a (Ag isotope) in AgNO3 form was obtained from National Institute of Standards and Technology (NIST,
Gaithersburg, MD, USA). A 1000 µg g-1 stock solution of SRM 978a Ag was prepared by its
quantitative dissolution in 2 % (v/v) HNO3 solution. A 3000 µg g-1 stock solution of Pd was
prepared by quantitative dissolution of high purity Pd metal (Johnson Matthey Plc) in a few mL HNO3 and diluted with DIW. A 800 µg g-1 Pd working standard solution was prepared by
quantitatively dilute suitable amount of stock solution in 2 % (v/v) HNO3. AG1-X8 anion
exchange resin (100-200 mesh) and AG50W-X8 cation exchange resin (200-400 mesh) were obtained from Eichrom Technologies LLC (Darien IL, USA).
National Research Council Canada (NRCC, Ottawa, Canada) dog fish liver CRM DOLT-4 and harbour sediment CRM PACS-2 were used for Ag isotope ratio determination. Industrial sludge SRM 2782 and domestic sludge SRM 2781 were purchased from National Institute of Standards & Technology (Gaithersburg, MD, USA).
Sample digestion. Sample preparation was undertaken in a class-100 clean room. For sediment CRM PACS-2, 0.25g sub-samples were weighed into individual pre-cleaned Teflon digestion
vessels. Each 8 mL of HNO3, 1 mL of HF and 0.5 mL H2O2were added to each vessel. Two
procedure blanks were also prepared concurrently. The sealed vessels were heated in a Milestone microwave oven operated under the following conditions: 10 min at 50 oC and 500 W; 10 min at
140 oC and 500 W; 15 min at 180 oC and 600 W; and 45 min at 210 oC and 650 W. After
cooling, the caps were removed and 6 mL of 5 M HCl were added to each vessel. The vessels were placed on a hot block and heated at 120 oC for 1h to avoid any AgCl precipitates in the
solution under excess amount of Cl-1concentration. Then the contents were transferred into 50
mL Teflon tubes and placed on a hot block in a class-10 fume hood and heated at 120oC until
dryness. Following addition of 1 mL HCl, the contents were heated at 105oC until dryness. The
residues were redissolved in 5 mL of 5 M HCl with heating for 30 minutes at 85oC followed by
dilution with DIW to 50 mL which resulted in a final concentration of 0.5 M HCl. The solutions were sonicated for 30 minutes to ensure complete dissolution followed by centrifugation for a few minutes before loading the supernatant onto the column for matrix separation.
Fish liver CRM DOLT-4 and two sludge SRMs were prepared similarly as described above with exception of HF was not used for DOLT-4. Since both sludge SRM samples contain high concentration of Ag, 0.050 g sub-samples instead of 0.25 g were used.
Column separation. Anion exchange columns containing 1.25 mL each of AG1-X8 resin and cation exchange columns containing 1.80 mL each of AG50W-X8 resin were cleaned and preconditioned with adequate acids as detailed in Table 2. After the sample loading onto the anion columns in 0.5 M HCl, the columns were rinsed each with 5 x 10 mL 0.5 M HCl, 3 x 10 mL 0.1 M HCl followed by 3 x 5 mL of 0.001 M HCl. The rack holding anion exchange columns were then placed on the top of the other rack holding cation exchange columns (Figure 1). To elute anion exchange columns and at same time to load and elute cation exchange columns, 9 x 5
mL each 1 M HNO3were passed through each set of tandem column and collected into 50 mL
Teflon tubes. The collected fractions were dried on a hot plate at 120oC to dryness. The whole
tandem column separation procedure was repeated one more time. The final collected total 45 mL of 1 M HNO3 fractions were dried on a hot plate at 120 oC to dryness. The residues were
redissolved in a mixture of 0.05 mL HNO3, 0.15 mL of HCl and 0.3 mL DIW at 105oC for 30
minutes followed by dilution to 5 mL with DIW prior to MC-ICP-MS measurements. An aliquot of 0.50 mL each of these purified solutions was taken out for total semi-quantitative analysis to check left over matrix elements. The remaining purified solutions were each spiked with 0.0113 g of 800 µg g-1Pd standard solution prior to MC-ICP-MS ratio determination.
Analysis Procedure and Data Processing. Samples and standards were introduced into the plasma using self-aspiration nebulizer at 50 μL min-1. Intensities of Ag and Pd isotopes obtained
(shown in Table 1) from a procedure blank solution in 1 % (v/v) HNO3and 3 % (v/v) HCl were
subtracted from all samples and standards. Samples were introduced in the sequence of SRM 978a-sample-SRM 978a. A static run was employed to collect 104Pd, 105Pd, 107Ag and 109Ag
isotopes on Faraday cups at L3, L2, Central, and H2 positions, respectively. Data acquisition parameters are summarized in Table 1. Five measurements were made on each test sample solution. A bracketing standard solution of SRM 978a in 1 % (v/v) HNO3and 3 % (v/v) HCl was
prepared for each sample so as to contain similar concentrations of Ag and Pd.
Major matrix elements and elements which could pose potential polyatomic interferences on Ag and Pd isotopes were assessed in the samples using a quadrupole ICP-MS or a sector field ICP-MS and semi-quantitative analysis mode.
RESULTS AND DISCUSSION
achieved using an integration time of 4.194 s acquiring data with 10 cycles and 5 blocks within a reasonable measurement time. One measurement requires about 7 min, including uptake and washout, consuming approximately 0.35 mL of sample. In this study, a high performance skimmer cone for Neptune was used to improve sensitivity for high precision Ag isotope ratio measurements in generally low Ag contained environmental samples.
As detailed in a recent review25, for accurate and precise isotope ratio determination it is
essential to correct for mass discrimination observed in MC-ICP-MS. It is a common practice to use internal standard for mass bias correction of analyte isotope ratios. However, assuming identical mass bias correction factors for both analyte (e. g. Ag) and internal standard (e. g. Pd) used in previous studies21-24 is both unnecessary and incorrect20, 25. Thus, a mass bias correction
approach based on internal normalization with Pd in combination with standard-sample-standard bracketing used previously for Ag isotope ratio determination in commercial products20 was
adopted here. However, the isotope pair of 104Pd/105Pd instead of 106Pd/108Pd which used
previously20was chosen in this study to avoid any possible 106Cd interference on 106Pd and 108Cd
interference on 108Pd due to a small amount of Cd left over in the purified sample digests after
column separation. The “certified” value of 1.07638 for 107Ag/109Ag in SRM 978a was used to
obtain mass bias corrected 104Pd/105Pd ratios in two adjacent standard solutions of SRM 978a and
their average value was then used to calculate mass bias corrected Ag isotope ratios in the samples based on an exponential law for mass bias correction26used in the software of Neptune:
f j i T m m m R R ( ) (1)
where subscripts m and T indicate measured and mass bias corrected ratios, respectively; f is the mass bias correction factor; miand mjare the absolute masses of the isotopes of interest.
For comparison purpose, a δ-value scale established relative to a common standard solution is used for this study.
‰ 1000 1 109 / 107 std T sample R R Ag T (2) where sample T
R
and std TR
are mass bias corrected (or “true”) ratios in the sample and standard, respectively. Based on this approach, a δ107/109Ag of -0.002±0.009‰ (mean and 2SD, n=5) in a100 ng g-1solution of SRM978a containing 2 µg g-1Pd was obtained, confirming accurate and
precise Ag ratio determination using present mass bias correction method.
Tandem column matrix separation. In addition to instrumental mass bias, sample matrix could have large effects on accurate ratio measurements. To properly correct for these effects, separation of analyte from sample matrix is generally necessary20, since in practice it is
impossible to match all matrix elements between a sample and a standard solution. It is now widely recognized that non-quantitative recovery of analyte as a result of matrix separation may induce isotope fractionation27-28, and quantitative (above 95 %) recovery of analyte is thus
required to ensure accurate results.
During our preliminary studies, an Ag standard solution at 500 ng g-1 was used to test
recoveries of anion and cation exchange columns, respectively. It was found that eluting the anion exchange column with 1 M HNO3 instead of 0.5 M HNO3 used previously21-24
significantly decreased the total volume of the acid solution needed to quantitatively elute Ag from this column. In addition, quantitative recovery of Ag from the cation exchange column was obtained when 1M HNO3 was used for loading and elution. Thus 1M HNO3 was used for all
preparation, a tandem column setup was applied (Figure 1), after sample loading and rinsing of the anion exchange column separately (see Table 2). This way the eluent from the anion exchange column was directly dripped into the cation exchange column for loading and eluting simultaneously. Based on a 0.25 g sub-sample for a PACS-2 digest, a 25 mL of 1M HNO3 is
enough to quantitatively elute Ag from the tandem column setup. However for samples containing higher concentration of Ag such as SRM 2781 (98±8 µg g-1), a 45 mL of 1 M HNO
3
is needed for complete elution of Ag from the columns. Thus, a 45 mL of 1M HNO3was used in
all subsequent experiments. The present tandem column separation setup allows a batch separation (usually 12 samples at a time) to be finished within two days, an improvement compared to three days required in previous studies23-24.
Initially, the collected 1 M HNO3eluent (45 mL) was used for Ag ratio determination and
for TotalQuant measurements to check the efficiency of matrix separation using tandem column set up. However, a loss of Ag signal in a collected 45 mL 1 M HNO3 was observed as this
solution aged and the Ag signal completely disappeared after the solution was left stand for two weeks. This is likely due to a trace amount of Cl-1 present in this solution from the 0.001 M HCl
used for rinsing of anion exchange column and thus precipitates Ag out from the solution with time. To overcome this, the collected Ag fraction in 45 mL of 1 M HNO3was heated to dryness
at 120 oC. The residues were then redissolved in a mixture of 0.05 mL HNO
3, 0.15 mL of HCl
and 0.3 mL DIW at 85oC for 30 minutes, followed by dilution to 5 mL with DIW resulting in 1
% (v/v) HNO3and 3 % (v/v) HCl solution. Under this these conditions, the Ag concentration was
found to be very stable.
Spike recovery tests were conducted on PACS-2 digests with a 2 µg Ag spike and quantitative recovery of 99.8±2 % (2SD, n=4) of Ag was obtained. Washing the columns prior to
use ensured that the overall column separation procedural blank was less than 0.3 ng Ag (absolute), about 200-fold less than the absolute amount of Ag in the processed sub-samples. However, intensities for Ag and Pd isotopes in all samples were procedure blank corrected in order to achieve the best results. Processing a 100 ng g-1 NIST 987a Ag standard through the
columns did not induce any detectable mass fractionation of Ag ratio in the purified solutions, (δ107/109Ag value of -0.001±0.010‰, mean and 2SD, n=4), as would be expected when
quantitative recovery is achieved.
Matrix effects. Initially, semi-quantitative analysis of purified digests using single tandem column separation was performed to assess the efficiency of matrix separation of the columns. Although concentrations of matrix elements were significantly reduced, some matrix elements were still detected at levels of greater than 0.002, a ratio of individual matrix element concentration to Ag concentration, in the purified digests (Table 3). Clearly, highest ratios of matrix element concentrations to Ag concentration were found in PACS-2 digests purified using a single run. This was expected since total loading of sediment PACS-2 was the highest with use of a sub-sample size of 0.25 g compared to 0.050 g of SRM 2781 or SRM 2782.
Previous studies on matrix effects of Na, K, Sn and W20revealed that there is no need to
match matrix elements and analyte perfectly in the sample and standard due to small effects on the 107/109Ag value. As reported previously20, a 107/109Ag value of 0.93 ± 0.08 ‰ (mean and
2SD, n=10) obtained in a 100 ng g-1 solution of SRM 978a spiked with 5000 ng g-1 each of Na
and K against a pure solution of SRM 978a using direct standard-sample-standard mass bias correction, reduced to a value of 0.09 ± 0.04 ‰ (mean and 2SD, n=10) with use of combination mass bias correction of standard-sample-standard bracketing and Pd internal normalization. This observation suggests that although the mass bias for Ag and Pd is not identical, but they behave
in a very similar manner, and matrix effects on 107/109Ag value are significantly reduced when
internal normalization with Pd in combination with standard-sample-standard bracketing for mass bias correction is used. Therefore, a Pd at high concentration (2 µg g-1) was added to both
purified digests and Ag standards for Ag isotope ratio measurements, which was not only used as an internal standard but also as a common doping matrix to reduce matrix effects of any impurities present in the purified digests. Similar approach was reported by Barling and Weis29
wherein Mg was successfully used as common doping matrix for accurate and precise Pb isotope ratio measurements.
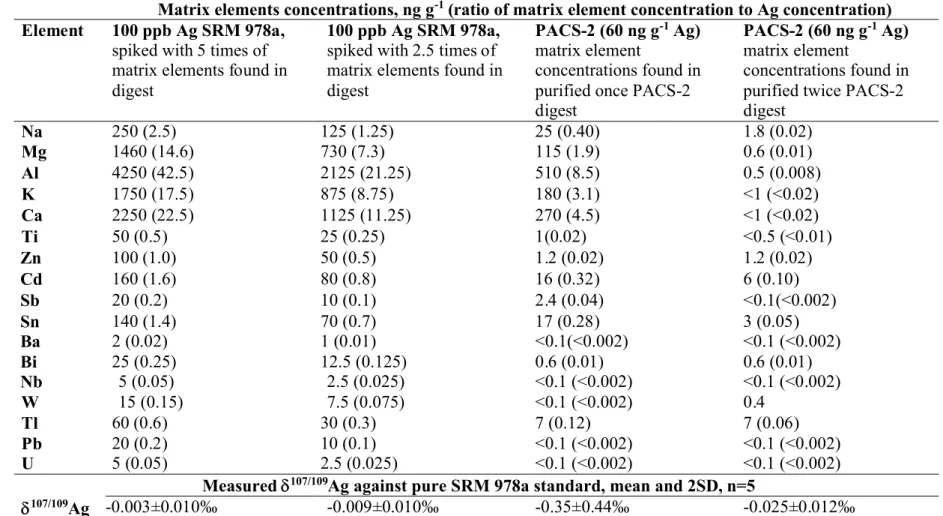
The effect of impurities in the purified sample digest on Ag isotope ratios measurement was investigated by analyzing 100 ng g-1standard solution of Ag prepared from SRM 978a in the
presence of 2.5 and 5-fold of matrix elements found in digests. Compared to a pure solution of SRM 978a and using 2 µg g-1 Pd as internal standard in combination with
standard-sample-standard bracketing for mass bias correction, 107/109Ag values were not significantly affected by
the spiked matrix elements (Table 4). This confirms that accurate Ag isotope ratio results should be obtained using a single tandem column matrix separation. However, the 107/109Ag values
obtained in single tandem column purified PACS-2 digests, varied from -0.17 to -0.67 ‰ for five PACS-2 sub-samples. This observation suggests that other unidentified matrix impurities, most likely the organic matrix or some anions which had poor detection by ICP-MS such as S, Br, I were present in the single tandem column purified PACS-2 digests, which affected the observed variability in 107/109Ag values.
Therefore, multiple tandem column matrix separations were investigated in subsequent experiments for further purification of sample matrix in order to obtain accurate and precise Ag isotope ratio results. As shown in Table 4, a precise 107/109Ag value of -0.025±0.014‰ (2SD,
n=4) was obtained for double purified PACS-2 digests. No significant difference in 107/109Ag
values was obtained in triple purified PACS-2 digests, confirming double tandem column separations sufficiently removed sample matrix (Table 5). However, triple tandem column separations may be needed for samples containing higher matrix elements or larger sample size used. Similarly, no differences in 107/109Ag values were detected in DOLT-4 and SRM 2781
digests purified using double or triple tandem column separations. Thus, double tandem column matrix separations were used in all subsequent experiments.
Potential spectral interferences from 91Zr16O+, 90Zr16OH+, 93Nb16O+, 92Zr16OH+, 92Mo16OH+, 104Ru+, 90Zr16O+, 92Zr16O+, and 91Zr16OH+on both Ag isotopes and 104Pd and 105Pd
could occur in samples containing these elements and thus could degrade the accuracy of final results and should be eliminated. Semi-quantitative analysis of all purified sample solutions revealed that concentrations of Zr and Mo were less than 0.01 ng g-1 compared to Ag
concentrations of 50-490 ng g-1, confirming insignificant interferences of their oxides and
hydroxides. Ru was found to be less than 0.005 ng g-1 in the purified sample solutions,
confirming interference free on 104Pd. In addition, no significant amount of Pd (less than 0.005
ng g-1) was found in the purified digests. These observations confirm that followed by double
tandem column matrix separation, accurate determination of Ag isotope ratios can be obtained by using the 104Pd/105Pd isotope pair for a combination of internal normalization and
standard-sample-standard bracketing for mass bias via MC-ICP-MS detection.
Validation of the method and final results. To validate the proposed method, four replicate solutions of SRM 978a at 100 ng g-1 Ag were subjected to column separation and sample
preparation processes. A value of -0.003±0.010‰ for 107/109Ag (2SD, n=4) was obtained,
For the final determination of Ag isotope ratios in environmental samples, four replicate test samples were prepared and each was measured 5 times under the optimized experimental conditions. Results are presented in Table 5. Amongst the environmental samples examined, significant differences in Ag isotope ratios were found among NIST SRM 978a standard, sediment CRM PACS-2, domestic sludge SRM 2781, industrial sludge SRM 2782 and DOLT-4. A negative 107/109Ag value of -0.284±0.014 ‰ (2SD, n=4) was obtained in DOLT-4, a
dog fish liver. This observed Ag isotope fractionation may be caused by enrichment of the heavy
109Ag isotope during elimination processes from the liver. A negative 107/109Ag value of
-0.061±0.010 ‰ (2SD, n=4), was obtained in the domestic sludge SRM 2781 which is a sample from the Metropolitan Denver Sewage District No.1 site30. This may indicate the contribution of
Ag from anthropogenic input from consumer products. For an example, a negative 107/109Ag
value of -0.08±0.05 ‰, (2SD, n=4) measured previously by Yang et al.20in highly fortified Ag
containing X-static socks. The released Ag from these products into domestic sludge could result in a negative 107/109Ag value in such material. Interestingly, a slightly positive 107/109Ag value of
+0.044±0.014 ‰ (2SD, n=4) was obtained in the industrial sludge SRM 2782 which was obtained from an industrial site in northern New Jersey involved in pharmaceutical research as effluence, according to the SRM certificate31. This observation suggests a different type of
anthropogenic input of Ag for industrial use, such as n-Ag. For an example, a colloidal Ag dietary supplement measured previously by Yang et al.20has a positive 107/109Ag value of
+0.83±0.06 ‰ (2SD, n=4). The released Ag from manufacturers of producing this supplement into industrial sludge could result in a positive107/109Ag value in such material. A very small
sediment CRM collected from Esquimalt harbor, B. C., Canada, may be a result of a combination of industrial waste water inputs and natural sources.
A 3.3-fold improvement in precision of107/109Ag values of better than ±0.015 ‰ (2SD,
n=4) was obtained in all sample matrices compared to that obtained previously 20-24, due to an
improved sensitivity with use of high performance cone on the MC-ICP-MS Neptune, makes the present method well suited for the high precision determination of very small Ag fractionations in nature.
CONCLUSION
An accurate and precise method has been developed for the determination of Ag isotope ratios in environmental samples by MC-ICP-MS. Mass discrimination and instrument drift were corrected by a combination of internal normalization with Pd and standard-sample-standard bracketing, without assuming identical mass bias for Pd and Ag. Efficient purification of Ag from sample matrices was obtained by a two stage tandem column setup with use of anion and cation exchange resin, subsequently. High precision of better than ±0.015‰ (2SD, n=4) obtained in real sample matrices makes the present method suitable for monitoring small degrees (e.g. less than 0.1 ‰ of 107/109Ag) of Ag isotope fractionation that may be found in nature.
To the best of our knowledge, this is first report on 107/109Ag values in environmental
samples. Significant differences in Ag isotope ratios were found among NIST SRM 978a standard, sediment CRM PACS-2, domestic sludge SRM 2781, industrial sludge SRM 2782 and DOLT-4. These observations further confirm that such data may provide a useful tool for fingerprinting sources of Ag in the environment and for studying a wide variety of chemical and biological processes in nature. Future studies will be aimed at the determination of Ag isotope
fractionations in samples collected from a well defined nature environment where effluents from wastewater treatment plant, waters, sediments and biological samples such as fishes can be collected.
Acknowledgement: This work was supported in part by the Canada’s Chemical Management Plan (CMP) under a CMP Project “Determination of selected CMP metallic species in environmental media”.
REFERENCES
1. Woodrow Wilson International Center for Scholars. A database of silver nanotechnology in commercial products; http://www.nanotechproject.org/inventories/silver/; Feb., 2009. 2. Tolaymat, T. M.; El Badawy, A. M.; Genaidy, A.;Schekel, K. G.; Luxton, T. P.;Suidan,
M.; Science of the Total Environ., 2010, 408, 999-1006. 3. http://www.ec.gc.ca/CEPARegistry/subs_list/Domestic.cfm
4. Johnson, C. M.; Beard, B. L.; Albaréde, F.; in Geochemistry of Non-Traditional Stable Isotopes: Reviews in Mineralogy and Geochemistry, 2004, eds. Johnson, C. M.; Beard, B. L.; Albaréde, F.; Mineralogical Society of America and the Geochemical Society, 2004, 55: 1-24.
5. Evans, R. D.; Hintelmann, H.; Dillon, P. J.; J. Anal. At. Spectrom., 2001, 16: 1064-1069. 6. D. S. Lauretta, B. Klaue, J. D. Blum and P. R. Buseck, Geochim. Cosmochim. Acta,
2001, 65: 2807-2818.
7. Hintelmann, H.; Lu, S.; Analyst, 2003, 128: 635-639.
8. Jackson, T. A.; Muir, D.; Vincent, W. F.; Environ. Sci. Technol., 2004, 38: 2813-2821. 9. Smith, C. N.; Kesler, S. E.; Klaue, B.; Blum, J. D.; Geology, 2005, 33: 825-828.
10. Q. Xie, S. Lie, D. Evans, P. Dillon and H. J. Hintelmann, Anal. At. Spectrom, 2005, 20: 515-522.
11. Ridley, W. I.; Stetson, S. J.; Appl. Geochem., 2006, 21: 1889-1899.
12. Kritee, K.; Blum, J. D.; Johnson, M. W.; Bergquist, B. A.; Barkay, T.; Environ. Sci. Technol., 2007, 41: 1889-1895.
13. Blum, J. D.; Bergquist, B. A.; Anal. Bioanal. Chem., 2007, 388: 353-359.
15. Yang, L.; Sturgeon, R. E.; Anal. Bioanal. Chem., 2009, 393, 377-385.
16. Malinovsky, D.; Sturgeon, R. E.; Yang, L.; Anal. Chem., 2008, 80: 2548-2555. 17. Bergquist, B. A.; Blum, J. D.; Science, 2007, 318: 417-420.
18. Jackson, T. A.; Whittle, D. M.; Evans, M. S.; Muir, D. C. G.; Appl. Geochem., 2008, 23: 547-571.
19. Muir, D. C. G.; Wang, X.; Yang, F.; Nguyen, N.; Jackson, T. A.; Evans, M. S.; Douglas, M.; Köck, G.; Lamoureux, S.; Pienitz, R.; Smol, J. P.; Vincent, W. F.; Dastoor, A.; , Environ. Sci. Technol., 2009, 43: 4802-4809.
20. Yang, L.; Dabek-Zlotorzynska, E.; Celo, V.; J. Anal. At. Spectrom., 2009, 24: 1564-1569. 21. Carlson, R. W.; Hauri, E. H.; Geochim. Cosmochim. Acta, 2001, 65: 1839-1848.
22. Woodland, S. J.; Rehkämper, M.; Halliday, A. N.; Lee, D. C.; Hattendorf, B.; Günther, D.; Geochim. Cosmochim. Acta, 2005, 69: 2153-2163.
23. Schönbächler, M.; Carlson, R. W.; Horan, M. F.; Mock, T. D.; Hauri, E. H.; Int. J. Mass Spectrosc., 2007, 261: 183-191.
24. Schönbächler, M.; Carlson, R. W.; Horan, M. F.; Mock, T. D.; Hauri, E. H.; Geochim. Cosmochim. Acta, 2008, 72: 5330-5341.
25. Yang, L.; Mass Spectrom. Reviews, 2009, 28: 990-1011.
26. Russell, W. A.; Papantastassiou, D. A.; Tombrello, T. A.; Geochim. Cosmochim. Acta, 1978, 42: 1075–1090.
27. Wieser, M. E.; De Laeter, J. R.; Varner, M. D.; Int. J. Mass Spectrom., 2007, 265: 40-48. 28. Irisawa, K.; Hirata, T.; J. Anal. At. Spectrom., 2006, 21: 1387-1395
29. Barling, J.; Weis, D.; J. Anal. At. Spectrom., 2008, 23: 1017-1025.
USA, Oct. 1996.
31. SRM 2782 Certificate, National Institute of Standard & Technology, Gaithersburg, MD, USA, Dec. 1998.
Table 1. MC-ICP-MS operating conditions
Instrument settings
Rf power 1250 W
Plasma Ar gas flow rate 15.0 L min-1
Auxiliary Ar gas flow rate 1.00 L min-1
Ar carrier gas flow rate 1.087 L min-1
Sampler cone (nickel) 1.1 mm Skimmer cone (H, nickel) 0.8 mm
Lens settings Optimized for maximum analyte signal intensity Data acquisition parameters
Scan type Static measurements
Cup configuration (104Pd)L3, (105Pd)L2, (107Ag)C and (109Ag)H2
Resolution ~300
Sensitivity 43 V/ppm for 107Ag
Blank 1% (v/v) HNO3and 3%HCl 0.0016 V for 107Ag, 0.0015 V for 109Ag, 0.005 V
for 104Pd and 0.011 V for 105Pd
Integration time 4.194 s Number of Integrations 1
Table 2. Column separation procedure.
Anion exchange column AG1-X8 Step
3x10 mL 2 M HCl Clean 3x5 mL 0.5 M HCl Condition Sample in 50 mL 0.5 M HCl Load 5x10 mL 0.5 M HCl Rinse 3x10 mL 0.1 M HCl Rinse 3x5 mL 0.001 M HCl Rinse 9x5 mL 1 M HNO3 Elute*
Cation exchange column AG50W-X8
3x10 mL 6 M HNO3 Clean
3x10 mL 1 M HNO3 Condition
9x5 mL 1 M HNO3 Load +Elute*
concentration in the digests.
Analyte DOLT-4
(46.5 ng g-1 Ag in
purified sample solution)
PACS-2 (60 ng g-1Ag in purified sample solution) SRM 2781 (490 ng g-1Ag in purified sample solution) SRM 2782 (153 ng g-1Ag in
purified sample solution) # of column
separation
Once Twice Once Twice Once Twice Once Twice
Na 0.08 0.04 0.40 0.03 0.02 0.002 0.02 0.01 Mg 0.03 0.01 1.9 0.01 0.01 <0.002 0.006 0.003 Al 0.05 0.04 8.5 0.008 <0.002 <0.002 0.004 0.002 K 0.09 <0.02 3.1 <0.02 0.02 <0.005 <0.002 <0.002 Ca <0.002 <0.002 4.5 <0.02 0.1 <0.005 <0.002 <0.002 Ti <0.005 <0.005 0.02 <0.01 <0.005 <0.005 <0.005 <0.005 Zn 0.05 <0.002 0.02 0.02 0.01 <0.002 0.009 <0.002 Cd 0.22 0.10 0.32 0.10 0.02 0.006 0.024 0.007 Sb <0.002 <0.002 0.04 <0.002 0.01 <0.002 <0.002 <0.002 Sn 0.15 0.01 0.28 0.05 0.13 0.02 0.29 0.07 Ba 0.003 <0.002 <0.002 <0.002 <0.002 <0.002 <0.002 <0.002 Bi 0.01 0.002 0.01 0.01 0.05 0.04 0.04 0.03 Nb <0.002 <0.002 <0.002 <0.002 0.01 <0.002 0.002 <0.002 W 0.03 <0.002 <0.002 <0.002 <0.002 <0.002 <0.002 <0.002 Tl 0.02 <0.002 0.12 0.06 <0.002 <0.002 0.003 <0.002 Pb 0.04 <0.002 <0.002 <0.002 <0.002 <0.002 <0.002 <0.002 U 0.01 <0.002 <0.002 <0.002 <0.002 <0.002 <0.002 <0.002 Only ratios of matrix element concentration to Ag concentration were greater than 0.002 are reported.
Table 4. Results for Matrix Effects.
Matrix elements concentrations, ng g-1(ratio of matrix element concentration to Ag concentration)
Element 100 ppb Ag SRM 978a, spiked with 5 times of matrix elements found in digest
100 ppb Ag SRM 978a, spiked with 2.5 times of matrix elements found in digest
PACS-2 (60 ng g-1Ag)
matrix element
concentrations found in purified once PACS-2 digest
PACS-2 (60 ng g-1Ag)
matrix element
concentrations found in purified twice PACS-2 digest Na 250 (2.5) 125 (1.25) 25 (0.40) 1.8 (0.02) Mg 1460 (14.6) 730 (7.3) 115 (1.9) 0.6 (0.01) Al 4250 (42.5) 2125 (21.25) 510 (8.5) 0.5 (0.008) K 1750 (17.5) 875 (8.75) 180 (3.1) <1 (<0.02) Ca 2250 (22.5) 1125 (11.25) 270 (4.5) <1 (<0.02) Ti 50 (0.5) 25 (0.25) 1(0.02) <0.5 (<0.01) Zn 100 (1.0) 50 (0.5) 1.2 (0.02) 1.2 (0.02) Cd 160 (1.6) 80 (0.8) 16 (0.32) 6 (0.10) Sb 20 (0.2) 10 (0.1) 2.4 (0.04) <0.1(<0.002) Sn 140 (1.4) 70 (0.7) 17 (0.28) 3 (0.05) Ba 2 (0.02) 1 (0.01) <0.1(<0.002) <0.1 (<0.002) Bi 25 (0.25) 12.5 (0.125) 0.6 (0.01) 0.6 (0.01) Nb 5 (0.05) 2.5 (0.025) <0.1 (<0.002) <0.1 (<0.002) W 15 (0.15) 7.5 (0.075) <0.1 (<0.002) 0.4 Tl 60 (0.6) 30 (0.3) 7 (0.12) 7 (0.06) Pb 20 (0.2) 10 (0.1) <0.1 (<0.002) <0.1 (<0.002) U 5 (0.05) 2.5 (0.025) <0.1 (<0.002) <0.1 (<0.002) Measured 107/109Ag against pure SRM 978a standard, mean and 2SD, n=5
Sample ID δ107/109Ag (‰) (2SD, n=4)
# of column separation Twice Three times
DOLT-4, Dogfish liver -0.284±0.014 -0.284±0.014
PACS-2, sediment -0.025±0.014 -0.025±0.010
SRM 2781, domestic sludge -0.061±0.010 -0.062±0.008 SRM 2782, industrial sludge +0.044±0.014 NA