Sea Grant College Program
Massachusetts Institute of Technology Cambridge, Massachusetts 02139
Project No. 2008-ESRDC-01-LEV
ARCHITECTURAL MODEL TO ENABLE POWER SYSTEM TRADEOFF STUDIES
C. Chryssostomidis, J. Chalfant, D. Hanthorn, et al. MITSG 10-32
C. Chryssostomidis, Julie Chalfant, David Hanthorn, James Kirtley and Matt Angle 1/2010 Architectural Model to Enable Power System Tradeoff Studies
Executive Summary
We continue the development of an overall architectural model for an all-electric ship using a physics-based simulation environment to perform fully-integrated simulation of electrical, hydrodynamic, thermal, and structural components of the ship operating in a seaway. The goal of this architectural model is to develop an early-stage design tool capable of performing tradeoff studies on concepts such as AC vs. DC distribution, frequency and voltage level, inclusion of reduction gears, energy and power management options, and effect of arrangements and
topology. The results of the studies will be presented in standard metrics including cost, weight, volume, efficiency/fuel consumption, reliability and survivability. We will specifically look at the hull, mechanical and electrical (HM&E) systems that support the ship and its missions; specifically, the electrical generation and distribution system, propulsion equipment, fresh- and saltwater pumping and distribution, control systems, and structural components.
We have previously reported the creation of a basic design tool which uses hullform, drive train particulars, and operational employment of the vessel to determine resistance, powering and fuel usage. Specific advancements reported herein include:
• Notional Ship modeled in Paramarine • Electrical Load Analysis and Prioritization • In-zone Distribution Equipment Modeling • Metrics Development
o Survivability Metric
o Graph Theory Applied to the Survivability Metric Key Accomplishments
Architectural Model to Enable Power System Tradeoff Studies: Key accomplishments this quarter include the specification of the notional ship and modeling thereof in Paramarine, the analysis and prioritization of the electrical load on the notional ship, the initial modeling of in-zone power conversion equipment, and the development of pertinent metrics, especially the survivability metric.
Technical Detail
Architectural Model to Enable Power System Tradeoff Studies
We describe here the further development of an overall architectural model for the physics-based simulation of an all-electric warship in an operational environment. This simulation integrates electrical, mechanical, structural, thermal and hydrodynamic components to accomplish trade-off studies against a standard set of metrics for evaluation.
Notional Ship
As in previous work, the notional ship is an electric-drive small surface combatant based upon SFI-2 as described in [Webster et al., 2007]. This notional ship was modified from SFI-2 to include the specific concepts shown in Table 1. The vessel is an all-electric surface combatant of
approximately 10,000 tons with primary mission areas of submarine warfare (ASW), anti-surface warfare (ASUW) and anti-air warfare (AAW).
Table 1 – Notional Ship Requirements
- All-electric ship: all systems requiring power are electric and serviced by an Integrated Power System (IPS)
- Power system architecture: Integrated Power System (IPS) and zonal distribution consistent with Next-Generation IPS (NGIPS) architecture
- Size: ~10k tons displacement
- Weapons: Rail gun, VLS, point defense system, electronic attack
- Sensors/Comms: Integrated communications suite based on anticipated future capabilities, advanced sensing suite (imagery, electronic surveillance, etc.), air and missile defense radar suite, sonar suite
- Cmd&Ctrl/Computing: Integrated command and control, total ship computing
- Aviation: Accommodate 2 helicopters or 3 vertical take-off unmanned aerial vehicles The ship is modeled in Paramarine version 6.1 created by Graphics Research Corporation (GRC). Paramarine is a commercial product which provides integrated Naval Architecture Design and Analysis; details can be found at http://www.qinetiq.com/home_grc/products.html. We chose Paramarine as the modeling component of this architectural tool due to its modular structure, physics-based design components, and ease of exporting and importing information. New advanced modeling components developed through the overall architectural model will be overlaid upon the Paramarine capability.
The basic ship layout and hull shape were taken from a notional low-level design of a balanced Frigate and scaled up from 6,000 tons to 10,000 tons. An initial estimate of required installed power was created by combining a maximum speed of 30 knots, requiring 81 MW of installed power, with a future estimated electrical loading of 37 MW based on the predicted value for future margined ship service loads from [Webster et al., 2007]. The total required power of 118 MW was met with six gas turbines: two 36 MW, two 19.5 MW and two 4.5 MW gas turbines, yielding a surplus of 2MW. Design margins are included in the 37MW ship service power estimate. Figure 1 shows the notional ship with machinery spaces and zones delineated. Figure 2 shows the machinery space layout including gas turbines and generators, propulsion motors and shafts.
The ship is divided into 6 zones for survivability purposes as shown in Figure 1. Support services will be designed so that distribution branching occurs within a zone and only major cross-connection capability crosses a zone boundary. Isolation devices are located at the zonal boundaries to permit continued operation of systems in adjacent un-damaged zones. Redundant equipment is located in separate zones if possible. While 6 zones were chosen as a starting point, the number and location of zones is a subject for potential future tradeoff studies. The separation of zones occurs at the transverse watertight bulkheads between each of the machinery spaces. This placed at least one PGM in each zone with the exception of zone 1, which is forward of all the machinery spaces. There is the possibility of placing an Energy Storage Module (ESM) in this zone to provide an additional power source in the event of a casualty. Since cableways run fore and aft the length of the machinery spaces, the decision was made to extend each zone vertically into the superstructure instead of separating the
superstructure into a separate zone. This also allows the vital equipment contained in the superstructure to be divided into multiple separate zones.
Figure 1: Notional ship modeled in Paramarine with machinery spaces and zones delineated.
Figure 2: Notional ship machinery layout
One major advantage to designing the ship with an Integrated Propulsion System (IPS) is the flexibility the designer has in placing the Power Generation Modules (PGM) and Propulsion Motor Modules (PMM). Gas turbines were chosen because of the high power levels required and their advantage in power density over diesel engines. During the initial design and layout of the IPS, this flexibility became significantly constrained by the placement of intake and exhaust stacks from the gas turbines. The exhaust could not be routed forward of the superstructure due to the obscured view from the bridge, hazard to the crew and seawater ingestion. Because the ship supports helicopter operations, the exhaust could not be routed aft because it would interfere with helicopter take-offs and landings. This led to a layout similar to that of current ships in the fleet.
There are options to be considered in future design iterations that could remove some of these restrictions. One would be to move the bridge to a more forward part of the ship allowing the gas turbines to be placed farther forward in the ship. Using diesels for smaller power loads would allow more flexibility in the air duct routing. Lastly an option to consider is placing some of the gas turbines aft where their exhaust would still interfere with flight ops but impose
restrictions on the concept of operations (ConOps) so that the aft gas turbines would be restricted from operating when flight operations are in progress. These possibilities would remove some of the constraints allowing the designer more flexibility in locations and layout. In particular this would allow for more separation between PGMs resulting in a more survivable design.
The placement of the PMMs was also restricted within the ship due to the length of shafting required to obtain an acceptable shaft angle. This forced the PMMs farther forward with only one compartment of separation. If podded propulsion were used in future iterations this restriction would be lifted.
Electrical Load Analysis and Prioritization
We have developed a prioritized listing of electrical loads; this listing is needed for many aspects of the project, such as load shedding, electrical component sizing, cooling system design, and survivability calculations.
The initial step was to develop a prioritized general categorization of electrical loads, assuming the ship was in a damaged state. This prioritized list indicates the electrical loads that should be serviced in order of priority for the ship to survive the damage, continue to operate, and meet its mission. This prioritized list is shown in Table 2.
This prioritized list was then further broken down into specific electrical loads assigned to zones with an associated heat generation factor and cooling medium. Load usage was estimated for various battle conditions and external temperatures. Several sources of data were used to
compile this high-level list of electrical loads for the notional ship. BMT Syntek provided a load analysis for ESRDC use which included typical loads divided into five zones, and provided heat conversion factors and cooling media for each load. The BMT Syntek list did not include any values for advanced sensors or weapons and did not include propulsion loads. Unclassified copies of electrical load analysis charts for DDG 51, DD 963 and FFG 7 class ships compiled by Gibbs and Cox and by Ingalls Shipbuilding were consulted for typical ship service loads as well. To ensure the resulting list is unclassified, electrical analysis was maintained at a high level, not delving into specific pieces of equipment or their specific location. A sample of the load
breakdown by zone and power requirements for the first three items in the electrical load priority list is shown in Table 3.
Using this loading scheme, the total electrical load, divided into zones and into type of power required (60 Hz AC, 400 Hz AC, and DC) is listed in Table 2. Note that ‘direct-fed DC’ is used to denote items that are fed directly from the bus through their own dedicated transformer, rectifier or drive instead of being fed from a load center. These direct-fed loads include the propulsion motors, radar and rail gun.
Table 2: Electrical Load Priority List
1. Power generation
For each generator that is operational, supply power to the associated auxiliaries such as lube oil, vent fans, fuel, starter, control panel, alarms, etc. Activate the engineering control system. 2. Damage Control
Fire fighting, dewatering, lighting, electrical receptacles (for powering damage control equipment such as submersible pumps, blowers), basic ventilation, interior communications, countermeasure washdown. Emergency medical support. Potable water distribution.
3. Basic Mobility
Propulsion to achieve 4 knots (steerageway). One motor and drive, associated propulsion sensors, control system. One steering system (hydraulics, controls).
4. Self Defense
SeaRAM/CIWS or equivalent (self-contained system that requires only electrical power and chill water to operate). Electronic warfare sensor (such as SLQ-32 or basic InTop) and missile decoy such as NULKA or chaff. Degaussing. Chill water pump, A/C compressor and ASW pump. 5. Exterior Communications
Full external communications suite including IFF, TACAN. Navigation system to include basic close-in radar, gyro. Assume that the cooling online already can also support this equipment. 6. Helicopter and Boat Recovery
Basic helicopter systems required for recovery of helicopters only, not full flight operations; e.g., landing lights, RAST, winches, control station. Power to boat davit.
7. Increase speed to 10 knots. 8. Basic Offense
Sensors, Weapons, Ship Control System. Assume a low-power level of radar is available with degraded performance either reducing range, resolution, or both. Bring full hull-mounted sonar capability online. Energize ship control system including weapons control and sensor integration in all intact zones. For weapons, energize one of any redundant systems such as gun, torpedo, VLS. Only energize a weapon if supporting sensors are available; e.g., do not energize torpedoes if sonar not available, do not energize VLS if sufficient radar not available. Increase chill water capacity by adding pump, compressor, and ASW pump. Add remaining ventilation systems.
9. Full Flight Operations
All flight equipment not already energized, including refueling capability and fuel transfer. 10. Increase Offense
Increase radar to medium power level. Increase cooling capacity to support. Activate the remaining weapons systems, excluding high-energy weapons.
11. Increase speed to 20 knots.
12. Miscellaneous supporting mechanical services.
Fan cooling units for all spaces. Air compressors. Battery chargers for small boats, helo, gyro. Potable water equipment including distillers, reverse osmosis units, brominator, etc.
13. Full Offense
Increase radar to full power level. Provide sufficient cooling. Energize high-energy weapons (rail gun, laser). Activate towed-array sonar, if applicable.
14. Increase speed to 25 knots. 15. Non-Vital Loads
All non-vital loads. Examples include galley equipment, heat, water heaters, laundry, stores handling, and miscellaneous machinery systems such as fuel transfer, air compressors, anti-icing, lube oil heating, sewage treatment.
Table 3: Electrical requirements by zone and category
Battle Power Requirement, kW
equipment zone 60 Hz AC 400 Hz AC DC Direc t DC TOT POWER GENERATION PGM 1 (med) AUXILIARIES 2 100 100 PGM 2 (large) AUXILIARIES 3 130 130 PGM 3 (small) AUXILIARIES 4 60 60 PGM 4 (small) AUXILIARIES 4 60 60 PGM 5 (large) AUXILIARIES 5 130 130 PGM 6 (med) AUXILIARIES 6 100 100
ENG CTRL SYS zone 1 (no MR) 1 3 3
ENG CTRL SYS zone 2 (AMR) 2 7 7
ENG CTRL SYS zone 3 (MMR) 3 10 10
ENG CTRL SYS zone 4 (AMR) 4 7 7
ENG CTRL SYS zone 5 (MMR) 5 10 10
ENG CTRL SYS zone 6 (AMR, eng control) 6 25 25
DAMAGE CONTROL
Fire Pump (two of 6 on line) 1 0 0
Fire Pump 2 60 60
Fire Pump 3 0 0
Fire Pump 4 60 60
Fire Pump 5 0 0
Fire Pump 6 0 0
receptacles, IC, vent, water coolers 1 12 12
receptacles, IC, vent, water coolers 2 12 12
receptacles, IC, vent, water coolers 3 12 12
receptacles, IC, vent, water coolers 4 12 12
receptacles, IC, vent, water coolers 5 12 12
receptacles, IC, vent, water coolers 6 12 12
IC 400 Hz equipment 6 16 16
interior and exterior lighting 1 10 10
interior and exterior lighting 2 10 10
interior and exterior lighting 3 20 20
interior and exterior lighting 4 10 10
interior and exterior lighting 5 20 20
interior and exterior lighting 6 10 10
Medical Equipment 1 2 2
BASIC MOBILITY
steering gear pump, steering control system 6 50 50
steering gear pump, steering control system 6 50 50
various propulsion sensors, power panels 3 5 5
motors and motor drive 3 160 160
various propulsion sensors, power panels 5 0 0
Table 4: Electrical load in kW by zone and power type Zone 60 Hz AC 400 Hz AC DC Subtotal Direct-fed DC Total 1 429 55 46 530 20,000 20,530 2 542 0 88 630 0 630 3 1,488 4 50 1,541 44,765 46,306 4 413 0 46 459 0 459 5 424 0 66 490 35,130 35,620 6 731 16 88 835 0 835 Total 4,027 75 384 4,486 99,895 104,381
In-zone Distribution Equipment Modeling
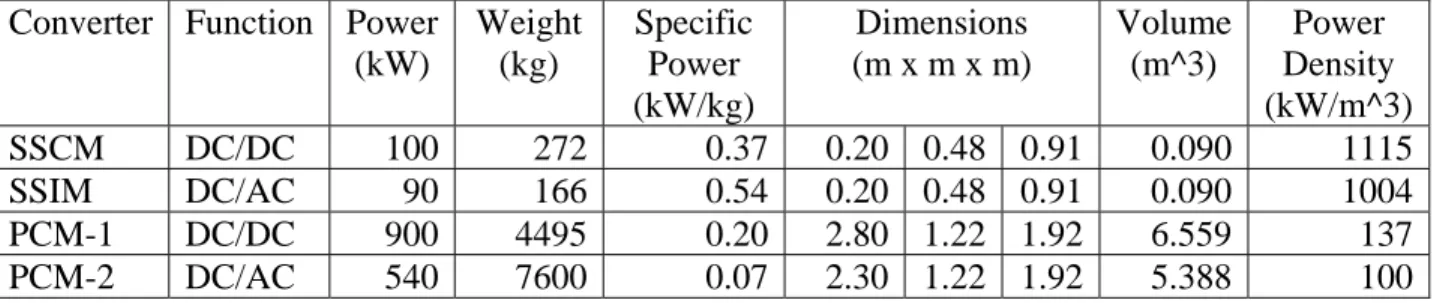
Included in the architectural model is the basic power conversion and distribution equipment including location, connectivity, weight and volume. As an initial starting position for modeling in-zone power distribution and conversion, off-the-shelf equipment performance numbers for power conversion equipment are scaled based on the expected size of the loads in the zone to determine approximate weight and volume. MVDC is an emerging technology, so equipment at an appropriate voltage level is not commercially available off-the-shelf; we used equipment that performs the same function at different voltage levels as a basis. Information was obtained from Dennis Mahoney and Ed Wagner of Satcon and pertains to the equipment planned for DDG 1000.
The PCM-1 is the primary DC-DC converter and converts power from bus voltage down to a more usable 800V. The PCM-1 contains several smaller, line-replaceable units called SSCMs, each rated at 100 kW. The PCM-1 feeds the PCM-2, which is an inverter converting from the DC output of the PCM-1 to 450V 60Hz AC supplied to loads in the zone. It contains line-replaceable units called SSIC modules.
Detailed weights and sizes of the PCMs, SSICs and SSCMs are presented in Table 5. Note that the specific power (power per unit weight) of the PCM-1 is half of the specific power of the SSCM and the power density (power per unit volume) is about a tenth that of the SSCM.
Similarly, the specific power and power density for the PCM-2 is significantly lower than that of the SSIC. The numbers for the PCMs include main disconnects, relays, diodes, cooling system, man-machine interface, and other hardware in addition to the SSCM/SSIC functionality. The DDG 1000 bus voltage is 1kV.
For a conceptual zonal power distribution design with an MVDC bus, the same basic architecture is used. Voltage is stepped down from the 10kV distribution bus before being converted in to 60 or 400 Hz AC. This means that the DC-DC converters convert all power that is used for DC and both types of AC loads. Thus the total power for each zone is divided by the specific power of the PCM-1 to get the mass for the DC/DC converter. Similarly, the mass for the 60 Hz and 400 Hz inverters are obtained by dividing the power for each subsection by the specific power for that converter.
The 400Hz inverter should be significantly lighter than the 60Hz converter since the size of the magnetic components in the converter scale inversely with frequency. The output filter and the inductor inside it are the driving forces behind the mass of the converter. The filter inductor
value varies inversely with frequency. The number of turns varies linearly with the inductor value. Flux varies linearly with number of turns, assuming current is constant. Core size varies linearly with flux to avoid saturation. Core size drives the weight of the inductor. Following this logic, the dominant piece of the converter should be 400/60, or 6.67 times smaller than the 60 Hz inverter. The amount of 400 Hz power is insignificant in comparison to the amount of other types of power, so sizing of the inverter has reduced significance. For the purpose of obtaining round numbers, the 400 Hz inverter is assumed to be ¼ the mass & volume of the 60 Hz inverter. The results of equipment scaling are shown in Tables 6 and 7. Table 6 presents the mass of the scaled equipment, and table 7 presents scaled volumes, based upon the power requirements shown in Table 4.
Table 5: Existing equipment power, mass and volume Converter Function Power
(kW) Weight (kg) Specific Power (kW/kg) Dimensions (m x m x m) Volume (m^3) Power Density (kW/m^3) SSCM DC/DC 100 272 0.37 0.20 0.48 0.91 0.090 1115 SSIM DC/AC 90 166 0.54 0.20 0.48 0.91 0.090 1004 PCM-1 DC/DC 900 4495 0.20 2.80 1.22 1.92 6.559 137 PCM-2 DC/AC 540 7600 0.07 2.30 1.22 1.92 5.388 100
Table 6: Scaled mass in kg of power conversion equipment in each zone. Note that all power is first converted to 800V DC.
PCM-2 PCM-2 modified PCM-1 Zone 60hz 400Hz DC Subtot 1 6,038 194 2,647 8,878 2 7,628 0 3,147 10,775 3 20,942 14 7,696 28,653 4 5,813 0 2,292 8,105 5 5,967 0 2,447 8,415 6 10,288 56 4,170 14,515 Total 56,676 264 22,400 79,340
Table 7: Scaled volume in m3 of power conversion equipment in each zone.
PCM-2 PCM-2 modified PCM-1 Zone 60hz 400Hz DC Subtot 1 4.3 0.1 3.9 8.3 2 5.4 0.0 4.6 10.0 3 14.8 0.0 11.2 26.1 4 4.1 0.0 3.3 7.5 5 4.2 0.0 3.6 7.8 6 7.3 0.0 6.1 13.4 Total 40.2 0.2 32.7 73.0
Metrics Development
The following set of metrics are selected to provide a consistent background for analysis of tradeoff variants: - weight - volume - efficiency/fuel consumption - cost - reliability - survivability
The weight, volume, efficiency and fuel consumption metrics are well defined and described below. The cost and reliability metrics are still being developed; initial thoughts are presented herein. During this reporting period, significant study has gone into the survivability metric; this research is presented below as well.
The weight and volume metrics are defined simply as the change in weight and volume occupied by the equipment in each tradeoff as compared to the baseline.
The metric for efficiency is annual fuel consumption. Efficiency of the systems as installed will be traced back to total load placed on the engines in each of several battle conditions and ship speeds. The amount of fuel required annually is then determined using a speed-condition profile that delineates the percent of time spent at various speeds and battle conditions, the engines’ specific fuel consumption (SFC) at each loading, and an engine usage profile specifying numbers and types of engines online and load sharing between engines at each speed-condition state. We plan to use a twofold measure of cost: first, as a measure of operating cost, the annual fuel usage is translated to dollars using the current bunker price of marine diesel oil. Second, we hope to use a purchase price for the equipment selected as a measure of construction cost; however, we are still working to obtain relevant purchase price data for some equipment. This may prove quite difficult due to the cutting-edge nature of some of the technology.
The cost metric is ripe for study; there are many factors of cost that are not yet incorporated into this metric. For example, installation and maintenance costs associated with how tightly the equipment is packed into the space and how easily the cable can be routed, maintenance costs associated with reliability of the equipment, training costs for Navy personnel to operate and maintain the equipment, and disposal costs related to the amount of hazardous waste
incorporated.
The reliability metric is yet to be fully defined. It will most likely be some combination of mean-time-between-failure data along with the quality of service metric as described in [Doerry and Clayton, 2005].
Survivability Metric
The current method for analyzing survivability of a ship is accomplished using a the mission set of the ship and a series of potential threats. The ship’s ability to respond to those threats, including the ability to defeat or evade the threats before impact, the ability to withstand the
impact, and the ability to recover from the impact, are combined into a measure of survivability involving Design Threat Outcomes that range from completely unaffected to total loss of the ship and personnel. See, for example, [Doerry 2007]. This extensive survivability analysis can take weeks to properly calculate; in the early stages of design, the ship may have gone through several iterations in that amount of time, rendering the survivability analysis obsolete before its completion. In addition, this metric is a measure of the survivability of the ship as a whole including the effectiveness of a multitude of factors such as weapons systems, personnel performance, and ship design.
We seek a metric to rapidly measure the impact of support system design on the overall survivability of the vessel. Thus, when comparing various electrical distribution systems, cooling methodologies, or other hull, mechanical and electrical (HM&E) systems, we can
accurately compare the survivability of the ship using the given system. The survivability metric measures the relative survivability of ship variants when subjected to damage.
The new survivability metric is constructed as follows:
Given a set of loads, establish a weighted prioritized list for servicing the loads. The list of loads is dynamically prioritized such that a load that has been demolished by the imposed damage is removed from the list, as there is no reason at that point to allocate resources to it. These loads are then grouped into tiers indicating levels of survivability that establish expected capability of the ship following an attack.
Next, impose damage upon the ship. Initially, damage will be imposed in manually selected positions and will consist of a center of impact and a radius of destruction. All equipment within the radius is assumed destroyed. Service systems are traced back from the damage to the first intact isolation point; all services between the isolation points and the damage are assumed lost. Future research may include a stochastic imposition of damage simulating a series of threat weapon encounters at random areas of the ship.
The survivability score is twofold to measure two distinct issues. The first metric is the highest tier of survivability that can be achieved while simultaneously fulfilling all lower tiers. The second metric is a total load value that indicates the maximum value of all loads that can be serviced, proceeding in the order of the dynamically prioritized list, even if some higher priority loads cannot be serviced due to connectivity problems.
This method can be used for any type of service or a combination of services: electrical power, chill water, seawater, ventilation air. It can also be tailored as desired by the user to increase or decrease the fidelity at which survivability is analyzed by changing the detail incorporated into the dynamically prioritized list. As an example, we present a thorough analysis of the
survivability metric for analyzing the electrical distribution system on the notional ship described above.
Survivability Metric as applied to the Electrical Distribution System
The survivability metric analysis described above requires a prioritized list of loads, a tiered survivability system, a set of sources and a distribution system. The prioritized list of electrical loads for the notional ship is based upon the electrical load priority list shown in Table 2 above. Each of the items in the priority list is broken down into more specific loads which have an associated power requirement and zone location. The breakdown for the first three line items is shown in Table 3.
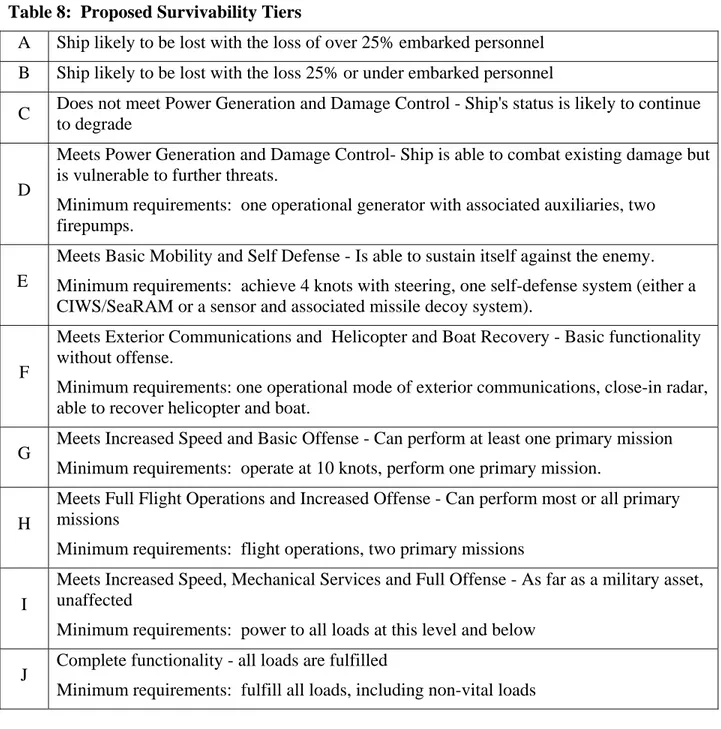
Levels of survivability were grouped into tiers that establish expected capability of the ship following damage. The survivability tiers developed for the notional ship are shown in Table 7; capabilities refer to the electrical load priority list shown in Table 2. For the ship to meet any survivability tier, it must meet the minimum requirements of that tier and all lower tiers. For example, a ship that meets tier E must achieve 4 knots with steering, have one operational self-defense system, two operational firepumps, and one generator with associated auxiliaries, and must have sufficient power to service all of those loads simultaneously.
The first two survivability tiers shown in Table 8 will be determined by analyzing the ship’s conditions following impact to determine if there is sufficient buoyancy to remain afloat. If there is not then the outcome will fall into either condition A or B. A notional distribution of
personnel throughout the ship will be assumed based on general quarters at the time of impact. All personnel in the affected spaces will be lost and only 80% of those remaining will escape successfully.
The second measure of survivability is calculated as follows. Given a damage scenario, determine which generators are operational, which loads are operational, and the connectivity between the generators and loads. Then service all possible loads in a manner to achieve the highest weighted score, given the priority listing of loads, an example of which is shown in Table 3. For example, if the two medium-sized generators survive, then a total of 39 MW of power is available to service all undamaged loads; however, integrity of the distribution bus must be examined to determine connectivity between the generators and remaining loads. Then, the power is assigned to the loads for which connectivity exists in priority order until all power is allocated. Note that this is an exercise for calculating the survivability metric and is not a proposed method of power control or load shedding.
This survivability metric differs from that suggested in [Doerry 2007]. For example, we do not place the same emphasis on primary mission areas and do not include such factors as repair and restoration capabilities onboard or in-theater. While Doerry’s metric gives a more complete picture of ship survivability, it is significantly more difficult to calculate. Our goal in this research is to construct a metric that can be used in the early stages of design to rapidly assess the impact of decisions on the survivability of the ship, thus allowing survivability to be a factor in the decision making early in the design of the ship.
Table 8: Proposed Survivability Tiers
A Ship likely to be lost with the loss of over 25% embarked personnel B Ship likely to be lost with the loss 25% or under embarked personnel
C Does not meet Power Generation and Damage Control - Ship's status is likely to continue to degrade
D
Meets Power Generation and Damage Control- Ship is able to combat existing damage but is vulnerable to further threats.
Minimum requirements: one operational generator with associated auxiliaries, two firepumps.
E
Meets Basic Mobility and Self Defense - Is able to sustain itself against the enemy. Minimum requirements: achieve 4 knots with steering, one self-defense system (either a CIWS/SeaRAM or a sensor and associated missile decoy system).
F
Meets Exterior Communications and Helicopter and Boat Recovery - Basic functionality without offense.
Minimum requirements: one operational mode of exterior communications, close-in radar, able to recover helicopter and boat.
G Meets Increased Speed and Basic Offense - Can perform at least one primary mission Minimum requirements: operate at 10 knots, perform one primary mission.
H
Meets Full Flight Operations and Increased Offense - Can perform most or all primary missions
Minimum requirements: flight operations, two primary missions
I
Meets Increased Speed, Mechanical Services and Full Offense - As far as a military asset, unaffected
Minimum requirements: power to all loads at this level and below J Complete functionality - all loads are fulfilled
Graph Theory Applied to the Survivability Metric
As a step toward automating the calculation of the survivability metric, research exploring the application of graph theory concepts to a ring bus power flow example was conducted. The goal of this research is to answer the following question:
Given:
- m sources (generators) of known capacity, and - n sinks (loads) of known size, with
- known connectivity between sources and sinks, and - a weighted priority of satisfying each load,
how should the sources be allocated to maximize the total weight (priority) of the satisfied loads? The following additional notes apply as well:
- Not all sources are connected to all sinks.
- There is insufficient total power generated to satisfy all the loads. - A single generator can simultaneously power more than one load.
- A single load can be satisfied using power from more than one generator. - There are more individual loads than individual generators.
- Power cannot flow through loads.
- Power cannot flow back into the generators.
The diagram showing the network is found in Figure 3. This figure is based upon the ring bus architecture of the notional MVDC system model in RTDS at FSU CAPS.
The use of four algorithms is described here:
1. Multihop connectivity [Miller, 2001]- calculates the number of ‘hops’ from one node to each other node in an undirected graph, given an adjacency matrix, Aij. An undirected graph allows power to flow in either direction through a link; this means that for our example a load cannot be simultaneously linked to the bus through more than one link, or the total power of the network would be allowed to flow through the load to another load. This algorithm can be used to determine the length of the shortest path in number of nodes traversed from any one point in the network to any other point in the network. To determine full connectivity in our sample
network, the algorithm must be run twice; once with each load connected to either the port or starboard bus and a second time with the load connected to the opposite bus.
Figure 3. A ring bus architecture modeled in Simulink [The MathWorks]. This example connects four generators (grey) to four zonal loads (orange) and four bus-connected loads (orange). The switches are green when closed, red when open. In this image, the bow and stern disconnects are open, the energy storage module is disconnected, and one generator is disconnected.
2. Dijkstra’s algorithm [Cormen, 2002]- calculates the lowest weight path from a single node to each other node in a directed weighted graph. Returns the weight (cost) of the path and the sequence of nodes in the lowest cost path. This allows the determination of shortest path dependent upon some characteristic of the path such as total resistance or length of cable. This algorithm eliminates the need to run twice as required in the multihop connectivity example, since the graph is directed (in a directed graph, flow can be specified to be one-way in either direction or two-way in any link between nodes).
3. Edmonds-Karp algorithm [Cormen, 2002] - calculates maximum possible flow in a network represented as a directed graph with capacities associated with each leg. The algorithm
determines the maximum possible flow through the network and the flow in each identified path. This prevents you from overloading any section of the network, given the capacity of the cabling connecting that section of the network. However, this algorithm does not prioritize which load is filled first; it maximizes the flow in the shortest path found using a breadth-first search, then seeks the next shortest path with capacity available.
4. Linear programming [The MathWorks]- using the LINPROG command in the MATLAB optimization toolbox, this approach finds the minimum of f*x subject to a set of linear constraints such that Ax ≤ b and lb ≤ x ≤ ub, where fi is the weight/priority of filling load xi, lb and ub are the
lower and upper bounds on x, and A is the set of constraints imposed such that the total power supplied by a generator is less than or equal to the capacity of the generator, the total power supplied to a load is less than or equal to the size of the load, and a generator only supplies
power to a load for which connectivity exists between the generator and the load. At present, the path followed by the power is not determined, and the losses therein are not calculated.
Dijkstra’s algorithm is run first to determine connectivity between a generator and load. Next Quarter’s Goals:
Implement survivability metric calculation on notional ship using manually selected damage locations.
Continue architectural model development, increasing accuracy of weight and volume information.
Refine and apply full range of metrics to the notional ship. REFERENCES
Cormen, Leiserson, Rivest, Stein, Introduction to Algorithms. MIT Press, Cambridge, MA, 2002.
N. H. Doerry, Designing Electrical Power Systems for Survivability and Quality of Service,
Naval Engineers Journal, 119:2, pages 25-34, 2007.
N. H. Doerry, Next Generation Integrated Power System (NGIPS) Technology Development
Roadmap. Ser 05D/349, Naval Sea Systems Command, Washington Navy Yard, DC,
November 2007. Approved for public release, distribution unlimited.
N. H. Doerry and D. H. Clayton, Shipboard Electrical Power Quality of Service, Proceedings of
the IEEE Electric Ship Technologies Symposium, Philadelphia, PA, July 25-27, 2005.
L. E. Miller, Multihop Connectivity of Arbitrary Networks, Wireless Communication
Technologies Group, NIST, 29 March 2001.
The MathWorks, MATLAB and Simulink for Technical Computing, Natick, MA.
J. S. Webster, H. Fireman, D. A. Allen, A. J. Mackenna, and J. C. Hootman. Alternative Propulsion Methods for Surface Combatants and Amphibious Warfare Ships.
Transactions of the Society of Naval Architects and Marine Engineers, 115, 2007.
Publications and reports resulting from ONR Support related to this topic:
J. S. Chalfant and C. Chryssostomidis, Toward the Development of an Integrated Electric Ship Evaluation Tool, Proceedings of the 2009 Grand Challenge in Modeling and Simulation,
GCMS '09, Istanbul, Turkey, July 13-16, 2009.
B. Epps, J. S. Chalfant, R. Kimball, A. Techet, K. Flood, and C. Chryssostomidis, OpenProp: An Open-Source Parametric Design and Analysis Tool for Propellers, Proceedings of the
2009 Grand Challenges in Modeling and Simulation, GCMS '09, Istanbul, Turkey, July
13-16, 2009.
J. Herbst, A. Gattozzi, J. Uglum, J. S. Chalfant, C. Chryssostomidis, J. Langston, M. Steurer and M. Andrus, Modeling and Simulation of Electric Propulsion Concepts for a Multimodal Prototype Demonstrator, Proceedings of the 2009 Grand Challenges in Modeling and


![Figure 3. A ring bus architecture modeled in Simulink [The MathWorks]. This example connects four generators (grey) to four zonal loads (orange) and four bus-connected loads (orange)](https://thumb-eu.123doks.com/thumbv2/123doknet/14076903.463135/15.918.111.758.109.513/figure-architecture-modeled-simulink-mathworks-connects-generators-connected.webp)
