Publisher’s version / Version de l'éditeur:
Journal of Cement and Concrete Research, 38, 12, pp. 1438-1446, 2008-12-01
READ THESE TERMS AND CONDITIONS CAREFULLY BEFORE USING THIS WEBSITE.
https://nrc-publications.canada.ca/eng/copyright
Vous avez des questions? Nous pouvons vous aider. Pour communiquer directement avec un auteur, consultez la
première page de la revue dans laquelle son article a été publié afin de trouver ses coordonnées. Si vous n’arrivez pas à les repérer, communiquez avec nous à PublicationsArchive-ArchivesPublications@nrc-cnrc.gc.ca.
Questions? Contact the NRC Publications Archive team at
PublicationsArchive-ArchivesPublications@nrc-cnrc.gc.ca. If you wish to email the authors directly, please see the first page of the publication for their contact information.
NRC Publications Archive
Archives des publications du CNRC
This publication could be one of several versions: author’s original, accepted manuscript or the publisher’s version. / La version de cette publication peut être l’une des suivantes : la version prépublication de l’auteur, la version acceptée du manuscrit ou la version de l’éditeur.
For the publisher’s version, please access the DOI link below./ Pour consulter la version de l’éditeur, utilisez le lien DOI ci-dessous.
https://doi.org/10.1016/j.cemconres.2008.08.001
Access and use of this website and the material on it are subject to the Terms and Conditions set forth at
New perspectives of maturity method and innovative approach for high
performance concrete applications
Zhang, J. Y.; Cusson, D.; Monteriro, P.; Harvey, J.
https://publications-cnrc.canada.ca/fra/droits
L’accès à ce site Web et l’utilisation de son contenu sont assujettis aux conditions présentées dans le site LISEZ CES CONDITIONS ATTENTIVEMENT AVANT D’UTILISER CE SITE WEB.
NRC Publications Record / Notice d'Archives des publications de CNRC: https://nrc-publications.canada.ca/eng/view/object/?id=6a23ae64-1437-4893-bbcd-50a33d78769c https://publications-cnrc.canada.ca/fra/voir/objet/?id=6a23ae64-1437-4893-bbcd-50a33d78769c
http://irc.nrc-cnrc.gc.ca
N e w p e r s p e c t i v e s o f m a t u r i t y m e t h o d a n d
i n n o v a t i v e a p p r o a c h f o r h i g h p e r f o r m a n c e
c o n c r e t e a p p l i c a t i o n s
N R C C - 4 9 7 0 9
Z h a n g , J . Y . ; C u s s o n , D . ; M o n t e r i r o , P . ;
H a r v e y , J .
2 0 0 8 - 1 1 - 1 7
A version of this document is published in / Une version de ce document se trouve dans:
Journal of Cement and Concrete Research
The material in this document is covered by the provisions of the Copyright Act, by Canadian laws, policies, regulations and international agreements. Such provisions serve to identify the information source and, in specific instances, to prohibit reproduction of materials without written permission. For more information visit http://laws.justice.gc.ca/en/showtdm/cs/C-42
Les renseignements dans ce document sont protégés par la Loi sur le droit d'auteur, par les lois, les politiques et les règlements du Canada et des accords internationaux. Ces dispositions permettent d'identifier la source de l'information et, dans certains cas, d'interdire la copie de documents sans permission écrite. Pour obtenir de plus amples renseignements : http://lois.justice.gc.ca/fr/showtdm/cs/C-42
New Perspectives on Maturity Method and Approach
for High Performance Concrete Applications
Jieying Zhang*1, Daniel Cusson1, Paulo Monteiro2, and John Harvey3
1
National Research Council Canada, Ottawa, Ontario, Canada, K1A 0R6
2
University of California at Berkeley, Berkeley, USA, 94720
3University of California at Davis, Davis, 95616, USA
ABSTRACT
This paper presents a maturity concept and approach of applying the maturity method for predicting the development of mechanical properties of high-performance concrete over time. An examination of the activation energy and assumptions taken in the developmental process of the existing maturity method are first presented to better understand the capabilities and limitations of the maturity method, which is supported by new and existing experimental evidence. A practical approach is then proposed in which the activation energy is determined mathematically by minimizing the error between the predictions and experimental data. It is based on a new concept that the same maturity is defined only when different specimens of the same concrete have achieved the same level of a specified property under different curing temperatures. This concept makes the maturity approach more robust and more general for application to different concrete mix formulations and different types of property. The accuracy and feasibility of the proposed approach were successfully confirmed by experimental evidence.
Keywords: high-performance concrete (A); maturity method; activation energy (A); temperature function (A); early-age mechanical properties (B).
1. INTRODUCTION
The accurate determination of the early-age properties of high-performance concrete (HPC) is important in many applications, such as in bridges, concrete pavement, buildings, and parking structures. One major concern with low water-cement ratio HPC is early-age cracking caused by restrained autogenous shrinkage developing at early ages. More research is required to understand, improve and better predict the early-age behaviour of HPC structures, particularly tensile strength and modulus of elasticity, which are two key properties influencing the early-age cracking. Since the early-age behaviour of concrete is significantly influenced by the curing temperature and moisture conditions, the maturity concept can be used to predict the development of different properties over time.
The maturity method is a technique that was developed primarily for predicting the development of compressive strength of concrete from its temperature history, and it has been used for the construction of normal-strength concrete structures for decades [1,2] due to its simplicity and the apparent link between concrete strength and cement hydration. Recently, much effort has been observed in the application of this method for the prediction of a number of concrete properties other than compressive strength [3-10]. The accuracy and feasibility of the maturity method however, have been highly debated from its first application to the current practice. This was initiated by a lack of scientific consensus on the relationship to use between maturity, hydration kinetics, microstructure, and property development. Even today, there are still several common disagreements and misunderstandings with regard to its application, specifically with the first two of the three steps involved in its application, which are: (i) the selection of a formulation for the maturity index and values for the control variables (i.e. the activation energy); (ii) the determination of the relationship for the compressive strength as a function of maturity (determined mostly from lab testing on concrete samples); and (iii) the calculation of a maturity value at a given time
with the temperature history of the concrete under investigation, and the determination of the strength for the given time from the maturity-strength relationship.
With regard to the first step (i.e. selection of a maturity formulation), the equivalent age method (or Arrhenius maturity) is generally believed to yield the most accurate predictions among different available formulations. This formulation has one control variable, which is the activation energy (Ea). The
activation energy is determined from a rate constant (also known as temperature function in concrete research), and most commonly associated in physical chemistry with the Arrhenius behaviour of chemical reactions [11]. It characterizes the temperature dependence of a chemical reaction and, when used for cement hydration reactions in concrete, Ea has been shown to relate to concrete mix design parameters
such as type of cement and water-cement ratio [12]. Compared to normal concrete, cement hydration of low w/c HPC probably has a different temperature sensitivity, since a lower amount of water in concrete per unit volume may result in lower evaporative cooling, a higher concrete temperature, and hence different hydration kinetics and a different Ea or temperature function. In spite of the large number of
experimental studies [4,5,7,12], the dependence of Ea (or the temperature function) on different concrete
mix formulations or on different properties of the same concrete has not been clearly identified.
Moreover, the more fundamental question of whether cement hydration displays a true Arrhenius behaviour has also been raised. The answers from the literature are contradictory: (i) cement hydration measured by conduction calorimetry was found to display an Arrhenius behaviour only at early ages [4]; (ii) activation energy of cement hydration measured by evaporable water was found to reduce with increasing hydration [5,7]; and (iii) the hydration reaction was observed to follow an Arrhenius behaviour from a detailed analysis of the literature data [13]. Despite the debate on whether Ea is an adequate
parameter to describe the maturity of cement hydration, the maturity formulation of the equivalent age based on activation energy has been widely used in practice, and consequently the search for a suitable value of Ea has been pursued. Since the ASTM C1074 procedure for the determination of Ea for a
particular concrete can be tedious, it is natural for practicing engineers and researchers to ask whether there exists a unique and common value of Ea that could be used for different concretes, and whether the
Ea value determined for the compressive strength of a given concrete could be used to predict other
properties.
The lack of consensus in the selection of an adequate formulation for the maturity index (Step 1) has caused significant confusion for practicing engineers regarding the degree of complexity of the experiments needed for the determination of Ea and its application to different properties of the same
concrete or to different concretes. On the other hand, the importance of the uniqueness of the relationship between the property of interest (e.g. strength) and maturity has been underestimated (Step 2). This uniqueness concept requires that the strength-maturity relationship must be independent of temperature, which is the whole rationale for adopting the maturity method as a prediction tool for field use. In the field practice, after a value of Ea is selected the maturity-strength relationship is often established from
testing concrete strength from specimens cured (only) under one curing temperature. It is important to emphasize that the selection of Ea does not warrant the uniqueness of the property-maturity relationship.
In this paper, a theoretical examination of the maturity method and experimental verifications on HPC specimens were conducted in an effort to address the above questions with the aim of developing a practical approach that can yield accurate predictions. More specifically, the two following questions will be addressed: (i) Is the temperature function (or activation energy) the same for all properties of a given HPC formulation? (ii) Is there a generic approach for applying the maturity method to different concrete properties and different concrete formulations? It is believed that the key parameters used in the maturity method (e.g. temperature function and activation energy) need to be understood further in terms of the underlying physical chemistry before the maturity concept can be more widely accepted by practicing engineers. It is also believed that the maturity method needs to be examined in terms of its development in order to provide an insight into how it was formulated and what assumptions were made. This, in turn,
will provide a more fundamental understanding of its capabilities and limitations, which eventually will guide field engineers in the correct use of the maturity concept with increased prediction accuracy.
2. BACKGROUND OF MATURITY METHOD
2.1. Temperature function and activation energy
In physical chemistry, the rate of a chemical reaction is often described as a function of temperature T and a function of a reactant concentration [A] as follows [11]:
[
]
k
(
T
)
g
([
A
])
dt
A
d
=
×
−
(1) where t is time, k(T) is a temperature function, and g([A]) is a function of the reactant concentration. For this type of reaction rate, the two functions are independent of each other. Also, many temperature functions k(T) are observed to increase exponentially with temperature, following the Arrhenius law [11], which can be conveniently written as:[
k
(
T
)
]
ln(
C
)
E
a/
RT
ln
=
−
(2)where C is a constant, Ea is the activation energy, and R is the universal gas constant (8.314 J/K/mol). It
shows that Ea is an important parameter that controls the temperature dependence of the reaction rate.
There are two ways to determine Ea of a chemical reaction. The first way is by obtaining the temperature
function k(T), plotting ln[k(T)] as a function of 1/T and, and finding the slope –Ea/R and the intercept
ln(C) by linear regression analysis, which is known as the Arrhenius plot. A second way is by using the Arrhenius plot of the reaction rate directly (which is usually easier to obtain than k(T)) because:
) ln( ) ln( ]) [ ln( ]) ([ ln(kT1×g A − kT2×g A = kT1 − kT2 (3)
It is important to note that not all chemical reactions follow the Arrhenius law (Eq. 2), and a true Arrhenius behaviour is only expected from single-phase reactions. In concrete, the temperature functions
for the hydration of cement composites are not well understood, and may not follow the Arrhenius law [5,7,13]; e.g., cement consists of four main chemical phases, each reacting with water at different rates. Furthermore, when the temperature function is not independent of the degree of reaction, the reaction rate cannot be described by two independent functions as shown in Eq. 1. There are then two approaches to deal with these non-Arrhenius reactions.
The first approach is to determine an apparent Ea in the same manner as for Arrhenius-like reactions,
allowing one to assess the temperature sensitivity of that reaction. The value of Ea is then expected to
depend on the selected temperature range (e.g. from T1 to T2), as shown in Eq. 4. The second approach is
to determine the apparent Ea from the reaction rates at given degrees of reaction [4,5], as shown in Eq. 5.
In this case, Ea is expected to depend on the selected temperature range and [A]. In concrete, the degree of
reaction [A] in these equations is analogous to the development stage of some concrete properties, such as degree of hydration and compressive strength, and Eq. 5 will yield the activation energy as a function of both temperature range and the development stage of the given property.
[
] [
]
)
/
1
/
1
(
)
(
ln
)
(
ln
1 2 2 1T
T
T
k
T
k
R
E
a−
−
=
(4)[ ]
[
] [
]
)
/
1
/
1
(
)
(
ln
)
(
ln
1 2 2 ] [ 1 ] [T
T
T
Rate
T
Rate
R
A
E
a A A−
−
=
(5)2.2. Cement hydration modeling approach
The first maturity formulation, known as the Nurse-Saul maturity function (or time-temperature factor), grew out of experimental observations of the combined effect of temperature and time on the compressive strength of concrete [14], and its early development was documented in a critical review by Malhotra (1974) [1, 2]. One major drawback of this maturity formulation is the lack of physical meaning, being a simple product of temperature and time. Freiesleben-Hansen and Pedersen (1977) [15] provided insights
into the physical meaning of maturity by modeling the rate of cement hydration α, in analogy with a chemical reaction (similar to Eq. 1):
) ( ) (
α
α
g T k dt d T × = (6)where the effect of temperature k(T) and the effect of degree of hydration g(α) were assumed to affect the hydration rate independently. This assumption led to a major breakthrough in the development of the maturity method: the degree of hydration could be quantified by integrating its temperature function over time:
∫
∫
= t o d T k g d 0 )) ( ( ) (α
τ
τ
α
α (7)Equation 7 further led to the definition of maturity as being the integration of a temperature function over time, proportioned by a constant obtained at a reference temperature:
τ
τ
d T k T k t M t ref∫
= 0 ( ) )) ( ( ) ( (8)where Tref is a reference temperature, T is the actual temperature of concrete varying with time t. Note that
this definition of maturity would be directly correlated to the degree of hydration provided that Eq. 7 holds true. Equation 8 allows one to formulate maturity indices by using different temperature functions. For instance, Freiesleben-Hansen and Pedersen [15] further proposed the Arrhenius temperature function for cement hydration and, consequently, the maturity index became known as the equivalent age, as follows:
( )
τ
dτ
T T R E t M t ref a∫
⎟⎟ ⎠ ⎞ ⎜ ⎜ ⎝ ⎛ ⎟ ⎟ ⎠ ⎞ ⎜ ⎜ ⎝ ⎛ + − + = 0 273 1 273 1 exp ) ( (9)Several temperature functions have been suggested and were summarized by Jensen and Hansen (1999) [7]; however, only the linear Nurse-Saul maturity function, for its simplicity, and the Arrhenius temperature function (Eq. 9), for its accuracy, are now widely accepted and adopted by ASTM and RILEM specifications.
Compared to the wide acceptance of the specific maturity formulation of Eq. 9, the more general definition of maturity (Eq. 8), however, did not receive as much attention. Equation 8 not only provides a physical meaning to maturity, but also allows the formulation of new maturity indices when more accurate temperature functions k(T) become available as the understanding of cement hydration improves. More importantly, choosing an adequate temperature function is more fundamental to the maturity formulation than choosing a value of the activation energy, which bears the assumption that cement hydration simply follows the Arrhenius behaviour. If a temperature function of the development of a concrete property can be obtained over time, then it can be used directly to calculate the maturity index with Eq. 8, without the need to determine Ea. This is in contrast with the prevalent understanding of Ea,
which is almost treated as an intrinsic property of concrete due to the wide application of Eq. 9.
2.3. Compressive strength modeling approach
Instead of using the degree of hydration rate model (Eq. 6), Carino et al. [12,16,17] proposed to determine the temperature function directly from a strength development model:
) ( ) ( 1 ) ( ) ( ) ( o o u t t T k t t T k S t S − × + − × = (10)
where S(t) is the compressive strength at time t, k(T) is the temperature function, to is the time at which
the strength starts to develop, and Su is the ultimate compressive strength. The calculation procedure
includes two steps: (1) the determination of K(T) from the initial slopes of the relative strength S/Su curves
Arrhenius plot of the obtained temperature function. It is interesting to note that the obtained temperature function k(T) is not used to formulate the maturity index with Eq. 8, but to calculate Ea instead, which in
turn is used to construct an Arrhenius temperature function. ASTM C1074 adopted this procedure to determine Ea of concrete from testing mortar samples, because mortar samples were experimentally found
to yield results similar to those for concrete samples [18]. This compressive strength modeling approach could potentially be extended to formulate maturity indices of a concrete property P in general, provided that the temperature function f(T) is found from the development of that property.
Our further examination of the development rate of the relative compressive strength, as shown in Eq. 11, has shown that the initial slope K(T) is indeed the temperature function by analogy with Eq. 1. This also reveals that the development rate is determined by two independent functions of temperature and relative strength, which in turn leads to two important facts about the strength development model: (i) Ea can also
be calculated from the slopes at any levels of relative strength (e.g., the slopes at 50% of the ultimate strength at each temperature); and (ii) a direct link between compressive strength and maturity can be established, as shown by Eq. 12, which is achieved by using the general definition of maturity (Eq. 8):
) ) ( ( ) ( ) ( 1 ) ( ) ( 2 u u u S t S g T k S t S T k S t S dt d = × ⎟⎟ ⎠ ⎞ ⎜⎜ ⎝ ⎛ − × = (11) u u S t S t t
S
t
S
S
t
S
d
d
T
k
t
M
u)
(
1
)
(
)
1
(
)
(
)
(
/ ) ( 0 2 0−
=
−
=
∝
∫
∫
ξ
ξ
τ
(12)In light of the above examinations, it is clear that there may not be a single maturity index or a single value of activation energy that is valid for all the properties of a given concrete. The maturity for each property of a given concrete should ideally be formulated by its own temperature function. The main objectives of the following experimental program are: (i) to address the above theoretical examination,
particularly on the activation energy, and (ii) to develop a new approach in order to apply the maturity method in a simple and practical way that is consistent with the physical concepts.
3. EXPERIMENTAL INVESTIGATIONS
The experimental program was designed to determine the activation energy of three key mechanical properties of a typical HPC, namely compressive strength, splitting tensile strength, and modulus of elasticity. Additional experimental evidence for the degree of hydration will also be provided.
3.1. Preparation of specimens and testing
The concrete mix design included ASTM Type I cement, a w/c ratio of 0.34, and a cement-sand-coarse aggregate ratio of 1:2:2 by dry weight of materials. The detailed mixture proportions are provided in Table 1, which also indicates the concrete slump, air content and density measured after casting, and the compressive strength measured at 7 days (50 MPa). Over 105 concrete cylinders (100x200 mm) were made from one single batch of concrete to minimize the variability in the test results.
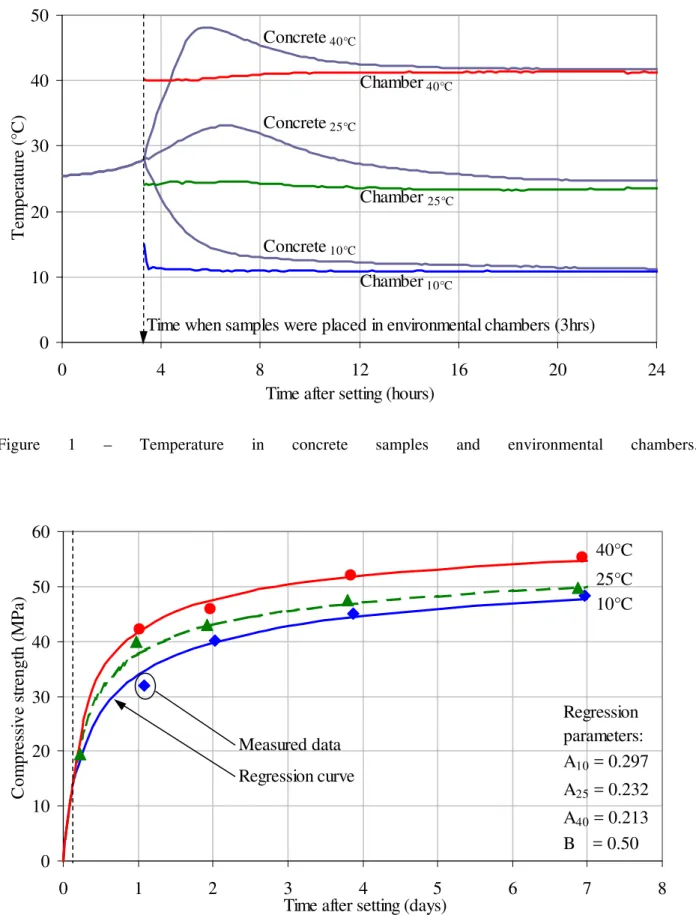
After casting the concrete in the plastic moulds, the samples were left at ambient room temperature (25°C) and sealed with plastic covers to prevent drying in order to reduce the effect of moisture gradients on maturity. A setting time of 4.5 hours was determined for this concrete from measurements of concrete temperature at the centre of 100x200 mm cylinders. Concrete was assumed to have set when the concrete temperature started to increase steadily, due to the initiation of the exothermic phase of cement hydration. Approximately 3 hours after setting, the concrete samples were strong enough to be moved into their respective curing environment. For this, three equal groups of concrete samples (with their moulds and covers) were stored in three environmental chambers with temperatures previously set to 10°C, 25°C and 40°C and maintained as such until the time of testing. This procedure ensured that the concrete samples had the same properties at the onset of strength development for a better comparison. For instance, if the samples had been placed in the temperature chambers immediately after mixing, by the time the strength
started to develop, the concrete samples would have acquired different degrees of hydration and microstructures, which would make the comparison difficult. The adopted procedure is also considered representative of real practice, in which measures are often taken to maintain the curing temperature for a certain time after casting before exposure to the ambient temperature.
The temperatures in the concrete cylinders and the environmental chambers were monitored continuously with embedded thermocouples. The compressive strength (ASTM C39) and modulus of elasticity (ASTM C469) of the concrete were tested on 2 replicates each, and the splitting tensile strength (ASTM C496) on 3 replicates, at the ages of 1, 2, 4, 7, and 28 days, for each of the 3 curing temperatures. This procedure was selected in order to minimize the volume of concrete required to make the cylinders and the time needed to prepare them. For a given test, however, if the difference in the results between one replicate and the average of the replicates exceeded about 10%, a spare sample was tested to increase the confidence in the average value.
For the assessment of the degree of cement hydration developing over time, cement paste samples were prepared separately from the concrete cylinders, using the same cement and w/c ratio (Table 1). Note that the hydration of cement paste may not be necessarily identical to that of the corresponding concrete; however, it is not expected to significantly affect the value of Ea obtained from this set of hydration data,
and Ea from this test will provide supplementary information on temperature dependence. The paste
samples were cured at the 3 selected temperatures immediately after mixing until they were analyzed by combined Thermo-Gravimetric Analysis/Differential Thermal Analysis (TGA/DTA) at the ages of 0.5, 1, 2, 4 and 7 days. This procedure takes into account the fact that cement hydration starts immediately after mixing, while the mechanical properties of concrete develop after setting. The cement hydration tests were performed with a Q600 SDT thermal analyzer, in which the samples were heated from room temperature to 80°C at a rate of 10°C/minute, held at this temperature for 1 hour, and then heated to 1050°C at a rate of 10°C/minute under a dry nitrogen atmosphere. The percentage of Ca(OH)2 that
formed over time was used to quantify the degree of hydration [19] of the paste samples cured at different temperatures. It was determined from the following simplified cement hydration model for ordinary Portland cement (OPC), as shown in Eq. 13.
OPC + 2H2O = C-S-H + Ca(OH)2 (13)
3.2. Development of properties over time
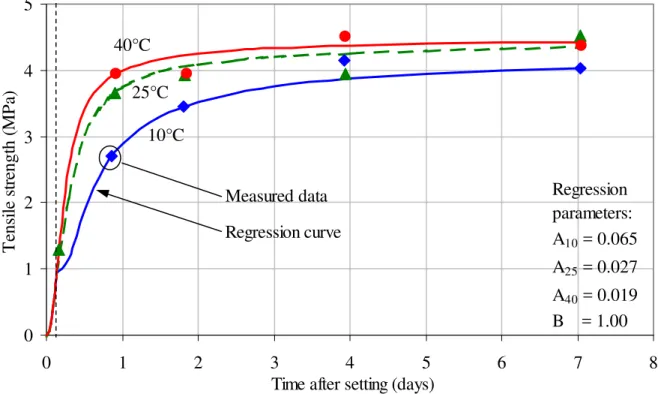
Figure 1 presents the concrete temperatures monitored for the 3 groups of cylinders and their respective curing temperatures during the first day (with curing temperatures maintained constant until testing). Figures 2 to 4 provide the test results obtained for the compressive strength, splitting tensile strength, and modulus of elasticity measured over time at the 3 curing temperatures, respectively. One can observe that, once the cylinders are installed in their respective environments (3 hours after setting, see vertical dash line), the single curve for 25°C splits into 3 different ones for each curing temperature. The effect of temperature on the development of these properties can readily be observed: the higher the temperature, the faster the properties develop, due to the cement hydration reactions progressing faster, especially at very early ages. This is supported by the test results in Figure 5 obtained for the degree of cement hydration.
Regression analyses were conducted to model the development of these properties as functions of time. Since the early-age development of HPC properties are of prime interest in this study, the analyses presented in this paper focus mainly on the results measured during the first 7 days. This ensured more accurate analyses and predictions for the period of interest, during which the properties of HPC developed relatively fast. The 28-day test results will be presented later in the paper as additional information. The following empirical exponential equation, adapted from the well-known relationship suggested by the CEB-FIB Model Code [20], was used to model the development of each selected property of concrete:
⎥ ⎥ ⎦ ⎤ ⎢ ⎢ ⎣ ⎡ ⎟ ⎟ ⎠ ⎞ ⎜ ⎜ ⎝ ⎛ ⎟ ⎠ ⎞ ⎜ ⎝ ⎛ − = B d t A P t P( ) 7 exp 1 7 (14)
where P(t) represents a given property as a function of time, P7d is the property value at 7 days, t is the
time elapsed after the setting time, and A and B are constants obtained by regression analysis, whose values are given in Figures 2 to 5. The obtained regression curves for the development of these properties were then used to determine the activation energy factors and develop the property-maturity relations. Note that by using the time elapsed after setting as the time zero in Eq. 14 ensures the validity of the model for concretes that may have different setting times.
3.3. Determination and examination of activation energy factors
Values of activation energy were determined by applying Eq. 5 to the test results, from which the activation energy Ea of these properties can be calculated as a function of two respective variables: the
temperature range and development stage of the property. For a given development stage (say, 30% of the 7-day value), Ea can be determined from the data for at least two different temperatures and, in this study,
they can be either 10-25°C, 10-40°C, 25-40°C, or 10-25-40°C. Similarly, for a given temperature range, Ea can also be calculated as a function of the development stage of the property. If the development of a
property had a true Arrhenius behaviour, these two different ways of calculating Ea from different
temperature ranges or from different development stages would yield identical values.
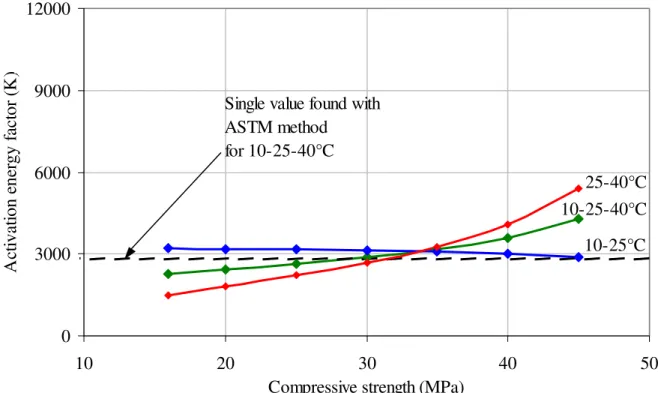
In the present paper, the above calculation procedure will be referred to as the Slope Method and the ratio Ea/R (in Eq. 5) will be referred to as the activation energy factor. The procedure is illustrated in Figure 6
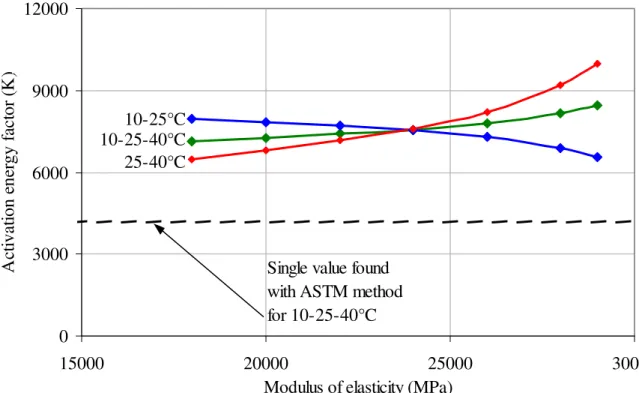
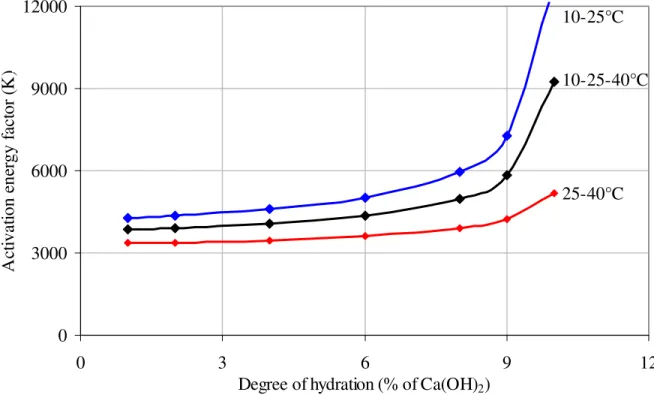
using the data for a specific compressive strength value of 16 MPa (i.e. 30% of the 7-day compressive strength at 25°C) for three temperature ranges: 10-25°C, 25-40°C, and 10-25-40°C. Figures 7 to 10 present the values of Ea/R obtained for compressive strength, tensile strength, elastic modulus, and degree
identified by 10-25-40°C is based on development rates from a 3-temperature range, and the two other curves are based on rates from the 2-temperature ranges (i.e. 10-25°C or 25-40°C). For comparison purposes, a single activation energy factor for each property was also calculated following the analysis method suggested by the ASTM C1074 standard, in which the activation energy was determined from the initial development rate only (taken at the time when the samples were put in the environmental chambers, being 3 hours after setting).
From the three temperature-based results, it can be seen that different properties have different ranges of Ea/R which vary as the properties develop, with values varying from 2256K to 4278K for compressive
strength, from 3763K to 7781K for tensile strength, from 7145K to 8435K for modulus of elasticity, and from 3845K to 9239K for degree of hydration. A further examination of the Ea/R values calculated from
different temperature ranges in Figures 7 to 10 indicates that the activation energy factor for each single property is temperature-dependent, i.e. different temperature ranges yielding different values for the same property. It is evident that the development of these properties did not follow a true Arrhenius behaviour. This was especially true for the splitting tensile strength showing a poor Arrhenius behaviour for the 10-40°C temperature range, which can be easily identified by the large gap between the 10-25°C and 25-40°C curves.
In order to further illustrate the temperature dependence of Ea, published data [12] were reviewed and
further examined. These data reported the initial development rate (KT) for the compressive strength of 6
water-cured concretes made with two water-cement ratios (0.45 and 0.60) and different types of cement. The reported Ea/R values were originally calculated using KT obtained under three curing temperatures
(10, 20 and 40°C). These original data were further analyzed by calculating Ea/R from the reported KT for
two of the three temperatures: 10-20°C and 20-40°C. These newly calculated Ea/R are shown in Table 2,
Ea/R values for the two temperature ranges can be as high as 132% in the type I cement concrete). There
is no uniform trend as to which temperature range yields the higher values of Ea/R, which may be due to
differences in w/c ratios, types of cementitious materials, and/or concrete additives or admixtures used.
The activation energy Ea, a term borrowed from physical chemistry, now used to describe the
development of concrete properties, has cost much effort in civil engineering community towards the search for a single value for concrete. However, the above results do convey important information on the activation energy: (i) different properties may have different Ea for a given concrete; (ii) different
concretes may have different Ea for a given property; and (iii) different development stage of a given
property of a given concrete may have different Ea. Therefore, any effort in looking for a “physically
accurate” Ea as a material parameter for the cement composites might be futile. Instead, one could look
for a “mathematically accurate” Ea for use in the maturity method in order to yield more accurate
predictions. This will be explored in the following section, with the main goal of developing an improved and practical application of the maturity method for the accurate prediction of different properties of concrete.
4. DEVELOPMENT OF BEST-FIT MATURITY APPROACH
To be useful, the maturity method requires a “unique” correlation independent of curing temperatures between the constructed maturity index (i.e. equivalent age) and the property of interest. Given the fact that the equivalent age (Eq. 9) is the most accepted maturity index for compressive strength, the proper selection of the activation energy (which is the only controlling variable) is a necessary step to achieve a unique correlation. As shown by the experimental data obtained in this study and elsewhere [12], however, Ea is not constant and could vary with the concrete mix design, concrete property, property
For theoretical consideration, it is therefore logical to use Ea(t) as a function of time in Eq. 9 to determine
maturity. Figure 11 actually shows the development of the compressive strength as a function of maturity calculated with such varying Ea (using the data in Fig. 7 for the 10-25-40°C temperature range). This is,
however, neither simple nor practical to determine a varying Ea for a given concrete property. A new
approach is therefore proposed to solve this apparent conflict between an ideal theoretical requirement and the real practical limitations.
The Best-Fit Maturity Method is proposed to establish a unique best-fit correlation between the constructed maturity index and a property of interest for an accurate prediction over time. It is achieved by mathematically optimizing the control variable(s) of the maturity index. The equivalent age maturity index is used in this paper to illustrate this method, for which the only controlling variable is the activation energy. The steps are summarized below:
1) Test the concrete property of interest as a function of time under different curing temperatures (3 temperatures are suggested);
2) Determine the best-fit relationship for the concrete property as a function of time (such as Eq. 14), using the experimental data obtained at the reference temperature;
3) Calculate the maturity values with the selected maturity index (such as Eq. 9) for the times at which the property was measured in the laboratory, using an initial arbitrary value for the activation energy factor (say 4000K);
4) Predict the property by substituting all the maturity values in the best-fit relationship; 5) Calculate the mean prediction error from within all pairs of predicted and measured values;
6) Solve for the value of the activation energy factor yielding the smallest mean error, by updating its previous value, which can easily computed in a simple spreadsheet program.
This procedure is used to obtain a value of Ea that minimizes the difference between the predicted values
and measured values from testing specimens cured under three different temperatures. Note that another mathematical approach was used earlier by Wirquin et al. in 2002 [21] for specimens cured under two different curing temperatures, which determined a value of Ea that minimized the difference between
various pairs of calculated equivalent ages. Among the six steps in the present procedure, Steps 2 to 4 are the same as those in the conventional maturity method. Practically speaking, the main goal of the new approach is to force the 3 obtained curves of the property (measured as functions of time under different curing temperatures) to collapse into one single curve as a function of maturity (as best as the selected maturity formulation allows). In fact, the fundamental assumption behind the Best-Fit Maturity Method is indeed different from the main assumption behind the conventional maturity concept. In the conventional maturity concept [14], it is assumed that specimens of a given concrete cured under different temperature histories will achieve the same strength if they achieve the same maturity. In the Best-fit Maturity Method, on the other hand, it is assumed that specimens of a given concrete cured under different temperature histories will achieve the same maturity if the property achieve the same level of development. Based on this “reversed” concept, a maturity index that provides a unique correlation with the property development can be established by adjusting its control variable(s) mathematically.
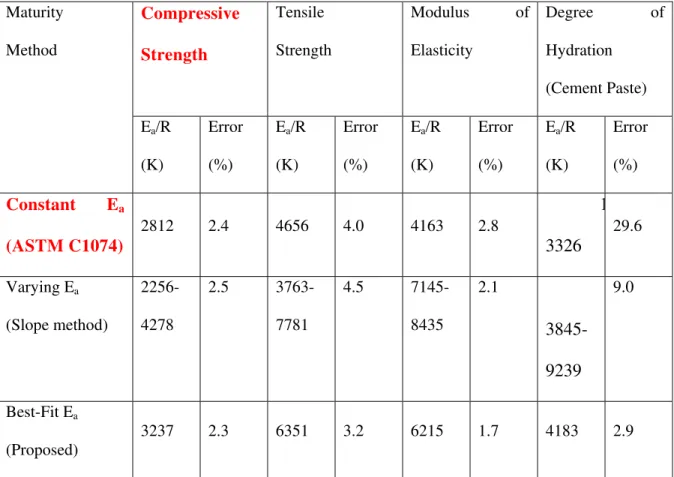
Figures 12 to 15 illustrate the relationship between each property and its maturity formulated by the Best-Fit Maturity Method. Whether it is the compression strength, splitting tensile strength, modulus of elasticity or degree of hydration, each property is accurately correlated to its maturity for the concrete samples cured at different temperatures. It can be seen that the predictions of compressive strength over time with the Best-Fit Maturity Method (Fig. 12) are as accurate as the predictions made with the less practical approach using the varying Ea (Fig. 11). Table 3 lists the activation energy factors and mean
prediction errors for the selected properties by different maturity methods, namely the ASTM calculation method (Ea at initial slope), the Slope Method (varying Ea/R) and the proposed Best-Fit Method
other methods for all the properties investigated in this study. It also illustrates the applicability of the proposed method to any properties of a given concrete.
It is important to note that the activation energy is treated in this new approach only as a variable (not a material property) that is to be adjusted mathematically to achieve the maturity that has the best correlation with the property of interest. Although it is considered as a mathematical variable in the proposed approach, the activation energy would bear the same physical meaning as the activation energy used in Eq. 9. As a final remark, the nature of the proposed approach also allows its user to select maturity indices, control variables and concrete models that are different from those used in this paper, for which further research is needed.
5. CONCLUSIONS
Through the critical examination of the activation energy and the maturity method, and by additional verification with existing and new experimental data, the main findings about activation energy in concrete include the following:
i) Different properties may have different Ea for a given concrete;
ii) Different concretes may have different Ea for a given property; and
iii) Different development stage of a given property may have different Ea.
In summary, there exists no single value of activation energy for all the properties of concrete or different concrete formulations. A new approach of applying the maturity method has been proposed by mathematically adjusting the value of the control parameter in the selected maturity formulation. It is based on the new concept that different specimens of a given concrete cured under different temperature histories will achieve the same maturity if the property of interest achieves the same level of development, which is the “reverse” of the conventional maturity concept. In the proposed approach, the maturity is not treated as a material property, but regarded as parameter that yields the best correlation
with the property of interest regardless of the temperature history. Using this new approach, very accurate predictions were obtained for the experimental data developed in the study.
6. REFERENCES
[1] Malhotra, V. M., “Maturity concept and estimation of concrete strength: a review- 1,” Indian Concrete Journal, April 1974, pp. 122-126.
[2] Malhotra, V. M., “Maturity concept and estimation of concrete strength: a review- 2,” Indian Concrete Journal, May 1974, pp. 155-159.
[3] Delatte, N. J, Williamson, M. S., and Fowler, D.W., “Bond strength development with maturity of high-early-strength bonded concrete overlays,” ACI Materials Journal, 97, 2000, pp. 201-207. [4] Kada-Benameur, H., Wirquin, E., and Duthoit, B., “Determination of apparent activation energy of
concrete by isothermal calorimetry,” Cement and Concrete Research,” 30 (2), 2000, pp. 301-305. [5] Kjellsen, K. O. and Detwiler, R. J., “Reaction kinetics of Portland cement mortars hydrated at
different temperatures,” Cement and Concrete Research,” 22 (1), 1992, pp. 112-120.
[6] Laplante, P. and Boulay, C. E. “Evolution of the thermal expansion coefficient of concrete as a function of its maturity at very early ages,” Materials and Structures, 27 (174), 1994, pp. 596-605.
[7] Jensen, O. M. and Hansen, P. F., “Influence of temperature on autogenous deformation and relative humidity change in hardening cement paste,” Cement and Concrete Research, 29 (4), 1999, pp. 567-575.
[8] Pane, I., and Hansen, W., “Concrete hydration and mechanical properties under nonisothermal conditions,” ACI Materials Journal, 99 (6), 2002, pp. 534-542.
[9] Pinto, R. C. A., and Hover, K. C., “Application of maturity approach to setting time,” ACI Materials Journal, 96 (6), 1999, pp. 686-691.
[10] Turcry, P., Loukili, A., Barcelo, L., and Casabonne, J. M., “Can the maturity concept be used to separate the autogenous shrinkage and thermal deformation of a cement paste at early age?” Cement and Concrete Research, 32 (9), 2002, pp. 1443-1450.
[12] Carino, N. J and Tank, R. C., “Maturity functions for concrete made with various cements and admixtures,” ACI Materials Journal, 89 (2), 1992, pp. 188-196.
[13] Schindler, A. K., “Effect of temperature on hydration of cementitious material,” ACI Materials Journal, 101 (1), 2004, pp. 72-81.
[14] Saul, A. G. A., “Principles underlying the steam curing of concrete at atmosphere pressure”, Magazine of Concrete Research, March 1951, pp. 127-140.
[15] Freiesleben-Hansen, P. and Pedersen, E. J., “Maturity computer for controlled curing and hardening of concrete,” Nordic Concrete Research, 1, 1977, pp. 21-25.
[16] Carino, N. J., "The maturity method: theory and application," Journal of Cement, Concrete, and Aggregates, 6 (2), 1984, pp. 61-73.
[17] Carino, N. J. and Lew, H. S., “Temperature effects on strength-maturity relations of mortar,” ACI Materials Journal, 80 (3), 1983, pp. 177-182.
[18] Tank, R. C. and Carino, N.J. “Rate constant functions for strength development of concrete, ACI Materials Journal, 88 (1), 1991, pp.74-83.
[19] Taylor, H.F.W., Cement Chemistry, 2nd Ed., Thomas Telford, 1997, pp. 199-200.
[20] CEB-FIB, “CEB-FIP Model Code 1990”, Information Bulletin No. 213/214, Euro-International Concrete Committee, Lausanne, 1993, 437 p.
[21] Wirquin, E., Broda, M., and Duthoit, B., “ Determination of the apparent activation energy of concrete by calorimetric and mechanical means Influence of a superplasticizer,” Cement and Concrete Research, 32, 2002, pp. 1207-1213.
1.1.1.1 LIST OF TABLES
Table 1 – Concrete mix design (w/c=0.34).
Table 2 – Rates and activation energy factors calculated for the compressive strength of different concretes from original data of Carino and Tank (1992). Table 3 – Activation energy factors and errors calculated with different methods.
1.1.1.2 LIST OF FIGURES
Figure 1 – Temperature in concrete samples and environmental chambers.
Figure 2 – Compressive strength measured for 3 curing temperatures. Figure 3 – Splitting tensile strength measured for 3 curing temperatures. Figure 4 – Modulus of elasticity measured for 3 curing temperatures. Figure 5 – Degree of hydration measured for 3 curing temperatures. Figure 6 – Determination of activation energy factor (specific example). Figure 7 – Activation energy factors for compressive strength.
Figure 8 – Activation energy factors for splitting tensile strength. Figure 9 – Activation energy factors for modulus of elasticity. Figure 10 – Activation energy factors for degree of hydration.
Figure 11 – Compressive strength as a function of maturity (Slope Method). Figure 12 – Compressive strength as a function of maturity (Best-Fit Method).
Figure 13 – Splitting tensile strength as a function of maturity (Best-Fit Method).
Figure 14 – Modulus of elasticity as a function of maturity (Best-Fit Method). Figure 15 – Degree of hydration as a function of maturity (Best-Fit Method).
Table 1 – Concrete mix design (w/c=0.34).
Constituents Proportions Properties
Mix water
Cement (ASTM Type I) Fine aggregate (5 mm max.) Coarse aggregate (20 mm max.) Superplasticizer (dry) 21.3 kg 62.5 kg 125.0 kg 125.0 kg 2.1 kg Slump Air content Density Compressive strength at 7 days 185 mm 4 % 2452 kg/m3 50 MPa
Table 2 – Rates and activation energy factors calculated for the compressive strength of different concretes from original data of Carino and Tank (1992).
W/C=0.45
W/C=0.60 Cement Type T (°C) KT (1/day) Ea/R10-20°C (K) Ea/R20-40°C (K) Difference in Ea/R KT (1/day) Ea/R10-20°C (K) Ea/R20-40°C (K) Difference in Ea/R Type I 10 0.202 86% 0.212 132%20 0.401 4969 0.336 3204 40 2.673 9218 1.482 7419 10 0.205 0.153 20 0.351 3598 0.287 4361 Type II 40 1.641 7938 121% 0.911 5613 29% 10 0.523 0.508 20 0.844 3620 0.832 3575 Type III 40 3.313 6030 67% 3.204 6244 75% 10 0.231 0.176 20 0.623 7190 0.291 3978 Type I + 20% fly ash 40 0.868 1573 -78% 0.642 3557 -11% 10 0.131 0.057 20 0.194 3106 0.113 5176 Type I + 50% slag 40 0.902 6335 104% 0.599 7523 45% 10 0.381 0.249 20 0.659 4334 0.397 3690 Type I +
accelerator
40 2.689 5796 34% 2.004 7116 93% 10 0.206 0.153 20 0.367 4568 0.286 4732 Type I + retarder 40 1.117 4685 3% 0.835 4622 -2%Table 3 – Activation energy factors and errors calculated with different methods.
Compressive
Strength
Tensile Strength Modulus of Elasticity Degree of Hydration (Cement Paste) Maturity Method Ea/R (K) Error (%) Ea/R (K) Error (%) Ea/R (K) Error (%) Ea/R (K) Error (%)Constant E
a(ASTM C1074)
2812 2.4 4656 4.0 4163 2.81
3326
29.6 Varying Ea (Slope method) 2256-4278 2.5 3763-7781 4.5 7145-8435 2.13845-9239
9.0 Best-Fit Ea (Proposed) 3237 2.3 6351 3.2 6215 1.7 4183 2.90
10
20
30
40
50
0
4
8
12
16
20
24
Time after setting (hours)
T
em
p
er
at
u
re (
°C
)
Concrete
25°CTime when samples were placed in environmental chambers (3hrs)
Concrete
40°CConcrete
10°CChamber
10°CChamber
25°CChamber
40°CFigure 1 – Temperature in concrete samples and environmental chambers.
0
10
20
30
40
50
60
0
1
2
3
4
5
6
7
Time after setting (days)
C
om
pr
es
si
ve
s
tr
engt
h (
M
Pa)
.
Regression
8
parameters:
A
10= 0.297
A
25= 0.232
A
40= 0.213
B = 0.50
10°C
40°C
25°C
Regression curve
Measured data
Figure 2 – Compressive strength measured for 3 curing temperatures.
0
1
2
3
4
5
0
1
2
3
4
5
6
7
Time after setting (days)
T
ens
il
e s
tr
engt
h (
M
P
a)
.
Regression
8
parameters:
A
10= 0.065
A
25= 0.027
A
40= 0.019
B = 1.00
10°C
40°C
25°C
Regression curve
Measured data
0 10000 20000 30000 40000 0 1 2 3 4 5 6 7 8
Time after setting (days)
M
odul
us
of
el
as
ti
ci
ty
(
M
P
a)
.
Regression
parameters:
A
10= 0.306
A
25= 0.164
A
40= 0.096
B = 0.50
10°C
40°C
25°C
Regression curve
Measured data
Figure 4 – Modulus of elasticity measured for 3 curing temperatures.
0
3
6
9
12
0 1 2 3 4 5 6 7Time after casting (days)
D
egr
ee
of
hydr
at
ion (
%
C
a(
O
H
)
2)
.
Regression
8parameters:
A
10= 0.026
A
25= 0.006
A
40= 0.002
B = 2.00
10°C
40°C
25°C
Regression curve
Measured data
Figure 5 – Degree of hydration measured for 3 curing temperatures.
3.50
3.75
4.00
4.25
4.50
0.0031
0.0032
0.0033
0.0034
0.0035
0.0036
1 / Temperature (1/K)
Ln
(K
)
E
a/R = 2256 K
for 10-25-40°C
(R
2= 95%)
Data for compressive strength of 16 MPa
(30% of ultimate value)
E
a/R = 1469 K
for 25-40°C
E
a/R = 3212 K
for 10-25°C
0
3000
6000
9000
12000
10
20
30
40
50
Compressive strength (MPa)
A
ct
iv
at
ion e
n
er
gy f
act
or
(
K
)
.
Single value found with
ASTM method
for 10-25-40°C
10-25-40°C
10-25°C
25-40°C
Figure 7 – Activation energy factors for compressive strength.
0
3000
6000
9000
12000
0
1
2
3
4
5
Tensile strength (MPa)
A
ct
iv
at
ion e
n
er
gy f
act
or
(
K
)
.
Single value found with
ASTM method
for 10-25-40°C
10-25-40°C
10-25°C
Figure 8 – Activation energy factors for splitting tensile strength.
0
3000
6000
9000
12000
15000
20000
25000
30000
Modulus of elasticity (MPa)
A
ct
iv
at
ion e
n
er
gy f
act
or
(
K
)
.
Single value found
with ASTM method
for 10-25-40°C
10-25-40°C
10-25°C
25-40°C
0
3000
6000
9000
12000
0
3
6
9
Degree of hydration (% of Ca(OH)
2)
A
ct
iv
at
ion ene
rgy f
ac
tor
(
K
)
.
10-25-40°C
10-25°C
25-40°C
12
Figure 10 – Activation energy factors for degree of hydration.
0
10
20
30
40
50
60
0
7
14
21
28
Maturity (days)
C
om
pr
es
si
ve s
tr
engt
h (
M
P
a)
.
Estimated compressive strength
Measured data for the 3 temperatures
Figure 11 – Compressive strength as a function of maturity (Slope Method).
0
10
20
30
40
50
60
0
7
14
21
28
Maturity (days)
C
om
pr
es
si
ve s
tr
engt
h (
M
P
a)
.
Estimated compressive strength
Measured data for the 3 temperatures
0
1
2
3
4
5
0
7
14
21
28
Maturity (days)
T
ens
il
e s
tr
engt
h (
M
Pa)
.
Estimated tensile strength
Measured data for the 3 temperatures
Figure 13 – Splitting tensile strength as a function of maturity (Best-Fit Method).
0
10000
20000
30000
40000
0
7
14
21
28
Maturity (days)
M
odul
us
of
e
las
ti
ci
ty (
M
Pa)
.
Estimated modulus of elasticity
Measured data for the 3 temperatures
Figure 14 – Modulus of elasticity as a function of maturity (Best-Fit Method).


![[PDF] Cours Eclipse pas à pas pour débutant | Formation informatique](data:image/gif;base64,R0lGODlhAQABAIAAAP///wAAACH5BAEAAAAALAAAAAABAAEAAAICRAEAOw==)