Publisher’s version / Version de l'éditeur:
Vous avez des questions? Nous pouvons vous aider. Pour communiquer directement avec un auteur, consultez la première page de la revue dans laquelle son article a été publié afin de trouver ses coordonnées. Si vous n’arrivez pas à les repérer, communiquez avec nous à [email protected].
Questions? Contact the NRC Publications Archive team at
[email protected]. If you wish to email the authors directly, please see the first page of the publication for their contact information.
https://publications-cnrc.canada.ca/fra/droits
L’accès à ce site Web et l’utilisation de son contenu sont assujettis aux conditions présentées dans le site
LISEZ CES CONDITIONS ATTENTIVEMENT AVANT D’UTILISER CE SITE WEB.
Proceedings of 5th European and African Conference on Wind Engineering, 2009-07-23
READ THESE TERMS AND CONDITIONS CAREFULLY BEFORE USING THIS WEBSITE.
https://nrc-publications.canada.ca/eng/copyright
NRC Publications Archive Record / Notice des Archives des publications du CNRC :
https://nrc-publications.canada.ca/eng/view/object/?id=72cad900-4a53-4f6f-8450-1c3d9f5449a5 https://publications-cnrc.canada.ca/fra/voir/objet/?id=72cad900-4a53-4f6f-8450-1c3d9f5449a5
NRC Publications Archive
Archives des publications du CNRC
This publication could be one of several versions: author’s original, accepted manuscript or the publisher’s version. / La version de cette publication peut être l’une des suivantes : la version prépublication de l’auteur, la version acceptée du manuscrit ou la version de l’éditeur.
Access and use of this website and the material on it are subject to the Terms and Conditions set forth at Wind tunnel testing of an inclined aeroelastic cable model-Pressure and motion characteristics, Part I
Nikitas, N.; Macdonald, J. H. G.; Anderson, T. L.; Jakobsen, J. B.; Savage, M.G.; McAuliffe, Brian R.
EACWE 5 Florence, Italy 19th – 23rd July 2009
Flying Sphere image © Museo Ideale L. Da Vinci
Keywords: Cable aerodynamics, inclined circular cylinder, critical Reynolds number.
ABSTRACT
The current paper considers large vibrations of circular cylinders, inclined and yawed to the flow. The case of a nominally perfect cylinder prone to galloping-like instabilities, when subjected to some critical flow conditions, is seemingly a paradox since symmetry and aerodynamic galloping are contradictory. Symmetry-breaking parameters in the flow geometry were suspected to be associated with triggering mechanisms of such vibration phenomena. A series of wind tunnel tests was performed on a full-scale inclined spring-supported cable model for a range of conditions in order to assess this idea further. We herein describe the experimental setup, present deduced results and attempt to provide explanations for the observed behaviour in the light of established knowledge in the field. We use instantaneously recorded pressure measurements to map flow transitions, recover energetic structures around the cylinder body and examine force correlations. Incidents of large response with negative aerodynamic damping are examined considering axial flow, spanwise vortex shedding and Reynolds number influences.
Contact person: N.Nikitas, University of Bristol, Queens Building, University Walk, BS8 1TR, Bristol, UK, Tel: +44 117 331 7396, Fax: +44 117 928 7783, E-mail [email protected]
Wind tunnel testing of an inclined aeroelastic cable model-
Pressure and motion characteristics, Part I
N. Nikitas, J.H.G. Macdonald, T.L. Andersen, J.B. Jakobsen, M.G. Savage,
B.R. McAuliffe
Department of Civil Engineering, University of Bristol, UK – [email protected] – Department of Civil Engineering, University of Bristol, UK – [email protected] – Department of Mechanical and Structural Engineering and Material Science, University of Stavanger, Norway – [email protected] – Department of Mechanical and Structural Engineering and Material Science, University of Stavanger, Norway – [email protected] – Aerodynamics Laboratory, National Research Council Canada, Ottawa, Canada – [email protected] – Aerodynamics Laboratory, National Research Council Canada, Ottawa, Canada – [email protected]
1 INTRODUCTION
1.1 Background.
Wind-induced vibrations of inclined cables have attracted much attention since the 1980’s because of numerous large amplitude incidents observed on existing cable-stayed bridges, raising concern for their long-term structural integrity. Predicting and preventing such large-scale motions necessitates a formulation of the driving parameters of such phenomena. It is well established that rain and ice accretion have a major impact as driving conditions by imposing an aerodynamically unstable profile that could trigger classical Den Hartog galloping. Still, there are cases of dry unstable cable vibrations that demonstrate the influence of additional factors not yet fully understood. Intuitively the similarity to classical galloping could be recovered if an asymmetry could arise in the system and since the cable nominally has perfect cylindrical symmetry, such asymmetry was sought in microstructural (boundary layers, separation points) and macrostructural (vortex shedding) features of the flow.
Recent treatises ascribe the so-called dry galloping to a series of flow related parameters. Matsumoto et al. (1992, 1995, 2005) first documented and explored the potential of axial flow on the leeward side of the cylinder and of unconventional vortex shedding of long period, axially propagating and combining with conventional vortex shedding, in relation to large responses. The generation of these phenomena were ascribed to the cylinder inclination and yaw towards the wind direction. Taking another approach, Larose et al. (2003) identified the significance of the critical Reynolds number range, associating the unstable region of flow transitions in the shear and boundary layer with large responses. The steady lift appearing in this regime could well be a cause of unstable behaviour. Strong coupling between the aforementioned phenomena renders the problem of explaining and predicting the aeroelastic response difficult to solve.
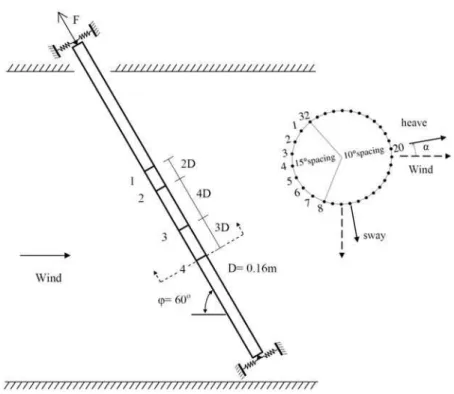
Figure 1: Elevation of cable model showing pressure tap arrangement.
Previous wind tunnel tests in 2001, hereafter referred as Phase 1, conducted on a 6m aeroelastic model of a full-scale inclined cable model in the National Research Council Canada (NRC) 3m × 6m open circuit propulsion wind tunnel, produced data of significant vibrations including a recording of
seemingly divergent character, see Cheng et al. (2003). This case, which appeared to be of the so-called dry galloping phenomenon proved to be non-reproducible in repeated runs. The Phase 1 tests covered a range of test scenarios varying the inclination angle (φ=35°, 45° and 60°), structural damping ratio (0.02% < ζ < 1.0%), support spring orientation and surface roughness, with wind speeds spanning the critical Reynolds number range. Various attempts have been made to explain the significant vibrations observed. To complement Phase 1 dynamic tests, a new test series of static tests, referred to as Phase 2, was undertaken in the NRC 2m × 3m closed circuit wind tunnel. The aim was to gain further insight into the cable forcing by testing a similarly inclined static cylinder equipped with pressure measurement taps.
The mean static force coefficients deduced, were used by Macdonald & Larose (2008a, b) in a newly proposed generalized quasi-steady galloping framework to identify instability regions. The case of large response was adequately predicted. This success indicated that the variability of the static force coefficients as a function of Reynolds number could be enough to explain dry-cable galloping. Further Andersen et al. (2008) extracted the effective average static coefficients from the mean response in the dynamic tests. The method yielded reasonable agreement with the pressure measurements from the static tests, indicating similar mechanisms operating in both cases. In a distinct approach, Jakobsen et al. (2003, 2005) utilized the unsteady force components contained in the static measurements to show that they too could cause large responses.
The current paper and its companion Part II by Jakobsen et al. (2009) deal with a new series of tests, Phase 3, using the same large-scale aeroelastic model as in Phase 1, but additionally instrumented with pressure taps and covering a different range of parameters to extend the previous knowledge. Thus the unsteady pressure measurements from the actual moving model included the motion-induced forces, which could be used to validate their effect in comparison with previous outcomes and possibly recover the real flow structures that interact with the cable, setting it into motion. In this paper, the test details are presented, large response incidents are identified and subsequently the origin and underlying mechanism of the unstable behaviour is discussed.
The Phase 3 tests were carried out under a collaborative project between NRC, Canada, the University of Stavanger, Norway and the University of Bristol, UK.
1.2 Experimental setup.
The cable model adopted typical properties of a full-scale bridge cable, including the mass per unit length (approximately 60kg/m), diameter (D=160mm), surface finish (smooth HDPE duct) and natural frequency (approximately 1.4Hz). The aspect ratio (L/D) was approaching 40, which according to the rationale of Larose et al. (2003) is sufficient to minimise contamination of pressure data by end effects. The wind speed range for most tests was 10-40m/s, corresponding to Reynolds numbers of 1.1×10⁵ to 4.2×10⁵, spanning the expected critical Reynolds number range. The cable was mounted on spring supports at either end, allowing motion in “sway” and “heave” directions normal to the cable axis (see Figure 1). A cable support was additionally provided at the top to carry the axial component of the cable weight. Structural damping ratios were intended to be low to allow for aeroelastic effects to be better distinguished. Values ranged between 0.06-0.33% for low amplitude response. It should be noted that the values significantly increased for high levels of response. Since the orientation relative to gravity is assumed not to be important for the aerodynamic behaviour of a dry cable, the three-dimensional geometry of an inclined cable in a skew wind can be transformed into a cable-wind angle (φ), equal to the cable inclination angle in the wind tunnel, and the orientation of the principal vibration axes relative to the cable-wind plane (α). For identical natural frequencies in the two vibration planes, the orientation of the principal axes is arbitrary. However, real cables have slight detuning of the natural frequencies in the vertical and horizontal directions due to the cable sag. This was modelled with slightly different spring stiffness of the model in the two directions. With the detuning, the orientation of the principle axes becomes significant. The range of detuning between the natural frequencies in the two planes was up to approximately 3%. To cover a range of possible geometric arrangements, the cable was tested at three different inclination angles expanding the
Phase 1 range. Values of φ were 60°, 77° and 90°, with 60° being tested again to cover the record of seemingly divergent response in Phase 1. The support spring rotation angles were chosen as 0° and 54.7° for φ= 60° and 0°, 30° for the other inclinations. It was identified that the principal axes in most records did not coincide with the rotated spring axes. For each inclination angle, a set of tests was also taken with the model fixed in position, to measure the forces on the stationary cylinder for comparison with the corresponding dynamic case.
The pressure measurement instrumentation included 162 pressure taps, in four rings of 32 taps, arranged as viewed in Figure 1, and two longitudinal rows of 17 additional taps each. The frequency response function of each tap was measured prior to the experiment. Using the transfer functions the unsteady pressure measurements were corrected for magnitude and phase distortions caused by the instrumentation tubing length. Static tests for the inclinations of 60° and 90° were conducted with the hole around the top end of the cable both open and sealed so as to assess the influence of end conditions. Judging from the attained pressure profiles, small differences of the two cases illustrate that end effects are not important, at least in the vicinity where the pressure measurements were recorded.
Both the displacements and accelerations of each end of the model were measured in the heave and sway directions. Data sampling was performed at two different frequencies, 500Hz and 1250Hz, to assess the significance of high frequency components. It was found that the higher sampling frequency was unnecessary.
Being interested in fine details of the flow, the turbulence intensity was measured with two dynamic three-component cobra probe instruments, upstream and downstream of the cable model. Typical turbulence intensities were of the order of 0.5%. An additional effect that was found to affect the flow transitions was insect accumulation on the cable surface, due to the open return design of the wind tunnel. This caused random roughness anomalies up to the order of r/D≅0.01, which according to Zdravkovich (1990) would be sufficient to severely alter flow transition regimes.
2 RESULTS
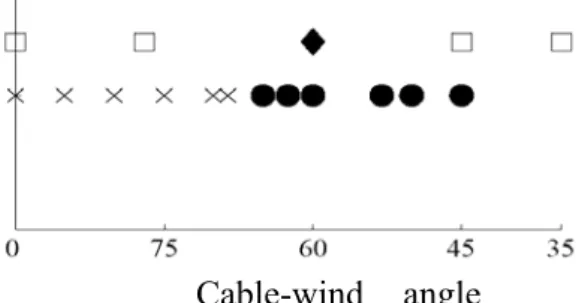
Large responses, of primarily across wind character, were observed only for the inclination of φ=60° for both the cases of spring rotations examined (α= 0° and 54.7°) and for various combinations of spring tunings in the two vibration planes. The results agree well with previous suggestions by Matsumoto et al. (2005), who, for a horizontal cylinder restricted to single plane across-wind motion, identified the range of yaw angles able to sustain unstable conditions, see Figure 2. Note that cable orientations relatively close to the wind direction were not considered and that the test wind speeds were intended to be in the subcritical Reynolds number range. In the current study, the large responses for a cable-wind angle of φ=60° fell in the previously identified unstable region, while inclinations of φ=77°, 90° did not produce large responses. This division is suspected to be related to a threshold of the axial wind velocity, for instance Ucosφ > ~0.3U (i.e. φ < ~73°).
Figure 2: Cable-wind angle φ against instability encountering. •, × after Matsumoto et al. (1995) unstable and stable points respectively, ♦, □ Phase 1 and 3 unstable and stable points respectively.
Large vibrations were restricted to a certain range of wind speeds, thus being distinguished from classical galloping vibrations, which occur for all wind speeds exceeding a certain threshold. Still this does not restrict the use of term galloping. Conjecturing that instability is triggered by flow asymmetry caused by Reynolds number effects, with increasing Reynolds number a symmetric configuration is recovered after passing through some decisive region. The maximum amplitude observed was around 0.75D, which reached the maximum available clearance for vibrations in the test setup and corresponded to significantly increased damping values. Thus the aerodynamic limit state, if one exists, would be at a higher amplitude.
Figure 3: Motion traces for cases A) φ = 60°, α = 0°, fh/fs = 0.98, ζh/ζs = 1.91;
B) φ = 60°, α = 0°, fh/fs = 1.01, ζh/ζs = 1.15 and C) φ = 60°, α = 54.7°, fh/fs = 1.01,
ζh/ζs = 0.94.
In all cases the large responses were elliptical, generally with the major axis at an angle to the spring directions, suggesting coupling action induced by aeroelastic forces. Motion trajectories (Figure 3) are in agreement with theoretical analysis of coupled translational galloping oscillations, see Luongo & Piccardo (2005). Relatively large detuning values produce an ellipse aligned with one of the degrees of freedom as in Figure 3 A. Closer tuning of the system rotates the ellipse as in Figure 3 B and C and perfect tuning would correspond to planar motion (in the direction of the divergent mode). The width of the ellipse is controlled by the coupling action induced by the wind.
As presented by Andersen et al. (2009), large responses were grouped in two distinct regions of Reynolds number at approximately Re = 2×10⁵ and 3×10⁵, around the lower and upper boundaries of the drag crisis. A Proper Orthogonal Decomposition (POD) was performed on the pressure tap data and interestingly it was found that some consistent mode prevails in the aforementioned regions. As seen in Figure 4, which includes the cumulative variance explained by a relatively small number of Proper Orthogonal Modes (POMs), two peaks emerge, approximately coinciding with the Reynolds numbers for large responses. Even more noticeably, the behaviour is similar for both the static and dynamic tests, although the POMs themselves are likely to differ in the two cases.
The POD analysis indicated the existence of both localized and widespread energetic modes to explain data variances. There were cases that time coefficients of certain POMs from the static tests were primarily harmonic with a frequency close to the structural frequency, raising the question as to whether this component could have caused resonance and large motion in the later dynamic tests.
The low Reynolds number behaviour is dominated by periodic vortex shedding and accordingly the possibility for fewer periodic modes to relatively accurately describe the pressure tap
measurements. Increasing Reynolds numbers seem to destroy coherent structures and cause an increase in the dimensionality of the underlying dynamics. Still, two breaks in the expected monotonic decrease in the variance provide the system with energetic mechanisms that most probably accommodate large response. Later in this paper an assertion on this possible excitation mechanism will be provided. The differences presented in Figure 4 may seem small but they are consistent and moreover seem to be amplified under the influence of large scale motion.
Figure 4: Proportion of total variance from 20 POMs (from pressure tap data) against Reynolds number.
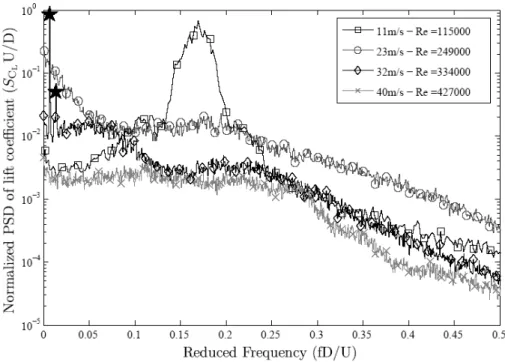
Figure 5: Spectra of the lift coefficient average from the four pressure rings. Star-marked points, 32m/s case, show the resonant peaks that correspond to the structural frequency of 1.4Hz and twice this value. Model setup, φ=60° and α= 0°.
Spectra of the fluctuating lift coefficient for different wind speeds are presented in Figure 5. The plot shows the evolution of wind forcing in four characteristic behaviour cases prior to and after the large structural response incidents of U=32m/s where the resonating peaks are clearly distinguished by star symbols. For the subcritical range, represented by the wind speed of 11m/s, clear vortex shedding can be indentified at a Strouhal number of 0.17 (corresponding to 12Hz), slightly lower that the expected 0.2. As pointed by Jakobsen et al. (2003) previously, the cable inclination broadens the frequency range of observed forcing relative to the normal wind case. Increasing the Reynolds number (e.g. U=23m/s) leads to vortices being less coherent, thus reducing the power of the spectrum in the Strouhal reduced frequency region. At the same time some very low frequency components emerge (fD/U < 0.05) and the spectrum becomes flat for a range of reduced frequencies from 0.1 to 0.2. For the record exhibiting large response (U=32m/s) it seems that the energy in the broad low frequency band locks in to the structural frequency and large motion builds up, while some broader band low frequency forcing, probably related to weak vortex shapes, still survives for fD/U < 0.1. In the high wind speed regime (U= 40m/s) the low frequency components have vanished and only low-level broadband excitation remains for fD/U < 0.3. It is interesting to note that the lift coefficients above were calculated as the average from all four rings, whist there were often marked differences between the rings, particularly for the φ=60° inclination case.
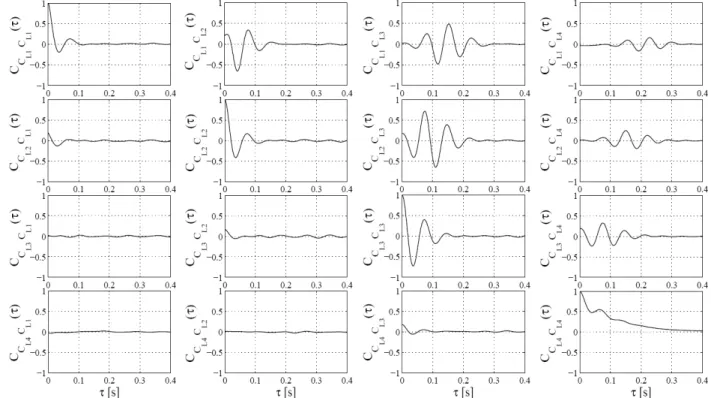
Figure 6: Correlation functions for ring lift forces for the subcritical case of U=12m/s. Propagation is evidently one-sided. Model setup, φ=60° and α= 0°.
To further investigate the relationship between the rings, lift and drag cross-correlation functions were estimated. Figure 6 gives an illustration of such functions showing the systematic force delays along the cable span, indicated by the asymmetry between the top right and bottom left of the figure. Such delays imply some flow structures propagating in the axial direction. When transformed to a propagation velocity, these delays compare very well with the axial component of the free-stream wind velocity, although it was not constant along the length between rings but showed a slight variation.
Indications of axial flow were clear in both the static and dynamic tests for the cable inclined at φ=60° and, as logically expected, ceased for the high inclination values. Figure 6 displays a subcritical case with enhanced vortex shedding signs, but the signature indications of axial flow
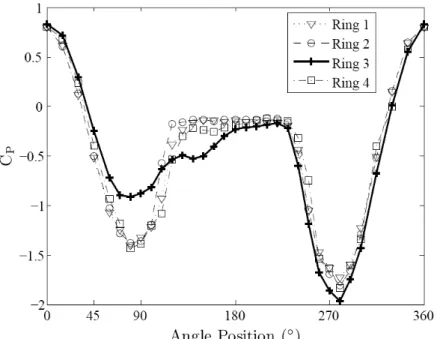
persisted throughout the wind speed range. Another possible effect of axial flow can be conjectured in view of the pressure profiles such as the one given in Figure 7. Ring 3, with a clear laminar separation bubble formation, has a pressure disturbance reaching only up to the base pressure point (180°). There suddenly behaviour changes similarly to that in the presence of a splitter plate (see Matsumoto et al. (2005)). Such a feature, which was identified throughout the recordings, could possibly be caused by the axial flow.
An extensive analysis on pressure profile evolution with increasing Reynolds number is provided by Jakobsen et al. (2009) in the Part II companion paper.
Figure 7: Mean CP distribution for large response case of U=32m/s, Re=3.34×10⁵
(Figure 3 B). Model setup φ = 60°, α = 0°.
3 DISCUSSION
The force measurement technique of pressure taps employed (integrating pressures over tributary areas), has the feature of allowing the assessment of the contribution of particular segments of the cross section to the total drag and lift forces. Dealing with an instability that is essentially fed by asymmetries, it would be useful to identify where and how can these arise. As indicated by Zdravkovich (1997), asymmetries can occur due to flow transitions in the critical Reynolds number range. There the drag suddenly drops and considerable mean lift appears, since half the section contains a laminar separation bubble while the other half does not. Therefore the section illustrated in Figure 1 is split into a ‘right’ part containing taps 4-3-2…-20 and a ‘left’ part containing taps 4-5-6…-20. Before proceeding any further it should be noted that the regimes described by Zdravkovich (1997) correspond only to smooth flow and a revised treatise should be considered for allowing for the effects of turbulence and roughness on flow transitions. Such a contribution is analysed also by Zdravkovich (1990) and it will be useful in the following notes.
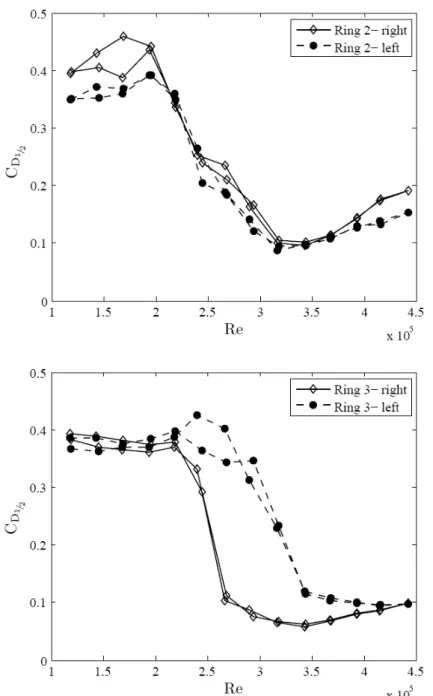
There was some conceptual difference in the behaviour of individual rings while varying the inclination angle, φ. As presented in Figure 8, for the inclination of 60°, the drag crisis zone has distinct features for different rings. For Ring 2 the ‘right’ and ‘left’ drag evolution almost coincide while for Ring 3 there is some consistent spacing between the drag drops. These are signs of two and one bubble action respectively. Thus for a given Reynolds number in the drag crisis region, two states appear simultaneously along the cylinder length (Rings 2 and 3 are at a spacing of 4 diameters). But
nominally the formation of two bubbles, as for Ring 2, are not possible in the critical Reynolds number range but only in the supercritical range.
Figure 8: Drag evolution acquired for ‘right’ (taps 4-3-..20) and ‘left’ (taps 4-5-..20) parts of Rings 2 and 3, during static tests. Model setup φ = 60°. Double points correspond to increasing and decreasing wind speed runs.
A similar situation to the above observation was described by Zdravkovich (1997), who found that roughness of the order of only r/D≅0.003, together with turbulence, not only shifts the drag crisis to lower Reynolds numbers but actually obliterates the critical state and causes a transition directly from the subcritical to the supercritical state. The two conditions co-exist along the cylinder length, possibly being related to features such as axial vortices previously described by Matsumoto et al. (1995). Neighbouring sections, with one and two bubbles respectively, are likely to shed vortices at different frequencies, which intuitively could cause rotation of the axes of the vortices, which could then propagate axially along the cable. Furthermore, the observation that the supercritical state emerges very early is consistent with the acquired forcing spectra. As presented by Schewe (1983),
the supercritical state is characterised by lift fluctuations with reduced frequencies less than 0.2, along with strong low frequency peaks, similarly to the spectra found here. Note that differences between the two bubbles in the two bubble state still give the opportunity for mean lift to arise.
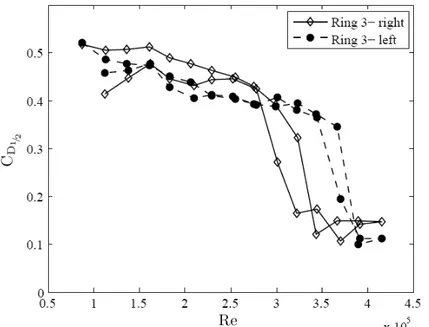
Figure 9: Drag evolution acquired for ‘right’ (taps 4-3-..20) and ‘left’ (taps 4-5-..20) parts of Ring 3, during static tests. Model setup, φ=90°.
Considering the 77° and 90° inclination angles, a different trend is found. All rings seem to exhibit similar behaviour of the static force coefficients. This is consistent with the observation of Andersen et al. (2009) who found closer agreement for the higher inclinations, between the mean coefficients from the four pressure tap rings and those estimated from the mean displacements in the dynamic tests, which give a measure of the mean over the whole cylinder length. This could be due to the conjecture of increased inclination angles having a consistent characteristic behaviour for the transitions of individual cylinder sections. Thus a simple non-weighted averaging can be performed which closely matches the global forcing coefficients. On the other hand, for φ=60°, since different states exist along the cylinder length, averaging over the four pressure tap rings with predefined weightings does not so accurately represent the global forcing.
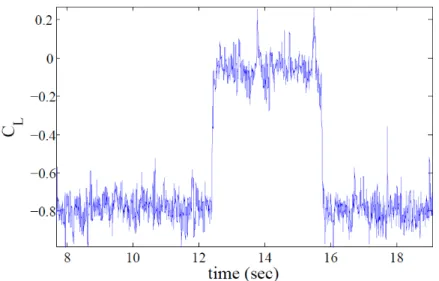
The drag crisis for Ring 3 for φ=90° is illustrated in Figure 9. Similarly, one-bubble formations exist on all rings in a narrow defined range of Reynolds number. It is also significant that the Reynolds number corresponding to minimum drag is increased relative to the previous inclined cable case (c.f. Figure 8). One last unique feature identified was that of sudden jumps in the lift coefficient, denoting jumps between symmetric and asymmetric states. Such a case is shown in Figure 10. These jumps occurred on all rings and analysis of the pressure distributions around the cylinder confirmed that they were due to real changes in the flow state. Such jumps were not recorded for φ=60°.
With all these observations in hand it is possible to speculate on possible flow mechanisms underlying the dynamic excitation and on the influence of the cable inclination angle. The axial flow that was identified in the case of φ=60° is evidently propagating disturbances axially along the cable. Taking into account that no state jump was observed for the numerous recorded cases it seems reasonable to suggest that, for this inclination, some stable dynamic balance builds up between sections along the cylinder. Still, the dynamic balance is built by components that conceptually differ. Each section is prone to the effects of turbulence and roughness, as demonstrated by the frequent omission of the critical state in the transition from subcritical to supercritical. Interaction between zones along the cylinder allow for formations of high lift to develop in the system.
Figure 10: CL time series of a single ring for static test for φ=90°, U=30m/s,
Re=3×10⁵.
On the other hand, for φ=90° and 77° the sections appear to be less influenced by turbulence intensity and roughness and all transition states can clearly be distinguished. It is suggested that the lack of significant axial flow inhibits the formation of a stable dynamic balance along the cylinder, allowing each section to behave independently from its neighbours. The fact that there seems to be some characteristic behaviour for the drag evolution, although data are only available from a few sections, is consistent with this conjecture. Although considerable lift could occur locally, considering the random sign of the lift, the expected total lift on the cable is zero. Of course non-zero total lift can occur due to the finite length of the cylinder. Yet the above conjecture could possibly explain the lack of large vibration incidents for high inclination values in the Phase 3 tests. For lower cable-wind angles, the suggested dynamic balance over the length of the cable is more likely to result in non-zero lift, which could be a significant factor in the excitation mechanism.
4 CONCLUDING REMARKS
Large amplitude vibrations of dry inclined cables are still an unravelled mystery with ongoing research trying to establish connections and reasoning about the different parameters that may trigger instabilities. This paper has attempted to contribute to this large number of previous observations of the behaviour, using the latest findings from a series of dynamic tests on a realistic cable model equipped with pressure measurement taps. The influence of surface roughness, turbulence intensity and cable-wind angle on large scale motion were key subjects of the research project
An interesting finding was the identification of two separation bubbles behaviour very close to the subcritical Reynolds number range. This was only found for the lowest cable-wind angle of φ=60° and ceased for φ=77° and 90°. It was also established that the cable at φ=60° could retain different flow states along the cable length in a very stable way, while at the greater cable-wind angles the flow often jumped between states, altering the lift sign and value. Moreover, the Reynolds number value corresponding to minimum drag, nominally designating the end of the critical state, was found to be significantly lower for the lowest cable-wind angle. Accepting the limitation that only a few measurement sections were used, it is suggested that some dynamic balance of different states builds up along the cable for some inclination angles, probably connected with a specific range of axial flow velocities, which can sustain high total lift on the cable, which could be an important factor in the cable excitation mechanism. On the other hand, it is thought that increased randomness and independence, as imagined to be the case for a vertical cylinder, should reduce the total lift values.
Simultaneous existence of different flow states was argued to be a case of different sensitivity of inclination angles to turbulence intensity and roughness, but it could alternatively be an effect of the inclination angle itself in smooth flow. However, the Phase 2 tests, with much smoother flow, didnot exhibit a similar truncation of the critical state, implying that the turbulence and roughness were indeed significant parameters.
This paper sets out a number of questions and conjectures, which is a matter of future work and experimentation to approve or reject.
5 ACKNOWLEDGEMENTS
The authors are grateful to the technical staff at NRC for their excellent support. The tests were funded by NRC, EPSRC (via an Advanced Research Fellowship of the second author), the University of Stavanger and StatoilHydro ASA.
6 REFERENCES
Matsumoto M., Shiraishi N., Shirato H. (1992). “Rain-wind induced vibration of cables of cable-stayed bridges”, J. Wind Eng. Ind. Aerodynamics. (43) 2011–2022.
Matsumoto M., Saitoh T., Kitazawa M., Shirato H., Nishizaki T. (1995). “Response characteristics of rain-wind induced vibration of cable-stayed bridges”, J. Wind Eng.. (57) 323–333.
Matsumoto M., Yagi T., Liu Q., Oishi T., Adachi Y., Hasuda H. (2005). “Dry-state galloping of inclined stay cables”,18th KKCNN Symposium on Civil Eng., (57), Taiwan.
Larose G.L., Savage M.G., Jakobsen J.B. (2003). “Wind tunnel experiments on an inclined and yawed circular cylinder”, 11thInt. Conf. on Wind Engineering, Lubbock, Texas, 279-286.
Cheng S., Larose G.L., Savage M.G., Tanaka H. (2003). “Aerodynamic behaviour of an inclined circular cylinder”, Wind Structures, (6), 197-208.
Macdonald J.H.G., Larose G.L. (2008a). “Two-degree-of-freedom inclined cable galloping - Part 1: General formulation and solution for perfectly tuned system”, J. Wind Eng. Ind. Aerodynamics, (96), 291–307.
Macdonald J.H.G., Larose G.L. (2008b). “Two-degree-of-freedom inclined cable galloping - Part 2: Analysis and prevention for arbitrary frequency ratio”, J. Wind Eng. Ind. Aerodynamics, (96), 308–326.
Andersen T.L., Jakobsen J.B. (2008). “Static response coefficients from dynamic cable-model tests”, Proc. 6th Int. Colloquium on Bluff Body Aerodynamics and Applications, Milano, Italy.
Jakobsen J.B., Larose G.L., Savage M.G. (2003). “Instantaneous wind forces on inclined circular cylinders in critical Reynolds number range”, 11thInt. Conference on Wind Engineering, Lubbock, Texas, 2165-2173.
Jakobsen J.B., Andersen, T. L., Larose G.L. (2005). “Interpretation of wind forces monitored on inclined stationary cylinder in critical Reynolds number range in relation to observed aeroelastic model response”, 6th Int. Symposium on Cable Dynamics, Charleston, USA, 287-294.
Jakobsen J.B., Andersen, T. L., Macdonald J.H.G., Nikitas N., Savage M.G., McAuliffe B.R. (2009). “Wind Tunnel testing of an inclined cable model-Pressure and motion characteristics, Part II ”, EACWE5, Florence, Italy.
Zdravkovich M.M. (1997). Flow around circular cylinders Vol 1: Fundamentals. Oxford University Press, Oxford. Zdravkovich M.M. (1990). “Conceptual overview of laminar and turbulent flows past smooth and rough circular
cylinders”, J. Wind Eng. Ind. Aerodynamics, (33), 53–62.
Andersen T.L., Jakobsen J.B., Macdonald J.H.G., Nikitas N., Larose G.L., Savage M.G., McAuliffe B.R. (2009). “Drag-Crisis response of elastic cable-model”, 8th Int. Symposium on Cable Dynamics, Paris, France.
Luongo A., Piccardo G. “Linear instability mechanisms for coupled translational galloping”, Journal of Sound and Vibration, (288), 1027-1047.
Schewe G. (1983). “On the force fluctuations acting on a circular cylinder in crossflow from subcritical up to transcritical Reynolds numbers”, J. Fluid Mech, (133), 265-285.