arXiv:hep-ex/0101028v1 18 Jan 2001
Higgs self coupling measurement in e
+
e
−
collisions at
center-of-mass energy of 500 GeV
C. Castanier
(a), P. Gay
(a), P. Lutz
(b), J. Orloff
(a)(a) Laboratoire de Physique Corpusculaire, Univ. B. Pascal/IN2P3-CNRS,
24 Av. des Landais, F-63177 Aubi`ere Cedex, France
(b) CEA/DAPNIA, Service de Physique de particules,
CE-Saclay, F-91191 Gif-sur-Yvette Cedex, France
LC-PHSM-2000-061 hep-ex/0101028
Abstract
Feasibility of the measurement of the trilinear self-couplings of the Higgs boson is studied. Such a measurement would experimentally determine the structure of the Higgs potential. Full hadronic and semi-leptonic final states of the double-Higgs strahlung have been investigated.
1
Introduction
In the framework of the standard model, the generation of mass occurs through the Higgs mech-anism. This mechanism assumes a Higgs potential, V(Φ), which behaves as V(Φ)=λ(Φ2-1
2v 2)2,
where φ is an isodoublet scalar field, and v∼246 GeV is the vacuum expectation value of its neutral component. A determination of the Higgs boson mass, which satisfies m2
h=4λv2 at tree
level in the standard model, will provide an indirect information about the Higgs potential and its self-coupling λ. The measurement of the trilinear self-coupling λhhh= 6
√
2 λv offers an
independent determination of the Higgs potential shape. In case of disagreement, the compar-ison between these two measurements would give an interesting clue about new physics, like super-symmetry for instance. Anyway, the reconstruction of the Higgs potential is an essential step in the experimental validation of the Higgs mechanism that lies at the core of the standard model.
The aim of our study is to demonstrate how to measure the trilinear self-coupling λhhh in e+e− collisions at center-of-mass energies delivered by the future Linear Collider. The note is
organized as follows : the framework of the study is defined in Section 2. The Monte Carlo simulation is reported in Section 3. Analyses and results are described in Section 4 and 5.
2
Signal
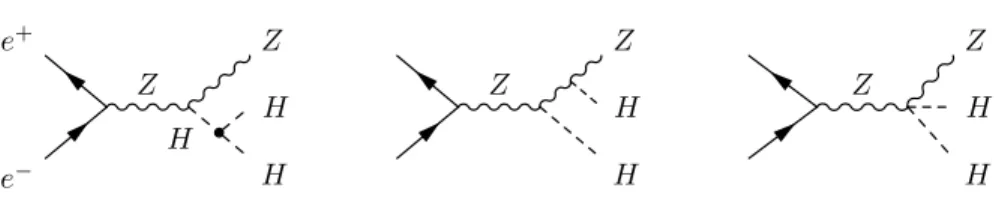
The trilinear Higgs self-coupling, λhhh, could be extracted from the measurement of the cross-section of each of the following processes : double Higgs-strahlung (e+e−
→ Zhh) or W W double-Higgs fusion (e+e− → ¯ν
eνehh) [1]. Figure 1 indicates the major Feynman diagrams
involved in the first process.
Z H e− e+ H H Z Z H H Z Z H H Z
Figure 1: Feynman diagrams involved in the e+e−→hhZ cross-section via the double Higgs-strahlung.
For light Higgs boson masses, the Higgs boson decays predominantly in a b¯b pair. When the Z decays in a lepton pair, the final state is hhZ→b¯bb¯bℓ+ℓ−. With a high b content and two
leptons, this topology produces an easy signature but represents only ∼ 8% of the total final state. By contrast, the hhZ→b¯bb¯bq¯q final state benefits from a high statistics with ∼ 60% of the final states but requires a more complicated analysis.
In the minimal super-symmetric extension (MSSM) of the standard model, the Higgs sector is richer with three neutral Higgs bosons (h, H and A). The Higgs potential is therefore more intricate and further trilinear self couplings are possible beyond λhhh : λhhH, λHHH, λhAA, and λHAA. At the tree level, these depend on two parameters (tan β and mA for instance).
constitutes a third one. Studies performed in the parameter space of the MSSM are described in Ref. [1, 2]. Here, let us simply recall on Fig. 2 the sensitivity of λhhh as a function of mAwith
different m˜t assumptions. For fixed mh, the value of λhhh reaches its standard model value
for large mA (decoupling limit), and the dependence on m˜t only shows up for smaller values of
mA. However, the topologies obtained will be similar to the standard model ones, except for
particular parameter choices where the Higgs boson decay into a b¯b pair is suppressed. Thus, the experimental study we develop in this note, though a priori restricted to the standard model framework, is also relevant for the MSSM.
-1 -0.5 0 0.5 1 1.5 2 2.5 3 3.5 100 200 300 400 500 mA λ hhh 2 ( GeV/c ) GeV/c 1Tev/c 2 300 2
Figure 2: MSSM trilinear Higgs self-coupling (λhhh) as a function of the mass of the
pseudo-scalar Higgs boson mass (mA) and different assumptions of m˜t from 300 GeV/c2 to 1 TeV/c2 with
a 100 GeV/c2
step size; the horizontal line corresponds to the standard model value of λhhh. A 100 GeV/c2 Higgs boson mass has been assumed.
If the mass of the Higgs boson is assumed to be light (∼ 120 GeV/c2) then the best
center-of-mass energy is around 500 GeV [1] and the double Higgs-strahlung process cross-section is one order of magnitude greater than the WW fusion one. The study presented here will be performed for mh=120 GeV/c2 and √s=500 GeV and it is restricted to the standard model
framework.
Nevertheless, with mh=120 GeV/c2 and √s=500 GeV the e+e−→hhZ cross-section is still
very tiny with a 0.18 fb value. Namely, for an expected integrated luminosity of 500 fb−1, only
93 signal events are produced. The difficulty is increased by the the huge background sources, as detailed in next Section.
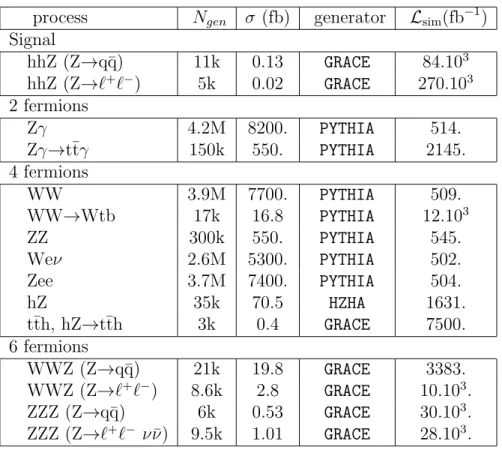
process Ngen σ (fb) generator Lsim(fb−1) Signal hhZ (Z→q¯q) 11k 0.13 GRACE 84.103 hhZ (Z→ℓ+ℓ−) 5k 0.02 GRACE 270.103 2 fermions Zγ 4.2M 8200. PYTHIA 514. Zγ→t¯tγ 150k 550. PYTHIA 2145. 4 fermions WW 3.9M 7700. PYTHIA 509. WW→Wtb 17k 16.8 PYTHIA 12.103 ZZ 300k 550. PYTHIA 545. Weν 2.6M 5300. PYTHIA 502. Zee 3.7M 7400. PYTHIA 504. hZ 35k 70.5 HZHA 1631. t¯th, hZ→t¯th 3k 0.4 GRACE 7500. 6 fermions WWZ (Z→q¯q) 21k 19.8 GRACE 3383. WWZ (Z→ℓ+ℓ−) 8.6k 2.8 GRACE 10.103. ZZZ (Z→q¯q) 6k 0.53 GRACE 30.103. ZZZ (Z→ℓ+ℓ− ν ¯ν) 9.5k 1.01 GRACE 28.103.
Table 1: Cross-sections for signal and background processes, Monte Carlo statistics and simulated luminosity (Lsim).
3
Simulation
The signal event samples have been simulated with the GRACE generator [4]. The background sources are either two fermions final state processes as e+e−→Zγ, or four fermions processes
like e+e−→W+W−, ZZ, Weν, Zee, hZ. The latter has been simulated with HZHA generator [5]
while PYTHIA [6] was used for the others processes. Six fermions final state processes like e+e−→WWZ or ZZZ are also background sources and GRACE was used to simulate them.
Ta-ble 1 summaries the size of the samples used and the cross-section of each process. Since e+e−
→t¯t and e+e−
→Wtb will yield major contributions to the background, an emphasis has been performed and a simulated luminosity greater than 2000fb−1 was generated for such
pro-cesses as well as for six fermions propro-cesses while for the others a simulated luminosity greater than 500fb−1 was used as reported in Table 1. Even if the cross-section is small, e+e−→t¯th
process is also a potential source of background and this process was considered.
The detector simulation was performed with a Parametric Monte Carlo [7]. The tracking system, immersed in a 3 tesla magnetic field, consists on a vertex detector (VDET) surrounding the beam tube at ∼ one centimeter radius followed by a time projection chamber (TPC). The VDET impact parameter resolution is assumed to be ∼5µm in both rz and rφ views. Only charged particles with a transverse momentum greater than 0.2 GeV/c are reconstructed. The tracking efficiency is assumed to be 99.7%. The tracking system is complemented with a forward
tracker and muon chambers. The b-tagging is performed through a parametrisation derived from full reconstruction [8].
At low angle, a luminometer (LCAL) enforces the hermeticity of the detector. Energy and direction of the photons and neutral hadrons are measured thanks to the electromagnetic (ECAL) and hadronic (HCAL) calorimeters. The intrinsic energy resolutions taken into account are ∆E/E=10.2%/qE(GeV ) and ∆E/E=40.5%/qE(GeV ) respectively for ECAL/LCAL and HCAL. The energy threshold below which no neutral particles is reconstructed in calorimeters are 200 MeV and 500 MeV for ECAL and HCAL respectively. Following studies performed with full simulation of high granularity calorimeters [9], a jet energy resolution of 40%/qEjet
could be achieved. Such a resolution has been assumed in the analysis described hereafter.
4
Analyses
If an isolated track is allowed to form a jet, both final state, hhq¯q and hhℓ+ℓ−are characterized
by six jets, and the hadronic system is characterized by a high b content.
The analysis works in three steps. The preselection mainly based on event shape variables consists in removing most of the two- and four-fermions final-state contributions of the back-ground. In a second step the b-content as well as the di-jets reconstructed masses are used to reject the three-bosons final-state contribution. Finally, all the relevant informations are combined with a multivariable method.
The preselection consists in rejecting events with a charged multiplicity less than 30. The thrust value has to be less than 0.9 and the direction of the thrust with respect to beam axis should verify cos(θthrust) < 0.9 . In order to remove e+e−→Z(γ), the longitudinal component of
the total momentum of the event (Ptot
z ) have to satisfy Ptotz < 50 GeV/c. The event is divided
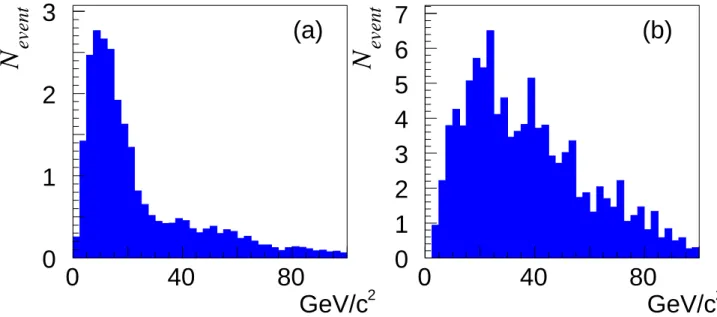
in two hemispheres with respect to the thrust axis and the invariant mass of each hemisphere (Mhemi) must exceed 90 GeV/c2. Figure 3 illustrates the discrimination between the signal and
the background processes achieved by this variable.
The event is clustered with the DURHAM scheme. The variation of the ycut is stopped when
the transition between six and seven jets occurs and the event is thus forced into a six jets topology. To eliminate e+e−→Z(γ) with a photon emitted in the sensitive region of the ECAL,
a fraction of electromagnetic energy with respect to the jet energy less than 80% is requested for all the jets.
The numbers of events expected from background processes at the preselection level are reported in Table 2. The contribution from e+e−→Zee or Weν processes is canceled. Around
48.103 background events are expected with a luminosity of 500 fb−1 while ∼42 and ∼7
signal events are expected for hhq¯q and hhℓ+ℓ− final state respectively when m
h=120GeV/c2
is assumed. Major sources of background are processes with at least one top quark in the final state. In fact, 99% of the contribution from the e+e−
→Z(γ) process is coming from Z→t¯t and 80% of the contribution from e+e−→W+W− process is e+e−→Wtb. The remaining part of
those background processes mainly consists in six fermions final state with two or one b quarks. However, even if the background contribution is largely reduced, the remaining part is three order of magnitude greater than the signal.
Thanks to the jet energy flow resolution, a direct use of the reconstructed di-jets masses is applied. Among all the di-jets masses in the event, the so-called m56 mass minimizes the
0
0.5
1
1.5
2
60
100
140
0
400
800
1200
60
100
140
GeV/c
2GeV/c
(b)
2(a)
Figure 3: Distribution of the invariant mass of each hemisphere (Mhemi) for (a) signal and (b)
back-ground processes.
difference with a mZ hypothesis. The b content of the system recoiling to the Z (Brecoil) is an
excellent variable to reject contribution from background processes. In a first stage, a loose cut is applied : at least one b jet among the recoiling jets system (Brecoil>1) is requested.
Among the four jets recoiling to the Z (i.e. m56), the di-jets masses m12 and m34 are defined
by minimizing km12-m34k while having both m12 and m34 larger than 100 GeV/c2. The three
di-jets masses are combined in a simple way in order to form the distance DIST=q((m12 −
mh)2 + (m34− mh)2 + (m56 − mZ)2), where mh and mZ are the Higgs boson and Z masses.
The distribution of this variable DIST is displayed on Fig. 4 when a tightened cut on Brecoil is
applied (Brecoil>2).
The contribution from the various background sources are reported in Table 2 for the loose (Brecoil
>1) and tightened (Brecoil>2) cuts. The signal efficiencies are 43% and 35% respectively.
Most of the background is coming from e+e−→Wtb and e+e−→t¯t processes while the six
fermions final state contribution is due to e+e−
→ZZZ with relatively small level with respect to the previous contributions. The figure of merit defined as s/√b increases from 0.22 at the preselection level up to 3, with an integrated luminosity of 500 fb−1.
Clearly the combination of the the di-jets masses in the DIST variable is a very crude one. Thus, in order to take into account the correlation between the di-jets masses and the b content of the event, the variables m12, m34, m56 and Brecoilare combined with a multivariable method.
Here a neural network (NNet) approach has been adopted. The NNet output varies from -1 (background-like) to +1 (signal-like). Restricted to the positive values, Fig. 5 displays the NNet output from signal and background processes while the contributions from the background sources are indicated in Table 2. The signal efficiency is about 36% and s/√b is ∼4.2 when an integrated luminosity of 500 fb−1 is assumed. The clear discrimination between the signal and
the background processes could be exploited to reinforce the figure of merit : as an example, with the same integrated luminosity, a cut on the NNet output at 0.5 leads to 31 signal events while 27 background events are expected corresponding to a figure of merit of ∼ 6. Better
0
1
2
3
0
40
80
N
event
0
1
2
3
4
5
6
7
0
40
80
N
event
2 2(b)
GeV/c
GeV/c
(a)
Figure 4: Distribution of the variable DIST (defined in text) for (a) signal and (b) background processes.
values could be obtained with thightened cuts and this behavior is fully used in the cross-section measurement where a fit of the NNet output distribution is performed as indicated in the next Section.
5
Results
The cross-section of the e+e−
→hhZ have to be measured, in order to extract λhhh. Such a measurement is performed by a likelihood fit of the characteristic variable (DIST, Brecoil,
NNoutput) already used in the analysis. The different selections (indexed as B, C and D in
Table 2) have been tested. The relative error obtained on the cross-section measurement (∆σ/σ) according to the different sets of ’selection/discriminant variable’ are reported in Table 3 for integrated luminosity from 500 to 2000 fb−1. A relative error of 10.3% on the cross-section is
obtained when NNet selection is used and an integrated luminosity of 2 ab−1.
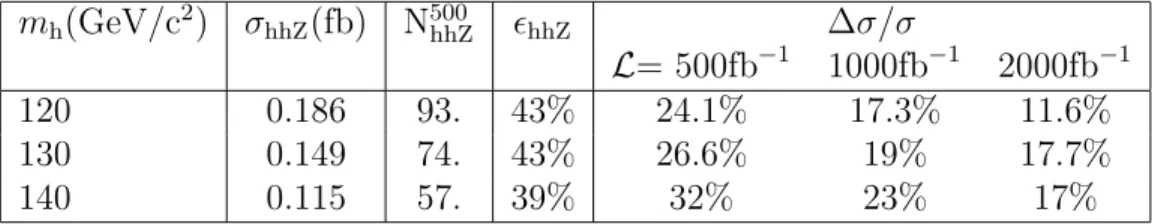
With the same analysis used for mh=120 GeV/c2, the relative error on the e+e−→hhZ
cross-section has been evaluated for higher Higgs boson masses up to 140 GeV/c2. The relative
errors are reported in Table 4 as well as the cross-section values and expected number of events with an integrated luminosty of 500 fb−1. Only the ’B/Brecoil’ set of selection/variable has been
considered. Due to the decrease of the cross-section the error increases rapidly up to 17% even with an integrated luminosity of 2 ab−1. Since this result is obtained with a standard selection,
a dedicated analysis based on retrained NNet which take into account the Higgs boson mass would improve the performances.
To derive the relative error on λhhh (∆λ/λ) the relation between λhhh and the cross-section has to be taken into account according the behavior displayed on Fig. 6 [10] where κ is λhhh expressed in unit of λ0, the trilinear Higgs coupling in the standard model. Thus, on this
process preselection b-content b-content NNet Brecoil>1 Brecoil>2 >0 hhq¯q 41.4 34. 27.1 27.5 hhℓ+ℓ− 6.7 6.2 5.1 6.4 total hhZ 49.1 40.2 32.2 33.9 WW 2114. 233. 74.3 32. Zγ 44938. 116. 34. 24. ZZ 484. 7.4 0. 0. WWZ 331. 0.6 0. 0.14 ZZZ 56.6 19. 9. 8.4 hZ 174. 0. 0. 0. t¯th 3. 0. 0. 0. total bkg. 48089. 376. 117.4 64.3 s/b 0.1% 11% 27% 53% s/√b 0.22 2. 3. 4.2 selection index B C D
Table 2: Numbers of events with L= 500fb−1 expected both for signal and background processes at
preselection level, standard selections (two set of cut on Brecoil) and multivariable analysis; s/b and
s/√b are also indicated.
selection variable ∆σ/σ L= 500fb−1 1000fb−1 2000fb−1 B DIST 32.8 % 25.6 % 17.7 % C DIST 29.8 % 21.5 % 15.1 % B Brecoil 24.1 % 17.3 % 11.6 % D NN output 20.4 % 12.9 % 10.3 %
Table 3: Relative error (∆σ/σ) on σhhZ for different selection/variable set and integrated luminosities
are assumed to be fully polarized so that the displayed cross-section must be reduced by a factor two [1] to be coherent with the present unpolarized study.
As indicated by the Fig. 1, only one diagram for the e+e−→hhZ cross-section is sensitive
to λhhh. The others constitute an irreducible background for the λhhh measurement which shows up on Fig. 6 as the non-vanishing cross-section at κ = 0. Such an irreducible background makes the measurement intrinsically difficult.
From Fig. 6 the relative variations of the cross-section and λhhh around the standard model are related by ∆λ/λ∼1.75×∆σ/σ. The relative error on λhhh is accordingly reported in Table 5 for two sets of selection/variable. With an integrated luminosity of 2 ab−1 and NNet output,
0 2 6 10 0 0.2 0.4 0.6 0.8 1 NN output N event 8 4 12
Figure 5: Neural Network output distribution (N Noutput) for HHZ signal (full histogram) and
back-ground (empty histogram) with 500 fb−1 and m
h=120 GeV/c2. -1 0 1 2 0 0.2 0.4 0.6 0.8
κ
SM Double Higgs-strahlung: e+ e-→ ZHH √s = 500 GeV/MH = 120 GeV σpol (ZHH;κ) [fb] ZHH SMFigure 6: e+e−→hhZ cross-section (in fb) as a function of κ when the incoming beams are fully
mh(GeV/c2) σhhZ(fb) N500hhZ ǫhhZ ∆σ/σ
L= 500fb−1 1000fb−1 2000fb−1
120 0.186 93. 43% 24.1% 17.3% 11.6% 130 0.149 74. 43% 26.6% 19% 17.7% 140 0.115 57. 39% 32% 23% 17%
Table 4: Relative error (∆σ/σ) on σhhZ with the ’B/Brecoil’ set for different Higgs boson masses and
integrated luminosities; signal efficiencies ( ǫhhZ ) and cross-sections ( σhhZ ) are reported and (N500hhZ)
the expected number of hhZ events with L=500fb−1
selection variable ∆λ/λ
L= 500fb−1 1000fb−1 2000fb−1
B Brecoil 42.2% 30.3% 20.3 %
D NN output 35.7% 22.6% 18.0%
Table 5: Relative error (∆λ/λ) on λhhh for different selections and integrated luminosities.
6
Conclusions
To establish the Higgs mechanism in an unambiguous way, the self-energy potential of the Higgs field must be reconstructed. This implies the determination of the trilinear self-coupling. The experimental feasibility of the λhhh measurement has been explored trough a detailed
analysis of the reconstruction of the double Higgs-strahlung events. It takes advantage of the characteristic signature with four b jets and a Z boson, reconstructed either in its leptonic or hadronic decay modes. The large four and six fermion background and the tiny signal cross section make of this analysis a genuine experimental challenge. An excellent tagging as well as reconstruction capabilities of the Tesla detector are then essential. Thanks to a multivariable method, based here on a neural network (NNet), a s/√b=6 could be achieved with 68 signal events selected in 1000 fb−1 with a center-of-mass energy of 500 GeV and m
h=120 GeV/c2;
18% of the selected signal events are from hhℓ+ℓ−. With help of high integrated luminosity
(2 ab−1), the determination of the e+e−→hhZ cross-section with a 10% relative error could be
achieved leading to a relative error on λhhh of 18%.
Acknowledgements
We gratefully acknowledge discussions with M. Battaglia, A. Djouadi, M. Muhlleitner and P. Zerwas.
[1] A. Djouadi, W. Killian, M. Muhlleitner and P. Zerwas, Eur. Phys. J. C10 [2] P. Osland, P.N. Pandita, Phys. Rev. D
[3] D.J. Miller and S. Moretti RAL-TR-99-032, May 1999
[4] GRACE manual, MINAMI-TATEYA group, KEK report 92-19, (1993)
[5] P. Janot, The HZHA generator , in ’Physics at LEP’, Eds. G. Altarelli, T. Sj¨ostrand and F. Zwinger, CERN 96-01 (1996) Vol.2, p.309
[6] T. Sj¨ostrand, High-energy-physics event generation with PYTHIA 5.7 and JETSET 7.4, Compt. Phys. Commun.82 (1994) 74
[7] M. Pohl, H.J. Schreiber, SIMDET.3 A Parametric Monte Carlo for a TESLA Detector, DESY 99-030 (1999)
[8] R. Hawkings, Vertex detector and flavour tagging studies for the Tesla linear collider, LC-PHSM/2000-026
[9] P. Gay, Eflow with high granularity calorimeters, talk given at Linear Collider Workshop 2000, Fermi National Accelerator Laboratory, October 24-28, 2000, Batavia, Illinois, USA; J-C. brient et. al , Si-W calorimeter performances, LC-Note/2000 in preparation


![Table 3: Relative error (∆σ/σ) on σ hhZ for different selection/variable set and integrated luminosities are assumed to be fully polarized so that the displayed cross-section must be reduced by a factor two [1] to be coherent with the present unpolarized s](https://thumb-eu.123doks.com/thumbv2/123doknet/14002255.456029/8.918.225.674.117.475/relative-different-selection-integrated-luminosities-polarized-displayed-unpolarized.webp)