Aneuploidy Causes Non-genetic Individuality
The MIT Faculty has made this article openly available.
Please share
how this access benefits you. Your story matters.
Citation
Beach, Rebecca R. et al. “Aneuploidy Causes Non-Genetic
Individuality.” Cell 169, 2 (April 2017): 229–242 © 2017 Elsevier Inc
As Published
http://dx.doi.org/10.1016/J.CELL.2017.03.021
Publisher
Elsevier BV
Version
Author's final manuscript
Citable link
http://hdl.handle.net/1721.1/116147
Terms of Use
Creative Commons Attribution-NonCommercial-NoDerivs License
Aneuploidy causes non-genetic individuality
Rebecca R. Beach1, Chiara Ricci-Tam2, Christopher M. Brennan1, Christine A. Moomau1, Pei-hsin Hsu1, Bo Hua2, Rebecca E. Silberman1, Michael Springer2, and Angelika Amon1,3,*
1David H. Koch Institute for Integrative Cancer Research, Howard Hughes Medical Institute,
Massachusetts Institute of Technology, Cambridge, MA 02139, USA
2Department of Systems Biology, Harvard Medical School, Boston, MA 02115, USA
SUMMARY
Phenotypic variability is a hallmark of diseases involving chromosome gains and losses, such as Down Syndrome and cancer. Allelic variances have been thought to be the sole cause of this heterogeneity. Here, we systematically examine the consequences of gaining and losing single or multiple chromosomes to show that the aneuploid state causes non-genetic phenotypic variability. Yeast cell populations harboring the same defined aneuploidy exhibit heterogeneity in cell cycle progression and response to environmental perturbations. Variability increases with degree of aneuploidy and is partly due to gene copy number imbalances, suggesting subtle changes in gene expression impact the robustness of biological networks and cause alternate behaviors when they occur across many genes. As inbred trisomic mice also exhibit variable phenotypes, we further propose that non-genetic individuality is a universal characteristic of the aneuploid state that may contribute to variability in presentation and treatment responses of diseases caused by aneuploidy.
eTOC BLURB
A systematic study of the consequences of gaining and losing single or multiple chromosomes shows that non-genetic phenotypic variability is a universal characteristic of the aneuploid state.
*Corresponding author: Angelika Amon, 77 Massachusetts Avenue, 76-561, Cambridge, MA 02139, Phone: (617) 258-6559, Fax:
(617) 258-6558, [email protected]. 3Lead contact
AUTHOR CONTRIBUTIONS R.B., C.R., B.H., C.B., C.M., P.H., R.S., M.S. and A.A. designed the experiments. R.B, C.R., B.H.,
C.B., C.M., P.H. and R.S. performed experiments and analyzed results. R.B., C.R., B.H., C.B., C.M., P.H., R.S., M.S. and A.A. wrote the manuscript. All authors read and approved the final manuscript.
Publisher's Disclaimer: This is a PDF file of an unedited manuscript that has been accepted for publication. As a service to our
customers we are providing this early version of the manuscript. The manuscript will undergo copyediting, typesetting, and review of
HHS Public Access
Author manuscript
Cell
. Author manuscript; available in PMC 2018 April 06.Published in final edited form as:
Cell. 2017 April 06; 169(2): 229–242.e21. doi:10.1016/j.cell.2017.03.021.
A
uthor Man
uscr
ipt
A
uthor Man
uscr
ipt
A
uthor Man
uscr
ipt
A
uthor Man
uscr
ipt
Keywords
aneuploidy; non-genetic heterogeneity; cell-to-cell variability; gene dosage effects; biological noise; Down Syndrome; cancer
INTRODUCTION
Aneuploidy, a genomic state defined by whole chromosome gains and losses, is the leading cause of miscarriage and mental retardation in humans and a hallmark of cancer. A remarkable characteristic of diseases caused by unbalanced karyotypes is variability in presentation. In Down Syndrome (Trisomy 21), for example, 87.5% of fetuses die in utero, while some individuals reach age 60 or more (reviewed in Roper and Reeves, 2006). High variability is also observed in degree of facial dysmorphology, cognitive ability, hypotonia, and dermatoglyphic features at birth and in disease predisposition. This phenotypic variability has been attributed to allelic variance among individuals (reviewed in Roper and Reeves, 2006). Here we show that phenotypic variability is inherent to the aneuploid state, providing an additional potential explanation for the heterogeneity observed in diseases caused by large-scale karyotypic abnormalities.
Gains and losses of genes encoded on autosomes generally lead to corresponding changes in gene expression (reviewed in Henrichsen et al., 2009); therefore, it is not surprising that mis-segregating entire chromosomes has severe consequences. Aneuploid cells exhibit
widespread aneuploidy-associated stresses including proliferation defects, elevated levels of protein aggregates, and genomic instability (reviewed in Siegel and Amon, 2012) and gene-specific phenotypes where changes in dosage of gene-specific genes cause gene-specific phenotypes (i.e. Sheltzer et al., 2011).
Studies of aneuploidy to date have largely been confined to cell lines with chromosome gains (Stingele et al., 2012; Torres et al., 2007; Williams et al., 2008) because cell lines with
A
uthor Man
uscr
ipt
A
uthor Man
uscr
ipt
A
uthor Man
uscr
ipt
A
uthor Man
uscr
ipt
chromosome losses are difficult to maintain (Alvaro et al., 2006; Anders et al., 2009). Thus, it is not known how chromosome loss impacts cell physiology or whether monosomic cells exhibit the same aneuploidy-associated stresses that are widespread among cells with chromosome gains. Nor is it known how quickly aneuploidy-associated phenotypes develop following chromosome mis-segregation. Here we employ a system that allows us to examine the immediate consequences of defined chromosome gains and losses in budding yeast. Our analyses reveal that the adverse effects of aneuploidy on cell proliferation are immediate for both chromosome gains and losses. We further find high cell-to-cell variability in cell cycle progression among cells harboring the same aneuploidies. We identify gene copy number imbalances caused by the aneuploid state as one source of this variability and show that stochastic DNA damage due to gene imbalances causes high variance in S phase and early mitosis duration. Responses to environmental perturbations also vary among cells of the same aneuploid karyotype, indicating that aneuploidy impacts the robustness of multiple— perhaps all—biological processes. Finally, we find that inbred trisomic mouse embryos exhibit phenotypic variability. While subtle changes in gene dosage of individual genes have little effect on the robustness of biological networks, our results show that subtle changes in gene dosage across many genes can promote alternate behaviors.
RESULTS
A system to examine the immediate consequences of chromosome mis-segregation
In budding yeast, chromosomes that cannot attach to the mitotic spindle due to centromere failure are retained in the mother cell (Murray and Szostak, 1983). To induce chromosome mis-segregation, we replaced the endogenous centromere of each chromosome with a conditional centromere: a construct containing the galactose inducible/glucose repressible GAL1 promoter adjacent to the centromere (Hill and Bloom, 1987; Figure S1A). In the presence of galactose, transcription through the centromere prevents kinetochore formation, thus causing chromosome mis-segregation. To follow chromosome mis-segregation, we introduced an E. coli lac operator array near the conditional centromere and expressed a GFP-LacI fusion to visualize the array (GFP dot; Straight et al., 1996; Figure S1A). Using this system, 67–93% of mother cells retained both sister chromatids harboring the conditional centromere upon addition of galactose (Figure S1B).
In a haploid strain, chromosome mis-segregation generates nullisomes (N-1)—which are inviable—and disomes (N+1); in a diploid strain, monosomes (2N-1) and trisomes (2N+1) are generated. To ensure induction of mis-segregation of one chromosome did not lead to nondisjunction of other chromosomes, we followed the segregation of a large chromosome (IV) and a small chromosome (V) one cell division (3 hours) and 2–3 divisions (5 hours) after inducing mis-segregation of an unrelated chromosome. Inducing mis-segregation of chromosomes I, II, VIII, IX, XI or XIII did not cause chromosomes IV or V to mis-segregate (Figure S1C), indicating that inactivating one centromere does not substantially destabilize other chromosomes.
We generated a large number of strains harboring single or multiple conditional centromeres (Method Details). This enabled us to examine the consequences of mis-segregating up to 8 chromosomes and to systematically analyze the consequences of chromosome losses. We
A
uthor Man
uscr
ipt
A
uthor Man
uscr
ipt
A
uthor Man
uscr
ipt
A
uthor Man
uscr
ipt
conducted all of our cytological analyses in strains containing GFP dots on the mis-segregating chromosome(s) to ensure that we only analyzed cells that had indeed gained or lost a chromosome.
Chromosome mis-segregation leads to rapid changes in cellular protein composition
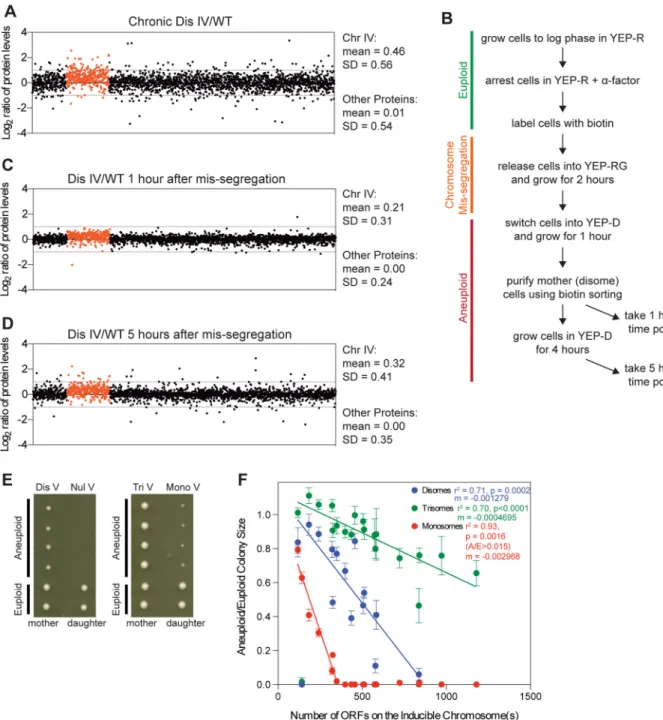
Quantitative proteomic analyses of budding yeast cells harboring an additional chromosome showed that approximately 80% of proteins encoded on the disomic chromosome are expressed according to their gene dosage (Dephoure et al., 2014; Torres et al., 2010). To determine how quickly protein levels change upon chromosome gain, we measured protein content of haploid cells that had gained a copy of chromosome IV (disome IV) immediately after chromosome mis-segregation (1 hour) and 2 cell divisions later (5 hours). As a control we measured protein content of cells constitutively harboring an additional chromosome IV (henceforth chronic disomes). Proteome quantification by TMT showed that levels of proteins encoded on the disomic chromosome were increased in chronic disome IV. However, the increase was only 1.4-fold instead of two-fold, likely due to the ‘ratio compression’ effect, a well-known artifact occurring in isobaric labeling analyses (Figure 1A; reviewed in Christoforou and Lilley, 2012). We corrected for ratio compression in our analysis.
We induced mis-segregation of chromosome IV and enriched for cells that were disomic for chromosome IV (see Method Details). The enrichment resulted in cultures containing 67% disome IV cells, 20% euploid cells, and 13% cells lacking chromosome IV (nullisomes) one hour following chromosome mis-segregation. Five hours later, the population was comprised of 61% disomes, 34% euploids, and 5% nullisomes. Based on these distributions we
calculated the mean log2 of the relative protein abundance ratio for proteins on chromosome
IV to be 0.12 at 1 hour and 0.28 at 5 hours in the extreme where proteins are only diluted by proliferation; in the other extreme where protein turnover is instantaneous, we expected values of 0.27 at 1 hour and 0.28 at 5 hours (see Method Details). Our experimental analysis revealed that proteins encoded on chromosome IV were elevated compared to proteins encoded on the euploid chromosomes 1 hour following chromosome mis-segregation, with a mean log2 protein abundance ratio of 0.21 for proteins on chromosome IV. Five hours
following chromosome mis-segregation the value for proteins on chromosome IV was 0.32 (Figure 1B–D). These results suggest that protein composition has not fully adjusted to genome composition in disome IV cells one hour following chromosome mis-segregation, but protein composition is equivalent to that of a chronic disome within five hours of chromosome mis-segregation. We conclude that chromosome mis-segregation leads to a rapid remodeling of the proteome to reflect the cell’s genetic makeup.
Chromosome gains and losses cause defects in cell division
We next investigated how quickly cell proliferation defects arise following chromosome mis-segregation. To measure cell proliferation following chromosome mis-segregation, we first examined colony formation 40–48 hours after induction of aneuploidy, when colony size was still increasing exponentially (Figure 1E). This analysis led to two observations. First, proliferation defects in monosomes were more severe than those of disomes or trisomes (Figures 1F, S1B). Second, colony size was inversely correlated with degree of
A
uthor Man
uscr
ipt
A
uthor Man
uscr
ipt
A
uthor Man
uscr
ipt
A
uthor Man
uscr
ipt
aneuploidy (Figure 1F). The observation that the negative fitness slope of trisomes is less steep than that of disomes further suggests that it is the relative ratio of aneuploid to euploid gene dosage that is mainly responsible for the observed fitness defects. Doubling gene dosage relative to base ploidy of the cell, as in disomes, is proportionally more detrimental than increasing gene dosage by 50% relative to base ploidy, as in trisomes. We conclude that: 1) both chromosome gain and loss impair cellular fitness; 2) changes in relative expression levels of genes are responsible for the fitness defects observed in cells with chromosome gains; and 3) the fitness defect of monosomes is likely a composite of aneuploidy-associated stresses and haploinsufficiency.
Effects of chromosome loss on cell cycle progression
To more carefully define the cell cycle defects caused by chromosome loss, we analyzed cell cycle progression following chromosome loss by time-lapse microscopy. We used mCherry-Cdc3 and Spc42-dsRed or Spc42-GFP fusion proteins along with GFP dots on the mis-segregating chromosome(s) to follow cell cycle progression. Cdc3 is a component of the septin ring that forms at the site of bud formation from the time of entry into the cell cycle until exit from mitosis (Kim et al., 1991). Thus, the time during which a cell lacks a Cdc3 ring estimates the time a cell spends in G1. Spc42 is a component of the spindle pole body (SPB; Donaldson and Kilmartin, 1996). The distance between SPBs and the separation of sister chromatids as analyzed by GFP dot separation indicate anaphase onset.
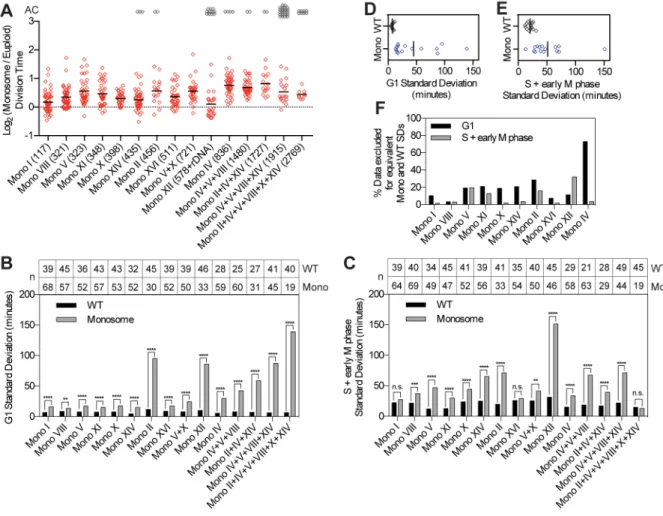
Doubling time measurements revealed reduced cell proliferation in all monosomic strains analyzed (Figure 2A). This analysis agreed with our colony size measurements but was not perfectly correlated (i.e. monosomes XII and XIV) because doubling time measurements do not account for cells that stop dividing, which occurs frequently in some monosomic strains. We further observed that the cell cycle delay and frequency of cell cycle arrest increased with degree of monosomy (Figure 2A). Strains with the highest degree of monosomy appeared to have less of a cell cycle delay than strains with lower levels of monosomy; however, this is because cells that stop dividing—a frequent occurrence in complex
monosomes (Figure 2A, grey points; Figure S2A)—cannot be included in the doubling time measurements and thus cell proliferation defects are underreported.
In-depth cell cycle analyses revealed that 14 of 15 monosomes exhibited G1 delays that increased with degree of monosomy (r2 = 0.89; Figure S2B,E). Delays in other cell cycle stages were also common (Figure S2C,D). We conclude that loss of most chromosomes impacts multiple cell cycle stages.
Our live-cell analyses also revealed that monosomic cells of the same karyotype exhibited dramatic cell-to-cell variability in cell cycle duration (Figures 2A–E; S2B–D; Table S1). To quantify heterogeneity, we calculated the standard deviation of G1 duration and of the time it took cells to complete S phase and early mitosis (bud emergence to anaphase onset, henceforth S+early M phase) and found high variability in both cell cycle periods (Figures 2B–E; S2B,C). Furthermore, variability in G1 duration increased with degree of monosomy (Figure 2B). S+early M phase duration variability appeared less correlated with degree of monosomy, but this appearance may be misleading as cells with multiple monosomies only undergo 1–2 cell divisions before arresting in G1 (Figure S2A). Variability in the first and
A
uthor Man
uscr
ipt
A
uthor Man
uscr
ipt
A
uthor Man
uscr
ipt
A
uthor Man
uscr
ipt
second divisions following chromosome mis-segregation may be smaller than it would be in later divisions (if complex monosomes continued to divide) because levels of long-lived proteins may not yet have adjusted to the monosomic state and thus have not yet become limiting.
To determine whether variability was driven by a small number of extremely slowly dividing cells or if it reflected a wide spread of proliferation rates, we asked how many of the slowest dividing cells had to be eliminated from monosomic cell populations for variance of the monosome population to resemble that of euploid cells (Figure 2F). In 6 of 10 monosomes analyzed, increased variability in S+early M duration was driven by a few cells with extreme cell cycle delays (Figure 2F). In the remaining monosomes, a higher fraction of the
population (~20%) conferred increased heterogeneity in S+early M. About 10–30% of the population caused increased G1 duration variability in most monosomes (Figure 2F). We conclude that monosomy interferes with multiple aspects of cell proliferation and that the degree of the defect varies greatly among cells of the same karyotype.
Cells harboring additional chromosomes exhibit heterogeneity in cell cycle kinetics
Next we examined cell-to-cell variability in cell cycle duration following chromosome gain(s) in haploid cells. Consistent with previous results, cell division rates were decreased in all disomes, with most disomes exhibiting delays in both G1 and S+early M phase (Figures 3A, S3A–C). Interestingly, disomes—like monosomes—exhibited significant cell-to-cell variability in G1 and S+early M phase lengths that increased with degree of disomy (Figures 3B,C; S3D; Table S1). In the majority of strains with single chromosome gains, variability in G1 and S+early M phase length was driven by 20% of the population or less; however, variability was due to a wide spread of G1 and S+early M lengths in strains harboring multiple disomies (Figure 3D).
Most aneuploidy-associated phenotypes are attenuated when base ploidy is increased—that is, they are more severe in disomes than in trisomes (Torres et al., 2007). To some extent, increased ploidy buffered cell cycle duration heterogeneity (Figures 3; S3). Variability in total cell cycle length and S+early M phase duration was partially attenuated by increased ploidy (Figure 3I–K). Our data demonstrate that increased cell-to-cell variability in cell cycle progression is a universal feature of the aneuploid state in yeast. Our data further indicate that this heterogeneity is caused in part by the amount of overproduced protein with respect to base ploidy and implicate overexpressed proteins or proteins that are not correctly assembled into their biological complexes as contributing to non-genetic variability in aneuploid cells.
Cell division length variability is stochastic
What are the origins of cell-to-cell variability in cell cycle duration in aneuploid cells? Although aneuploid cells are genomically unstable (Blank et al., 2015; Nicholson et al., 2015; Passerini et al., 2016; Sheltzer et al., 2011; Zhu et al., 2012), mutation-induced population heterogeneity is an unlikely cause. The system we employ examines the immediate effects of mis-segregating a specific chromosome, precluding the accumulation of suppressor mutations. Nevertheless, to exclude the possibility that heterogeneity is due to
A
uthor Man
uscr
ipt
A
uthor Man
uscr
ipt
A
uthor Man
uscr
ipt
A
uthor Man
uscr
ipt
genetic or perhaps epigenetic changes, we examined whether cell cycle timing was consistent from one division to the next. We measured division times of individual cells during two consecutive cell divisions following chromosome mis-segregation. This analysis revealed that a slow division was not predictive of a subsequent slow division, as single-cell division times for two consecutive divisions were not correlated (r2 ≤ 0.019; Figure S4A–E). We conclude that neither genetic nor epigenetic changes cause population heterogeneity in aneuploid cells.
Stochastic DNA damage contributes to population heterogeneity in aneuploid strains
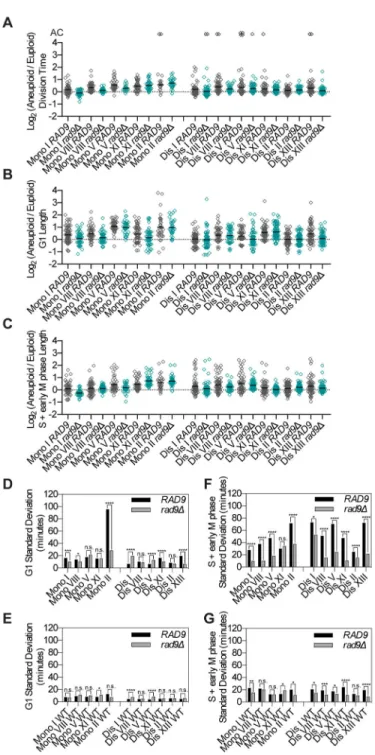
If genetic and epigenetic alterations are not responsible for cell-to-cell variability, stochastic events must be the source of heterogeneity. To test this idea we first asked whether stochastic DNA damage could explain aspects of the observed cell-to-cell variability, as a previous study showed that yeast strains harboring chronic disomies experience increased DNA damage (Blank et al., 2015). We deleted RAD9, a gene encoding a component of the DNA damage checkpoint pathway that delays cell cycle progression in response to DNA damage (Figure 4; Table S1). RAD9 deletion decreased cell-to-cell variability in S+early M phase duration in euploid cells (Figure 4G). This is not surprising as even euploid cells experience DNA damage, especially during live-cell imaging. The effect of deleting RAD9 was dramatic in disomes and monosomes: cell-to-cell variability in S+early M duration decreased in all strains except monosome XI (Figure 4F). RAD9 deletion only caused a minor decrease in G1 length variability in some aneuploid strains (Figure 4D), which is not surprising as DNA damage is predominantly repaired in S phase and G2 in yeast (Weinert and Hartwell, 1988). We conclude that stochastic DNA damage is largely responsible for variability in S+early M phase length in all but one aneuploid strain analyzed.
Deletion of RAD9 not only decreased variability in S+early M phase length but also slightly decreased mean S+early M duration in some aneuploid strains (Figure 4C). To determine whether accelerating cell proliferation per se led to a decrease in cell-to-cell variability, we examined the consequences of deleting UBP6 on cell cycle length heterogeneity. Deletion of UBP6 attenuates levels of proteins whose abundances change most in disomic yeast strains and increases proliferative potential of most chronic disomes at 37°C and of three disomes (V, VIII, and XI) at 25°C (Dephoure et al., 2014; Torres et al., 2010). UBP6 deletion decreased mean G1 length immediately following mis-segregation of chromosomes V, VIII and XI but did not affect cell cycle length variability (Figure S4F–L; Table S1). Our results indicate that increased variability in cell cycle length in disomic yeast strains is not solely a consequence of increased cell cycle length. As deletion of UBP6 attenuates levels of proteins most mis-regulated in disomes yet does not affect variability, we further conclude that the most extremely deregulated genes in disomes do not cause cell cycle length variability.
G1 length variability is attenuated in strains harboring chronic disomies
Heterogeneity in cell cycle duration immediately following chromosome mis-segregation was dramatic, ranging from near euploid division times in some cells to cell cycle arrest in others. Is heterogeneity maintained as cells continue to divide with an unbalanced
karyotype? To address this question we measured cell cycle duration in chronic disomes.
A
uthor Man
uscr
ipt
A
uthor Man
uscr
ipt
A
uthor Man
uscr
ipt
A
uthor Man
uscr
ipt
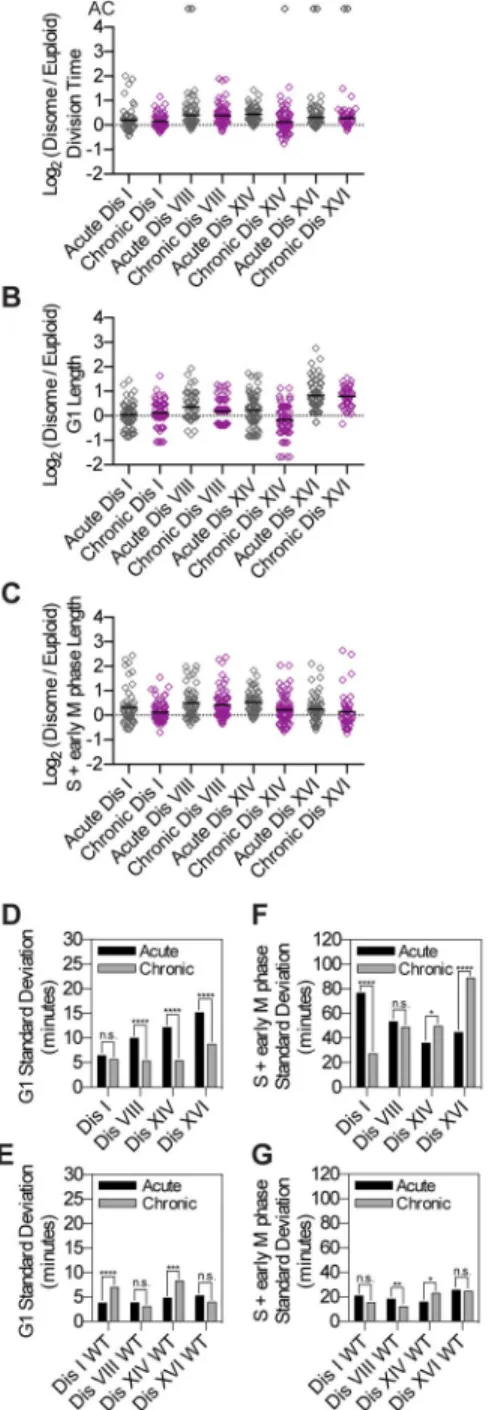
Disomy of chromosome I, VIII, XIV or XVI causes significant variability in G1 and S+early M phase duration immediately following chromosome mis-segregation (“Acute Dis”; Figure 5). Chronic disomes I, VIII, XIV and XVI also exhibited cell-to-cell variability that—like in acute disomes—was of non-genetic origin as single-cell division times for two consecutive divisions were generally not significantly correlated (Figure S5). However, variability in G1 duration was attenuated in 3 of 4 chronic disome strains compared to acute disomes (Figure 5; Table S1). Variability in S+early M phase was only attenuated in chronic disome I. We conclude that cell-to-cell variability in G1 duration is initially high following chromosome mis-segregation but attenuates upon continuous selection for an aneuploid karyotype.
Aneuploidy increases variability in the response to environmental perturbations
Next we determined whether aneuploidy increases cell-to-cell variability in other biological processes. We analyzed the response of disomes I, II, VIII, IX, XI, XIII, and XVI to three perturbations: galactose, DTT, and heat shock. Strains were analyzed at single-cell resolution by flow cytometry with fluorescent reporter fusions that respond to each
perturbation (Method Details; Figure 6), as gene expression is a classic model in the study of population heterogeneity (Raser and O’Shea, 2005). Additionally, disomes V, X, XII, and XIV were analyzed in a subset of the three environments (Figure S6). Strains with GAL1pr-YFP were grown in medium containing 0.25% galactose with no other sugars—a maximally inducing condition (Figure 6A–B). Strains with heat shock element (HSE) motifs (P4xHSE
-YFP) controlled by the transcription factor Hsf1 were grown at 39°C (a temperature where most euploid cells robustly respond to heat-shock with minimal cell death; Figures 6C–D and S6A–B). Strains with a promoter containing four unfolded protein response element (UPRE) motifs (P4xUPRE-GFP) regulated by Hac1 were grown in medium containing
0.625mM DTT, a concentration where cells robustly respond (Figures 6E–F and S6C–D). While the mean significantly varied in 19 of 26 strain condition pairings (p-values < 0.05 by Wilcoxon rank sum test; Figures 6A,C,E and S6A,C) there was no pattern to whether the mean increased or decreased (Table S2). However, the standard deviation increased in all 18 experimental-condition pairs where variation in standard deviation was observed (p-values < 0.05 by Wilcoxon rank sum test; Figures 6B,D,F and S6B,D and Table S2). The fold increases in standard deviation varied from 1.03 to 1.5-fold. In total, our results indicate that aneuploidy increases cell-to-cell variability in a number of different biological responses. In addition to variations in the maximal response, variations can also exist in the kinetics of response to a signal and the concentration at which cells respond. Therefore, we titrated glucose to measure the concentration of glucose at which cells repress the GAL1pr-YFP reporter construct in medium that contains 0.25% galactose (Figure S7). All disomes tested were more sensitive to glucose inhibition (p-values < 0.05 by Wilcoxon rank sum test; Figure S7B). In addition, we measured the time to induce GAL1pr-YFP following shift from raffinose to galactose (time = 0 in Figure S7C–D). All disomic populations except disome I harbored a substantial fraction of cells that were delayed in GAL1pr–YFP induction compared to euploid populations (Figure S7C–D). The time for all cells to completely induce the GAL response also varied among the disomes, in some cases increasing and in others decreasing. Together, these results support that the vast majority of disomes are more variable in their response to galactose.
A
uthor Man
uscr
ipt
A
uthor Man
uscr
ipt
A
uthor Man
uscr
ipt
A
uthor Man
uscr
ipt
The increase in standard deviation of the response could result from pathway specific increases in variation (intrinsic) or global increases in variation (extrinsic). Because we had measured a number of disomic strains under multiple conditions we were able ask whether an increase in variation in response to one stimulus was correlated with an increase in variation in a second stimulus. The results suggest both extrinsic and intrinsic components. The extrinsic component is supported by several strains having higher standard deviations in all conditions (Figure 6B,D,F; significance of 0.06 by Wilcoxon rank sum test). The intrinsic component is supported by strains such as disome VIII that had increased variation in two conditions but not in a third (Figure 6B,D,F).
To alternately assess the degree of intrinsic versus extrinsic noise, we measured the
correlation in expression of two promoters (GAL1pr-YFP and TDH3pr-mCherry) at a single cell level in five disomic strains (Figure 6G). After binning for cell size (Method Details), two of the strains had an increased correlation compared to euploid cells while three of the strains had a decreased correlation (p-values < 0.05 by Wilcoxon rank sum test). Our data show that increased variability in the response of aneuploid cells to multiple environmental stimuli is caused by both intrinsic and extrinsic sources of variation.
Aneuploidy increases phenotypic variability in mammals
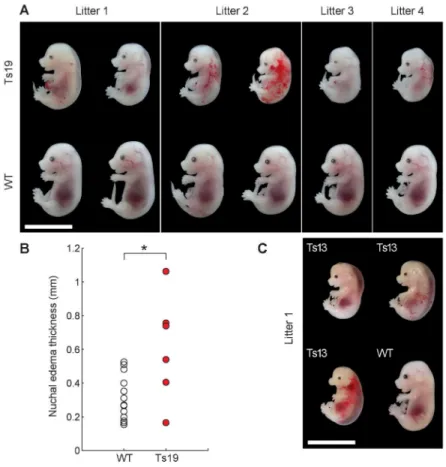
Is increased population heterogeneity a unique feature of aneuploid budding yeast or a more general property of the aneuploid state? To address this question we examined the effects of chromosome gain on phenotypic variability in inbred mouse strains. We used Robertsonian translocations backcrossed at least 10 times into the C57BL/J6 background to generate isogenic euploid, trisomy 13, and trisomy 19 embryos (Williams et al., 2008). In crosses involving Robertsonian translocations, litter size is usually small and trisomic embryos represent less than 16% of offspring (Pfau and Amon, 2015), severely limiting the number of animals we were able to analyze. Nevertheless, it was evident that phenotypic variability was high among trisomy 19 embryos compared to isogenic euploid littermate controls. We observed variability in facial morphology, degree of nuchal edema and hemorrhaging at embryonic day 15.5 (Figure 7A). To quantify variability we measured the maximal width of nuchal translucency, a classic prenatal test to assess degree of nuchal edema, which is an indicator of chromosomal abnormalities in human pregnancies. Variability in nuchal edema thickness was significantly higher in trisomy 19 embryos than in euploid embryos (p<0.05 by permutation analysis and p<0.005 by F-test on the variance; Figure 7B). Variability in morphology was also observed among trisomy 13 embryos despite only obtaining one litter with trisomy 13 embryos (Figure 7C). We conclude that aneuploidy causes phenotypic variability in inbred trisomy 19 embryos and likely also in trisomy 13 embryos.
DISCUSSION
Phenotypic differences in genetically identical populations have been observed in a variety of experimental settings (Cerulus et al., 2016; reviewed in Raj and van Oudenaarden, 2008; Raser and O’Shea, 2005). Variability can arise from stochastic synthesis and degradation of molecules (Elowitz et al., 2002; Paulsson, 2004) as well as binomial partitioning at cell division (Huh and Paulsson, 2011). Fluctuations are exacerbated when molecules are at low
A
uthor Man
uscr
ipt
A
uthor Man
uscr
ipt
A
uthor Man
uscr
ipt
A
uthor Man
uscr
ipt
copy number or are segregated as a unit (Jajoo et al., 2016; Uphoff et al., 2016). Mechanisms have been described that counteract these fluctuations to make biological processes robust (reviewed in Arias and Hayward, 2006), but regulatory networks can exhibit alternate behaviors when buffering mechanisms are perturbed (Mileyko et al., 2008). We show here that chromosome-scale changes in gene dosage severely impact the
robustness of every biological network analyzed. Robustness decreases with degree of aneuploidy, indicating that while subtle changes in gene dosage of individual genes have little effect on the robustness of biological networks, gene dosage changes across many genes can promote alternate behaviors. We propose that this universal characteristic of the aneuploid state may help explain the variability in presentation and treatment responses of diseases caused by karyotypic abnormalities.
Aneuploidy decreases robustness of biological networks
Recent work has shown that karyotypically heterogeneous populations of aneuploid S. cerevisiae and C. albicans exhibit a wide range of phenotypes, particularly under stress, which can be beneficial in adaption to different environments (Chen et al., 2015; Hickman et al., 2015). We report here that karyotypically homogeneous populations of aneuploid cells exhibit increased phenotypic variation as compared to euploid cells. All chromosome gains and losses analyzed cause a dramatic increase in variance in G1 and/or S+early M phase duration, with increases in both cell cycle stages for many aneuploidies. Two lines of evidence indicate that this variability is not due to genetic heterogeneity. First, the inducible system to generate aneuploid cells employs strains that are propagated in the euploid state and acutely induced to mis-segregate specific chromosomes, which avoids accumulation of genetic alterations selected for by an aneuploid karyotype. Second, cell cycle delays
observed in an individual cell are not consistent from one division to the next, indicating that delays are caused by stochastic and not heritable events.
Heterogeneity in cell cycle duration was also observed in strains with chronic aneuploidies, and cell cycle delays were not heritable, arguing for non-genetic rather than genetic heterogeneity. Furthermore, chronic aneuploid strains are variable for several cellular responses in addition to cell cycle timing. Population variation in gene expression increased in multiple aneuploid strains in response to an alternate carbon source and in response to two different cellular stresses: heat shock and DTT. Increased variability occurred across all tested conditions that led to a response in our reporters. Together, these results lead to the unanticipated conclusion that aneuploidy causes an increase in non-genetic variability in many different cellular responses. In fact, unaffected pathways may be in the minority.
Origins of non-genetic individuality
How does aneuploidy increase cellular variability? Previous studies suggested that
deterministic processes are responsible for cell-to-cell variability in cell cycle progression in euploid cells (Sandler et al., 2015). Our analyses indicate that stochastic DNA damage, leading to activation of the DNA damage checkpoint pathway, is a significant source of heterogeneity in S+early M duration. The subtle S phase defects and genomic instability that aneuploid cells experience (Blank et al., 2015; Sheltzer et al., 2011; Zhu et al., 2012) are
A
uthor Man
uscr
ipt
A
uthor Man
uscr
ipt
A
uthor Man
uscr
ipt
A
uthor Man
uscr
ipt
likely the cause for activation of the DNA damage checkpoint pathway in a fraction of aneuploid cells.
In contrast to variability in S+early M duration, DNA damage was not responsible for G1 length heterogeneity in most aneuploid strains. Additional factors that contribute to
variability in G1 remain unknown. However, it is of note that most stress response pathways delay cells in G1 (Herrero et al., 2003) and cellular stresses have been shown to increase phenotypic variability under some conditions (Axelrod et al., 2015). Various stresses associated with the aneuploid state, such as protein folding, metabolic and oxidative stress, may contribute to G1 length variability in aneuploid strains. We further note that many aneuploidies interfere with macromolecule biosynthesis, which controls G1 length (Thorburn et al., 2013). Thus, cell-to-cell variability in biosynthetic rates may also contribute to G1 length variability in aneuploid strains.
We also do not yet know how aneuploidy causes heterogeneity in gene expression. Gene dosage changes may alter expression—for instance, disome XIII may affect the response to galactose by changing the dosage of the Gal80 repressor encoded on chromosome XIII—yet it is unclear how dosage changes would increase population variability. Instead, increased variability in gene expression may be caused by an indirect source such as cellular stress, which is a universal feature of the aneuploid state. Previous studies showed that
environmental stresses decrease growth rate, which can lead to decreased expression of some transcription factors, thus increasing their variability and thereby the variability of the responses they control (Kashiwagi et al., 2006). As aneuploidy causes a variety of cellular stresses, this alone is likely to be a key contributor to the observed increased cell-to-cell variability. Also, multiple lines of evidence indicate that phenotypic heterogeneity allows populations to bet-hedge under stressful situations, which decreases the mean fitness of the population but increases the geometric mean of the population, thereby allowing cells to survive in extreme situations (Acar et al., 2008; Beaumont et al., 2009; Fridman et al., 2014; Levy et al., 2012). Increased variability in aneuploid cells could also be related to this phenomenon.
Ultimately, general features of the aneuploid state are likely to be the source of population heterogeneity. Many aneuploid yeast strains have decreased protein synthesis rates (Thorburn et al., 2013) which may lead to decreased production of rare proteins. Unequal partitioning of such rare proteins could cause phenotypic variability. Changes in relative ratios of gene products also contribute to cell-to-cell variability. Higher base ploidy partially buffers aneuploidy-induced cell-to-cell variability at least in S+early M phase duration. We do not yet know which genes decrease robustness upon doubling or halving gene dosage. Few genes in yeast cause substantive cell cycle defects when dosage increases by a single extra copy (Bonney et al., 2015) and haploinsufficiency is equally rare (Deutschbauer, 2005). However, subtle changes in the dosages of network nodes such as transcription factors or regulatory enzymes (i.e. protein kinases) may have widespread effects on the activities of the biological pathways that they control (Mileyko et al., 2008; Rancati et al., 2008), making cells more susceptible to intracellular and extracellular noise.
A
uthor Man
uscr
ipt
A
uthor Man
uscr
ipt
A
uthor Man
uscr
ipt
A
uthor Man
uscr
ipt
Implications for cell-to-cell variability in euploid populations
Fluctuations in mRNA synthesis, protein synthesis and degradation, and unequal segregation of proteins have all been implicated in producing cells with alternate fates in populations of genetically identical cells (Blake et al., 2003; Elowitz et al., 2002; Huh and Paulsson, 2011; Sigal et al., 2006). Our analyses of aneuploid cells are consistent with variability in these processes being sources of biological noise. Furthermore, our data lead to the remarkable conclusion that subtle changes in gene expression (50% increases or decreases) can cause significant cell-to-cell variability when they occur at a chromosome-wide scale, especially when multiple chromosomes are involved. In contrast, changing dosage of single genes by 50% usually has little effect on the robustness of biological networks. In other words, simultaneously changing multiple nodes of a biological network in subtle ways can make the behavior of a pathway unpredictable. We propose that simultaneous subtle fluctuations in the levels and activities of network components could contribute to heterogeneity observed in euploid cells.
Implications for disease presentation and treatment
Phenotypic variability is not confined to aneuploid yeast strains. Trisomic embryos also exhibit variability in morphology. From this observation, we propose that non-genetic heterogeneity may contribute to phenotypic variability seen in constitutional aneuploidies in humans and, of course, in cancer. Comparing phenotypic variability between inbred and outbred aneuploid yeast strains may provide an opportunity to assess the degree of variability conferred by the aneuploid state itself versus allelic variation in the population. Non-genetic heterogeneity may also explain why aneuploidy occurs frequently in
experimental evolution. Increased variance has the potential to enhance population fitness in euploid populations (Cerulus et al., 2016); therefore, aneuploidy may occur in evolution as a mechanism to further increase population variance, and thus fitness.
In closing, we note that aneuploidy-associated non-genetic variability has profound implications for aneuploidy as a therapeutic target in cancer and fungal infections. Non-genetic heterogeneity may make it difficult for therapies to target specific aneuploidies. In summary, our results indicate that decreased robustness of many, if not all, biological processes is a general feature of the aneuploid state. It will be interesting to determine how increased variability in single cell behavior leads to increased variability of multicellular processes.
STAR METHODS
CONTACT FOR REAGENT AND RESOURCE SHARING
Further information and requests for resources and reagents should be directed to and will be fulfilled by the Lead Contact, Angelika Amon ([email protected]).
EXPERIMENTAL MODEL AND SUBJECT DETAILS
Yeast strains and growth conditions—All S. cerevisiae strains used in this study are listed in Table S3. Yeast strains were generated and manipulated as described previously
A
uthor Man
uscr
ipt
A
uthor Man
uscr
ipt
A
uthor Man
uscr
ipt
A
uthor Man
uscr
ipt
(Guthrie and Fink, 1991). Cells were grown at 30°C in YEP supplemented with 2% raffinose (YEP-R), 2% raffinose + 2% galactose (YEP-RG), or 2% glucose (YEP-D). For live-cell imaging, cells were grown in synthetic complete medium at 25°C supplemented with 2% raffinose (SC-R), 2% raffinose + 2% galactose (SC-RG), or 2% glucose (SC-D).
Yeast strains used in Figures 1–6 were as follows: Figure 1:
(A) Haploid wild-type (A38452), chronic disome IV (A24367) (C,D) Haploid wild-type (A38452), disome IV (A38455)
(E–F) Haploid wild-type (A2587), diploid wild-type (A16629); disomes I (A38370), II (A38372), III (A38374), IV (A38376), V (A38378), VI (A38380), VII (A38382), VIII (A38384), IX (A38386), X (A38388), XI (A38390), XII (A38392), XIII (A38394), XIV (A38396), and XVI (A38398); trisomes and monosomes I (A38401), II (A38402), III (A38403), IV (A38404), V (A38405), VI (A38406), VII (A38407), VIII (A38408), IX (A38409), X (A38410), XI (A38411), XII (A38412), XIII (A38413), XIV (A38414), and XVI (A38415). Trisomes and monosomes I+II (A38753), V+X (A38755), II+V+X (A38756), I+V+X (A38758), and I+II+X (A38759) were used in this assay with a different wild-type strain (A38751).
Figure 2:
Diploid wild-type (A38656); monosomes I (A38661), II (A38663), IV (A38665), V (A38667), VIII (A38669), X (A38671), XI (A38673), XII (A38675), XIV (A38679), XVI (A38681) V+X (A38695), IV+V+VIII (A38689), II+IV+XIV (A38687), IV+V+VIII+XIV (A38691), and II+IV+V+VIII+X+XIV (A38690). The diploid wild-type strain (A38656) is marked with Spc42-GFP and mCherry-Cdc3.
Figure 3:
Haploid wild-type (A38654); disomes I (A38660), II (A38662), IV (A38664), V (A38666), VIII (A38668), X (A38670), XI (A38672), XII (A38674), XIII (A38676), XIV (A38678), XVI (A38680), V+X (A38694), II+V+X (A38682), II+X+XIV (A38684), IV+V+VIII (A38688), and II+IV+XIV (A38686); diploid wild-type (A38656); trisomes I (A38661), II (A38663), IV (A38665), V (A38667), X (A38671), XI (A38673), XII (A38675), XIV (A38679), and V+X (A38695). The haploid (A38654) and diploid (A38656) wild-type strains are marked with Spc42-GFP and mCherry-Cdc3.
Figure 4:
Strains used in this assay: haploid RAD9 wild-type (A38654) with RAD9 disomes I (A38660), II (A38662), V (A38666), VIII (A38668), XI (A38672), XIII (A38676); haploid rad9Δ wild-type (A38770) with rad9Δ disomes II (A39305), V (A38772), VIII (A39306); haploid rad9Δ wild-type (A38771) with rad9Δ disomes I (A39304), XI (A38773), XIII (A39307); diploid RAD9 wild-type (A38656) with RAD9 monosomes I (A38661), II (A38663), V (A38667), VIII (A38669), XI (A38673); diploid rad9Δ wild-type (A39326) with rad9Δ monosomes I (A39309), II (A39310), V (A39311), VIII (A39312), XI (A39313).
A
uthor Man
uscr
ipt
A
uthor Man
uscr
ipt
A
uthor Man
uscr
ipt
A
uthor Man
uscr
ipt
Figure 5:
Haploid wild-type (A38654) with acute disomes I (A38660), VIII (A38668), XIV (A38678), XVI (A38680); haploid wild-type (A38699) with chronic disomes I (A38701), VIII
(A38702), XIV (A38704), XVI (A39285). Figure 6:
(A–B) Wild-type (A38340); disomes I (A38341), II (A38342), VIII (A38343), IX (A38344), XI (A38345), XIII (A38346), and XVI (A39284).
(C–D) Wild-type (A38735); disomes I (A38736), II (A39280), VIII (A38738), IX (A38739), XI (A39282), XIII (A39283), and XVI (A38740).
(E–F) Wild-type (A38728); disomes I (A39275), II (A39276), VIII (A38730), IX (A39277), XI (A39278), XIII (A39279), and XVI (A38734).
(G) Wild-type (A39298); disomes I (A39299), II (A39300), IX (A39301) XI (A39302), and XVI (A39303).
Mouse strains—Trisomic mouse embryos were generated by crossing C57BL/6J mice with congenic mice heterozygous for two Robertsonian chromosomes (Williams et al., 2008). The following Robertsonian fusion chromosomes were used for these crosses: B6.Cg-Rb(11.13)4Bnr/JAmonJ, B6.Cg-Rb(13.16)1Mpl/JAmonJ, B6.CgRb(5.19)1Wh/ JAmonJ, and B6Ei.Cg-Rb(9.19)163H/J.
All animal studies and procedures were approved by the Committee on Animal Care (CAC), Division of Comparative Medicine (DCM) at the Massachusetts Institute of Technology (protocol number: 0715-073-18, In vivo and in vitro characterization of aneuploid cells), and all experiments were conducted in accordance with DCM regulatory standards.
All C57BL/6J mice and congenic wild-type mice carrying Robertsonian chromosomes were healthy and immunocompetent. Husbandry and housing conditions of experimental animals were in accordance with DCM guidelines and DCM Lab Animal User’s Handbook; in addition, the animals were monitored daily by the Amon lab as well as by DCM veterinarians and staff. Sample size estimation was not performed computationally; as trisomic embryos are very difficult to obtain, we sought to analyze as many trisomic embryos as was technically feasible. Animals were allocated to experimental groups based on genotype (euploid or trisomic).
METHOD DETAILS
Construction of conditional centromere strains—Strains with conditional
centromeres were constructed using a PCR-based method (Anders et al., 2009; Longtine et al., 1998). Briefly, the conditional centromere construct was amplified from plasmid p1888 (see Table S5) using primers designed to target the conditional centromere construct to a particular chromosome (see Table S4). Strain A2587 was transformed with the conditional centromere constructs as previously described (Longtine et al., 1998). We replaced the
A
uthor Man
uscr
ipt
A
uthor Man
uscr
ipt
A
uthor Man
uscr
ipt
A
uthor Man
uscr
ipt
endogenous centromere with the conditional centromere construct for every single chromosome (I-XVI). With the exception of cells with a conditional centromere on chromosome XV, all strains containing the conditional centromere construct exhibited doubling times equal to that of wild-type cells when grown in medium containing glucose (data not shown). We also generated strains containing multiple conditional centromeres. This allowed us to examine the consequences of mis-segregating multiple (up to 8) chromosomes. Importantly, this system also enabled us to systematically analyze the consequences of chromosome losses on yeast cell physiology.
CEN-LacO plasmid construction: To follow chromosome mis-segregation, we introduced
a lac operator (E. coli, lacO) array near the centromere of the chromosome containing the conditional centromere (Figure S1A). When a GFP-LacI fusion protein is expressed in these cells, it binds to the lacO sequences and forms a GFP dot at the lacO array that is visible by fluorescence microscopy (Straight et al., 1996).
Plasmids targeting the LacO array to various chromosomes (CEN-LacO plasmids; Table S5) were constructed by cloning a homology region to the specific target site with XhoI
restriction sites into the SalI cut plasmid p1499 (pCM40). Plasmids were integrated at the target site by restriction enzyme digest using the enzymes listed in Table S5. Transformants were screened for gain of nourseothricin resistance (100 μg/ml). All plasmids containing the LacO array were propagated in Max Efficiency Stbl2 competent cells (Invitrogen) due to the high propensity of the LacO array to recombine. All enzymes used for cloning were
obtained from New England BioLabs.
HYGRO-LacO plasmid construction: A plasmid targeting the LacO array to the hph hygromycin B resistance gene (HYGRO-LacO; Table S5) was constructed in the same way as the Cen-LacO plasmids, using homology to the hph hygromycin B resistance gene. Integration of the HYGRO-LacO plasmid used a two-step process. First, the hph hygromycin B resistance gene was integrated into the desired site in the genome using a PCR-based method (Longtine et al., 1998). Second, the HYGRO-LacO plasmid was integrated at the hph site by EagI digest. Transformants were screened for loss of hygromycin resistance and gain of nourseothricin resistance.
GFP dot strain construction: Strains containing the LacO array were crossed to a strain
containing the GFP-LacI fusion protein. To integrate the GFP-LacI construct into the genome, plasmid p1801 (Table S5) was linearized with NheI and transformed into A2587 cells as previously described (Guthrie and Fink, 1991).
Additional constructs: Spc42-dsRed and Spc42-GFP were constructed by PCR-based methods (Longtine et al., 1998). mCherry-Cdc3 was constructed using the YIp211-CDC3-mCherry integrating plasmid (Fang et al., 2010). The GAL1pr-YFP reporter was integrated at the HO locus (Escalante-Chong et al., 2015). The P4xHSE-YFP and P4xUPRE-GFP
reporters were constructed from single-integrating plasmids (Damon et al., 2015). To make the dual YFP-mCherry reporter for the assays described in Figure 6G, a constitutively-expressed TDH3pr-mCherry construct was integrated in tandem with the GAL1pr-YFP reporter at the HO locus.
A
uthor Man
uscr
ipt
A
uthor Man
uscr
ipt
A
uthor Man
uscr
ipt
A
uthor Man
uscr
ipt
Mis-segregation frequency of non-targeted chromosomes—After mis-segregation in SC-RG, cultures were released into SC-D and fixed with 3.7% formaldehyde after 3 and 5 hours of growth at room temperature. The number of GFP dots per cell was counted for 100 unbudded cells at each time point. Unbudded cells containing 2 GFP dots were classified as having mis-segregated the GFP marked chromosome. One experimental replicate was performed.
Fluorescence microscopy—For GFP dot imaging, cells were either imaged live or fixed in 3.7% formaldehyde for 15 minutes at room temperature and then resuspended in 0.1 M potassium phosphate (KPi pH 6.4)/1.2 M sorbitol. To visualize biotin labeling, cells were fixed in 3.7% formaldehyde for 15 minutes at room temperature and then resuspended in 0.1 M potassium phosphate (KPi pH 6.4)/1.2 M sorbitol with 1 μg/ml streptavidin conjugated to Alexa 568 fluorophore (Molecular Probes). Cells were then washed once in 0.1 M potassium phosphate (KPi pH 6.4)/1.2 M sorbitol. Cells were imaged using a Zeiss Axioplan 2
microscope (Carl Zeiss) and a Hamamatsu OCRA-ER digital camera (Hamamatsu).
Biotin labeling and sorting—Cells were arrested with α-factor in YEP-R medium at 30°C and labeled with biotin as described below (Smeal et al., 1996). Upon release from the G1 arrest, cells were switched to medium containing galactose (YEP-RG) to inactivate CEN4. Cells were then transferred to YEP-D medium at 30°C to stop further chromosome mis-segregation and grown for 1 or 5 hours. To purify populations of disomic cells for proteomic quantification following chromosome mis-segregation, we used a previously described method to purify mother cells (Smeal et al., 1996).
Cells were grown to mid-log phase in YEP-R and then arrested in G1 with the yeast mating pheromone α-factor (5 μg/ml). Following G1 arrest, cells were washed 3 times in phosphate buffered saline (PBS) pH 8.0 and labeled with EZ-Link Sulfo-NHS-LC-Biotin (1 mg biotin in PBS pH 8.0 per 1 OD600 unit of cells; Thermo Scientific) at 4°C for 30 minutes. Biotin
forms permanent amide bonds with primary amines on cell surface proteins, thus labeling the cell wall of the G1 arrested cells. As the cell wall is built de novo during budding, release from the G1 block in the absence of biotin results in the mother cell being labeled with biotin while the bud is not labeled. Following biotin labeling, cells were washed 4 times with PBS pH 8.0/100 mM glycine to remove excess biotin.
After biotin labeling, cells were transferred into YEP-RG medium to induce chromosome mis-segregation. Cells were grown for 120 minutes in YEP-RG at 30°C (one cell division). After nearly all cells had finished dividing, cells were transferred to YEP-D and grown at 30°C for 1 hour. To purify biotin labeled cells, cells were first washed with PBS pH 7.4/0.5% bovine serum albumin (BSA) and then incubated with anti-biotin magnetic beads (Miltenyi Biotec) in PBS pH 7.4/0.5% BSA for 15 minutes at 4°C. Cells were washed once more with PBS pH 7.4/0.5% BSA and then resuspended in PBS pH 7.4/0.5% BSA and run over LS columns fit with a pre-separation filter on a QuadroMACS separator attached to a MACS MultiStand (Miltenyi Biotec) to retain biotin-labeled cells. Biotin labeled cells were eluted from the columns with PBS pH 7.4/0.5% BSA following removal from the
QuadroMACS separator. Cells were then washed once with PBS pH 7.4 and resuspended in YEP-D and grown at 30°C. Samples for analysis were taken at times indicated in Figure 1B.
A
uthor Man
uscr
ipt
A
uthor Man
uscr
ipt
A
uthor Man
uscr
ipt
A
uthor Man
uscr
ipt
Chronic disome IV cells shown in Figure 1A were grown to mid-log phase in YEP-D at 30°C and then harvested for preparation of protein extracts.
Protein quantification by mass spectrometry—Preparation of protein extracts was adapted from Dephoure et al. (2014). Briefly, cells were lysed using a FastPrep-24 (MP Biomedicals) in a buffer containing 8 M urea, 75 mM NaCl, and 50 mM Tris-Cl pH 8.2 using 3–6 cycles of 45 s at 4°C separated by 5 minute incubations at 4°C. Samples were broken until ~70% of cells had lysed as confirmed by light microscopy. Lysates were cleared by centrifugation at 14,000xg for 15 minutes at 4°C. Protein concentrations were determined using the Bradford protein assay (Bio-Rad). Further sample preparation, TMT labeling, and sample fractionation was performed as described in Dephoure et al. (2014). One biological replicate was performed. Samples were run with 3 technical replicates on a Thermo Q Exactive mass spectrometer (Thermo Fisher Scientific). Database searching was conducted using Mascot (Matrix Science).
Protein ratios were normalized to account for minor variations in sample mixing by centering the log2 protein abundance ratio distribution over zero, as described in Dephoure
et al. (2014). When calculating the normalization factor, proteins on the disomic chromosomes were excluded. We expect most proteins (except those on the disomic chromosome) to be present at a one-to-one ratio.
Calculation of expectation value for protein abundance ratio in Figure 1A–D after chromosome mis-segregation—While mis-segregation occurs in many of the cells in the population, mis-segregation itself and the isolation of disomic cells are not fully efficient. One hour following chromosome mis-segregation, the biotin-labeled purified cell culture contained 67% cells disomic for chromosome IV, 20% euploid cells, and 13% cells lacking chromosome IV (nullisomes). Five hours following chromosome mis-segregation, the biotin-labeled purified population was comprised of 61% disomes, 34% euploid cells, and 5% nullisomes. The slight decrease in the proportion of disomic cells at the 5 hour time point compared to the 1 hour time point is likely due to the reduced proliferation rate of disome IV cells compared to euploid cells.
The expected ratio of proteins encoded on chromosome IV from disome IV and euploid control strains depends on two factors: 1) the percentage of disomes, euploid cells, and nullisomes, and 2) the rate of protein turnover from degradation versus dilution. Given the measured percent of each karyotype at one and five hours, an expected value for the protein abundance ratio can be calculated for different models of protein turnover. In the extreme where proteins are only diluted by proliferation (using proliferation rate measured in Figure 3A and correcting for the ratio compression; see below) one would expect a log2 protein
abundance of 0.12 at 1 hour and 0.28 at 5 hours. In the other extreme where protein turnover is instantaneous, the expectation is a log2 protein abundance of 0.27 at 1 hour and 0.28 at 5
hours. One hour following chromosome mis-segregation, proteins encoded on chromosome IV were elevated compared to proteins encoded by the euploid chromosomes, with a mean log2 protein abundance ratio of 0.21 for proteins on chromosome IV, compared to a mean of
0 for proteins on all other chromosomes (Figure 1C). Levels of chromosome IV-encoded
A
uthor Man
uscr
ipt
A
uthor Man
uscr
ipt
A
uthor Man
uscr
ipt
A
uthor Man
uscr
ipt
proteins increased further to a mean log2 protein abundance ratio of 0.32 five hours
following chromosome mis-segregation (Figure 1D).
Calculation of expected ratios: Given that previous work showed that proteins encoded on
disomic chromosomes exhibit a protein ratio of 2:1 versus proteins encoded by euploid chromosomes (Dephoure et al., 2014), we assumed that the observed log2 protein abundance
ratio of 1.4 for proteins encoded on disomic chromosome IV was due to ratio compression. We can therefore calculate a ratio compression factor for our samples, which then can then be used to calculate the actual ratio using the following formula which yields a ratio compression factor (x in the equation) of 1.66.
To calculate the expected log2 protein abundance ratio we first used the following
relationship:
When protein turnover is high this relationship simplifies to:
The expectation value for the log2 protein abundance ratio is calculated with the following
formula
Aneuploid colony size measurements—Cells were grown in YEP-R and then transferred to YEP-RG for 160 minutes to induce chromosome mis-segregation. Cells were then plated on YEP-D agar plates. Mother-daughter pairs that had just completed a cell division were separated by micromanipulation and allowed to grow into colonies at 30°C. Colony size was measured 40 – 48 hours later when colony size was still increasing exponentially. Euploid colonies were grown on the same plate and were either from a wild-type strain or from cells in the experimental strain that did not missegregate a chromosome. Colony area was measured using ImageJ. Experiment was performed 3 times with similar results. Data from one representative experimental replicate are shown in Figure 1E–F and Figure S1B.
To calculate aneuploid to euploid colony area ratio, euploid colony area was measured and averaged per plate, with a separate average for euploid mothers and euploid daughters. Euploid cells on the same plate as the aneuploid cells were used for analysis to control for
A
uthor Man
uscr
ipt
A
uthor Man
uscr
ipt
A
uthor Man
uscr
ipt
A
uthor Man
uscr
ipt
plate-to-plate variability. A value for each individual aneuploid colony was calculated as a ratio of the aneuploid colony area to the mean euploid colony area for euploid cells. For disomes and trisomes, the mean colony area for euploid mothers was used. For monosomes, the mean colony area for euploid daughters was used. Each circle in Figure 1F represents the mean of all aneuploid/euploid ratios for a particular karyotype. Error bars indicate the standard deviation of the aneuploid/euploid ratios, not accounting for error propagation from euploid cells.
Chromosome mis-segregation was confirmed by determining whether colonies could grow on plates lacking uracil. The inducible chromosome is marked with URA3 at the conditional centromere, so colony pairs in which one colony (arising from the daughter cell) is
auxotrophic for growth on uracil and the other colony (arising from the mother cell) is prototrophic for growth on uracil indicates that a chromosome mis-segregation event occurred. For aneuploid strains with severe fitness defects, colonies were grown at 30°C until colonies were large enough to test for uracil prototrophy via replica-plating. Colonies were also tested for growth on plates containing glycerol as the sole carbon source. Colonies that did not grow on this medium were excluded from analysis as they are respiratory deficient, which causes slow growth. Rarely, the inducible chromosome was segregated into the daughter cell instead of the mother; these mis-segregation events were excluded from analysis.
The colony mis-segregation assay in haploid cells was used to determine the chromosome mis-segregation rates presented in Figure S1B. The growth defects observed in monosomes were more severe than the growth defects observed in disomes and trisomes (Figures 1F, S1B). While the sizes of many monosomic colonies were less than 1% of the sizes of colonies formed by euploid cells after ~48 hours of growth, nearly all monosomic strains eventually formed colonies after many days of growth. The only monosomy that was inviable was chromosome XIII monosomy, due to monosomy of TUB1 which is lethal (Katz et al., 1990). Disomy and trisomy were better tolerated than monosomy, with the exception of disomy VI and trisomy VI. These chromosomal gains are inviable due to an increase in TUB2 copy number (Katz et al., 1990).
Live-cell imaging
Differentiating aneuploid from euploid cells in live-cell cell cycle analysis: For cell cycle
analyses, aneuploid cells were differentiated from euploid cells by counting the number of GFP dots present in a cell. In all euploid strains, 1 GFP dot per cell indicates euploidy. For disomes and trisomes of single chromosomes, the presence of 2 GFP dots in the cell indicates disomy or trisomy while 1 GFP dot indicates euploidy. For disomes and trisomes of 2 chromosomes, 4 GFP dots indicate disomy or trisomy. For disomes and trisomes of 3 chromosomes, cells with 4, 5 or 6 GFP dots were scored as disomes and trisomes, as it was difficult to accurately count GFP dots at numbers greater than 4 dots per cell. For all monosomes (single or multiple chromosomes), 0 GFP dots per cell indicates monosomy. In all analyses, euploid cells were either from the wild-type control strain or from cells in the experimental strain that did not mis-segregate a chromosome.
A
uthor Man
uscr
ipt
A
uthor Man
uscr
ipt
A
uthor Man
uscr
ipt
A
uthor Man
uscr
ipt
Cell cycle analysis image acquisition: For inducible aneuploids, cells were grown in SC-R
to mid-log phase then transferred to SC-RG and grown for 160 minutes to induce
chromosome mis-segregation. Chronic disomic strains were grown in SC-D medium to mid-log phase. Then, for both inducible aneuploids and chronic disomes, cells were transferred to SC-D and layered on an agar pad (2% agarose, SC-D) affixed to a glass slide and covered with a cover slip. Cells were imaged at 5-minute intervals for 8–10 hours using a Zeiss Axio Observer-Z1 with a 63x objective (Carl Zeiss), equipped with a Zeiss Definite Focus module (Carl Zeiss) and a Hamamatsu ORCA-AG digital camera (Hamamatsu). Nine Z-stacks (0.6 microns apart) were acquired and maximally projected. MetaMorph software (Molecular Devices) was used for image acquisition and processing.
Cell cycle analysis data processing: For cell cycle analyses of aneuploid cells,
approximately 20 aneuploid cells and 10 euploid cells were scored per experiment. One or two independent biological replicates were performed for each aneuploid strain. Data from one representative biological replicate for each aneuploid strain are shown in Figures 2, 3, 4, and 5 and Figures S2, S3, S4, and S5. As most cells were analyzed for multiple divisions, we analyzed between 20 – 80 cell divisions for most strains. See Table S1 for the number of cell cycle stages (n) analyzed in each experiment. G1 duration, S+early M phase duration, anaphase onset to cytokinesis duration, and division time (cytokinesis to cytokinesis) were measured for each cell following chromosome mis-segregation. Analyses of cells started either at bud emergence or at anaphase onset in the first division following chromosome mis-segregation. We were not able to image cells during the first G1 phase following chromosome mis-segregation because of the time needed to prepare the cells for imaging. Thus, division time analyses start in the second division following chromosome mis-segregation.
At the end of the time-lapse, cells that were in G1 and had spent at least 100 minutes in G1 were scored as arrested and included in G1 duration calculations. Cells that were in G1 at the end of the time-lapse and had spent less than 100 minutes in G1 were not considered arrested and excluded from analysis for calculating G1 duration. At the end of the time-lapse, cells that had passed bud emergence but had not reached anaphase onset and had spent at least 200 minutes in that stage were scored as arrested and included in S+early M phase duration calculations. Cells that had passed bud emergence at the end of the time-lapse and had not reached anaphase onset but had spent less than 200 minutes in this stage were not considered arrested and excluded from analysis for calculating S+early M phase duration. To calculate standard deviation of cell populations and compare variance using the F-test, raw data (in minutes) were used (Figure 2B–E, Figure 3B,C,F,G,I–K, Figure 4D–G, Figure 5D–G, and Figure S4I-L). These analyses were done on the combined data from all divisions measured following chromosome mis-segregation for all cells of a given karyotype for a particular cell cycle stage (G1, S+early M phase, or division time duration). Aneuploid cells were compared to euploid cells from the same experiment to account for minor day-to-day variability.
In Figure 2A, Figure 3A,E, Figure 4A–C, Figure 5A–C, Figure S2B–D, Figure S3A–C,E–G, and Figure S4F–H, cell cycle measurements for aneuploid cells were normalized to euploid
A
uthor Man
uscr
ipt
A
uthor Man
uscr
ipt
A
uthor Man
uscr
ipt
A
uthor Man
uscr
ipt
cells from the same experiment to allow us to compare cell cycle measurements among experiments. Each aneuploid cell measurement for G1 duration, S+early M phase duration, anaphase duration, or total division time was taken as a ratio of the mean of all euploid cells for the same measurement from the same division. For example, the G1 duration
measurement for an inducible aneuploid cell in its third division following chromosome mis-segregation would be normalized to the mean of the G1 duration for all euploid cells in the third division following chromosome mis-segregation. Normalization to the euploid strain controls for day-to-day variability in experiments and for changes in cell cycle durations upon shift from raffinose+galactose (SC-RG) as the carbon source to glucose (SC-D) as the carbon source. In the same manner, measurements of cell cycle duration in chronic disomes were normalized to euploid controls by cell cycle stage and division. Log2 transformed
aneuploid to euploid ratios are plotted in the figures.
In Figures 2F and 3D,H, the longest G1 or S+early M phases were removed from the aneuploid data set until the standard deviation of the aneuploid cell cycle stage was equal to that of the corresponding euploid cell cycle stage in the same experiment. Standard
deviations were considered equal when no longer significantly different by the F-test. The percent of the total number of measured cell cycle stages (G1 or S+early M phase) that were removed to equalize standard deviations of euploid and aneuploid data is reported.
Galactose and stress response reporter analyses—All GAL1pr-YFP, UPRE-GFP, and HSE-YFP reporter experiments were performed in synthetic dropout medium containing 1.7g/L yeast nitrogen base (BD Difco), 1g/L monosodium glutamate, 200μg/mL Geneticin (G418), and histidine dropout complete supplement mix (Sunrise Science), plus carbon sources. In the galactose response experiments, outgrowth cultures were grown in synthetic dropout medium supplemented with 2% raffinose, and induction assays were performed in synthetic dropout base supplemented with 0.25% galactose and a two-fold gradient of glucose ranging from 1.0%–0.002% (including a 0% condition). For the stress response experiments, all cultures were grown in synthetic dropout medium supplemented with 2% glucose. All 30ºC incubations for the GAL1pr-YFP, UPRE-GFP, and HSE-YFP reporter experiments were performed in a humidified incubator (Infor Multitron) with rotary shaking at 230 rpm (tubes and flasks) or 999 rpm (deep 96-well plates). Higher-temperature
incubations were conducted in an incubating microplate shaker (VWR) with rotary shaking at 1000rpm.
Galactose response assays—Strains were inoculated from colonies streaked on a G418/-his plate into liquid dropout medium supplemented with 2% glucose and incubated at 30ºC for 24 hours until cultures reached saturation. Cultures were diluted 1:100 – 1:400 into medium containing 2% raffinose and grown for 16–18 hours. For the steady-state glucose gradient assay, raffinose cultures at a final OD600≤ 0.1 were pelleted, washed twice, and then
resuspended 1:1 in synthetic dropout medium without carbon and diluted 1:100 into the glucose gradient to measure expression of the GAL1 reporter.
For the kinetic response assays, raffinose cultures with a final OD600 0.1–0.3 were selected;
a 0 hour time point of the raffinose culture was harvested by addition of a concentrated TE/ sodium azide 'stop solution' to a final (1X) concentration of 0.1% sodium azide. The