This article has been accepted for publication and undergone full peer review but has not been through the copyediting, typesetting, pagination and proofreading process which may
Effects of ambient temperature in association with photoperiod on phenology and on the expressions of major plant developmental genes in wheat (Triticum aestivum L.)
Running head: Ambient temperature on plant development in wheat
Tibor Kiss1, Laura E. Dixon2, Alexandra Soltész1, Judit Bányai1, Marianna Mayer1, Krisztina Balla1, Vincent Allard3, Gábor Galiba1, Gustavo A. Slafer4, Simon Griffiths2, Ottó Veisz1 and Ildikó Karsai1
1 Centre for Agricultural Research, Hungarian Academy of Sciences, H-2462 Martonvásár, Hungary,
2 John Innes Centre, Norwich NR4 7UH, UK,
3 Institut National de Recherche Agronomique, F-63100 Clermont-Ferrand, France, 4 University of Lleida, E25198 Lleida, Spain
Correspondig author: Ildikó Karsai, Centre for Agricultural Research, Hungarian Academy of Sciences, H-2462 Martonvásár, Hungary, tel: 36-22-569-500; fax: 36-22-460-213; e-mail: karsai.ildiko@agrar.mta.hu
Abstract
In addition to its role in vernalization, temperature is an important environmental stimulus in determining plant growth and development. We used factorial combinations of two photoperiods (16H, 12H) and three temperature levels (11C, 18C, and 25C) to study the temperature responses of 19 wheat cultivars with established genetic relationships. Temperature produced more significant effects on plant development than photoperiod, with
strong genotypic components. Wheat genotypes with PPD-D1 photoperiod sensitive allele were sensitive to temperature; their development was delayed by higher temperature, which intensified under non-inductive conditions. The effect of temperature on plant development was not proportional; it influenced the stem elongation to the largest extent, warmer temperature lengthened the lag phase between the detection of first node and the beginning of intensive stem elongation. The gene expression patterns of VRN1, VRN2 and PPD1 were also significantly modified by temperature, while VRN3 was more chronologically regulated. The associations between VRN1 and VRN3 gene expression with early apex development were significant in all treatments, but was only significant for later plant developmental phases under optimal conditions (16H and 18C). Under 16H, the magnitude of the transient peak expression of VRN2 observed at 18C and 25C associated with the later developmental phases.
Key words: wheat, temperature, photoperiod, apex and plant development, VRN1, VRN2,
VRN3 and PPD1 gene expressions
Highlights: Following vernalization ambient temperature has a significant effect in determining plant development in cereals via influencing the start and the speed of intensive stem elongation. Ambient temperature significantly influences the expression levels of VRN1,
VRN2 vernalization response and PPD1 photoperiod sensitivity genes in gene specific
manners indicating that these genes may participate in the regulation network of ambient temperature sensing.
Introduction
In temperate cereals the basic and best described environmental cues determining plant development are low temperatures and photoperiod, based on which, distinct categories of genotypes with or without vernalization requirements (winter vs. spring growth habits), and of photoperiod sensitivity or insensitivity can be clearly distinguished. The genetic basis of these developmental mechanisms have already been studied in detail, as a result of which the structure, allele types and functions of the major developmental genes contributing to the regulation of vernalization response and photoperiod sensitivity have mostly been revealed (Campoli & von Korff 2014; Fjellheim et al. 2014; Cockram et al. 2015; Deng et al. 2015). In cereals, the vernalization requirement is determined by the epistatic interactions among three major vernalization response genes, VRN1, VRN2, and VRN3; VRN1 and VRN3 encode dominant flowering activators, while VRN2 encodes a dominant repressor of flowering (Trevaskis et al. 2003; Trevaskis et al. 2007; Yan et al. 2003; Yan et al. 2004; Fu et al. 2005; Karsai et al. 2005; von Zitzewitz et al. 2005; Faure et al. 2007; Diaz et al. 2012). In a general model, flowering of a winter type cereal is repressed by high levels of VRN2 transcript during autumn which suppress the expression of VRN3. During the winter months, the low temperature activated VRN1 transcription down-regulates VRN2 expression in parallel with the saturation of the vernalization requirement enabling the plant to flower. When the photoperiod is longer than 12 hours, VRN1 up-regulates the expression of VRN3, which further enhances flowering (Distelfeld et al. 2009; Campoli & von Korff 2014; Deng et al. 2015). PPD1 is the major gene of photoperiod sensitivity (Turner et al. 2005; Beales et al. 2007) and acts both with the photoperiod regulating pathway and the circadian clock, PPD1 further activates the expression of VRN3 under long photoperiods (Campoli & von Korff 2014). Thus the vernalization and photoperiodic pathways converge on VRN3, which
integrates the various environmental signals (Campoli & von Korff 2014). The functional polymorphisms in these plant developmental genes have been studied in detail. In the case of
VRN1, various sequence differences were detected in the promoter, exon1 and intron1 regions
of VRN-A1, but fewer polymorphisms have been found in VRN-B1 and VRN-D1 (Yan et al. 2004; Fu et al. 2005; Milec et al. 2013). Notably, in all three VRN1 genes, the basis of the dominant spring growth habit alleles is a large deletion which occurred in intron1. In the case of VRN2, the deletion of the entire locus or point mutations in the CCT domain result in spring varieties (Yan et al., 2004; Karsai et al., 2005; von Zitzewitz et al., 2005; Distelfeld et
al., 2009). In wheat, the photoperiod insensitivity alleles in the PPD1 genes result in rapid
heading irrespective of the photoperiod. While the role of PPD-A1 is not significant in T.
aestivum, several functional polymorphisms were identified in PPD-B1 and PPD-D1 leading
to significant variations in heading date (Beales et al. 2007; Diaz et al. 2012; Kiss et al. 2014). The basis of insensitivity is the increased gene copy number in the PPD-B1 locus, while in the case of PPD-D1 gene it is a large deletion of 2089 bp in the promoter region leading to over-expression (Beales et al. 2007; Díaz et al. 2012; Nishida et al. 2013).
In addition to and building on the basic developmental mechanisms of vernalization and photoperiod sensitivity, there are several other environmental stimuli which influence the rate of plant growth and development, temperature being one of the most influential among them. Temperature as an important seasonal cue is more complex than photoperiod in relation to both its characteristics and its effects. Photoperiod follows a predictable pattern from year to year, whereas the temperature profile of a given area can show tremendous and unpredictable variation among seasons, years and even within 24 hours. On the plant level, increases in temperature accelerates crop development more than growth, thus the period available for the production of biomass shortens to the extent that plants at the time of harvest are usually smaller and with fewer tillers (Atkinson & Porter 1996). Thus the physiologically optimal
temperature can be defined as the range in which the plant growth and development are proceeding at maximal rate but there are no strong negative effects on plant biomass production. Temperatures extending beyond (heat stress) or below (cold stress) of this range may severely affect plant fitness and survival (Bahuguna & Jagadish 2014). The majority of research has focused on understanding plant responses to these extreme temperatures, with limited attention directed to the dissection of the molecular mechanisms underlying plant responses to changes in the temperature range between the two extremes.
All crops and all phases of development are sensitive to temperature; (Slafer et al. 2015), but there is genotypic variation in the magnitude of response (Rawson & Richards 1993; Slafer & Rawson 1995). The exact nature of the involvement of temperature in the genetic regulatory network for flowering is not completely understood yet. In Arabidopsis thaliana, the existence of a thermosensory pathway has already been established, which acts via complex crosstalk both with the low-temperature vernalization and photoperiod pathways (Wellmer & Riechmann 2010). This interplay of temperature, light and endogenous factors in temperature signalling confer adaptive plasticity to plants under fluctuating seasonal conditions. In A.
thaliana, the existence of natural variation in responses to temperature has also been
revealed, though it was found to be smaller in magnitude than that of responses to vernalization and photoperiod (Lempe et al. 2005).
The experimental data suggest that the control of the floral transition in response to temperature is regulated differently in different plant species (Hemming et al. 2012; Capovilla et al. 2015). Compared to A. thaliana, much less is known about the genetic components of temperature sensing in cereals, where most of the research has been conducted to evaluate the effects of temperature on plant development and on the duration of the different plant phenophases. It has been proven that there is a wide range of responses to temperature among cereal genotypes (Slafer & Rawson 1995; Slafer & Rawson 1996;
Atkinson & Porter 1996; Karsai et al. 2013). In addition, the sensitivity of cereal genotypes to temperature was proven to show marked changes in association with the various developmental phases (Slafer & Rawson 1996; Borrás-Gelonch et al. 2012; Karsai et al. 2013). With very few exceptions, however there is limited information either on the genetic components of temperature sensing or on how temperature influences the activities of the major plant developmental genes controlling vernalization requirement and photoperiod sensitivity (Bullrich et al. 2002; Appendino & Slafer, 2003; Lewis et al. 2008; Borrás-Gelonch et al. 2010; Hemming et al. 2012). In a series of field experiments differing in photoperiod and temperature levels Borrás-Gelonch et al. (2012), suggested that the magnitude of the PPD-H1 photoperiod sensitivity gene affecting plant development was influenced not only by the daylength but also by the average temperature of the field. However, the experimental set up and the population type used does not make it possible to determine exactly the type of associations between temperature and plant development. Hemming et al. (2012) examined the changes in gene expressions of plant developmental genes in certain barley cultivars under long and short photoperiods applying two temperature levels, and they did not identify any significant changes in the expressions of the vernalization response (VRN-H1, VRN-H2, VRN-H3) and the photoperiod sensitivity
(PPD-H1) genes across the temperature levels. In wheat there is even less information on the
genetic background of temperature response, though the interaction between temperature and photoperiod has been suggested to be a significant component in eliciting different developmental responses of wheat genotypes (Slafer & Rawson 1996; Borrás-Gelonch et al. 2012).
In the present work our first objective was to study the effect of temperature via its interaction with photoperiod on plant development of wheat by evaluating both apex development and series of consecutive developmental sub-phases from seedling stage to
heading. In addition, we examined how the expression patterns of the three major vernalization response genes (VRN1, VRN2 and VRN3), and the major photoperiod sensitivity gene (PPD1) are influenced by temperature under different photoperiods and finally we aimed at establishing causal relationships between the gene expression levels and the various plant developmental phases. For this purpose we conducted a series of experiments using factorial combinations of two photoperiod and three temperature levels under controlled environments to exclude the possible confounding effects of other environmental factors. Under these conditions the plant developmental patterns of 19 wheat cultivars of various geographic origins were thoroughly evaluated. In addition, the time course changes (both thermal and chronological) in the expression of the major vernalization response and photoperiod sensitivity genes were also evaluated in a subset of 11 wheat cultivars.
Materials and methods
Plant materials
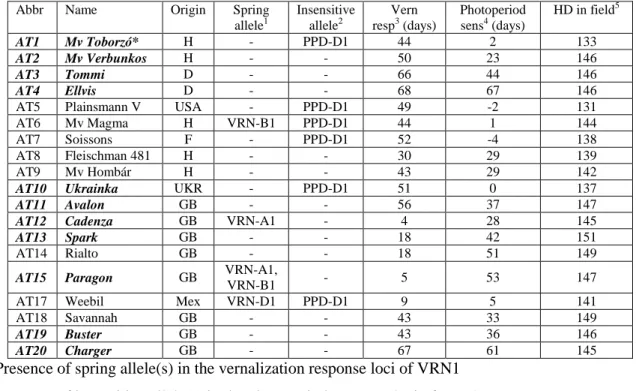
In order to examine the effect of temperature in association with photoperiod in wheat, 19 wheat cultivars of various geographic origins were included into a series of controlled environmental tests. The basic information on the cultivars is listed in Table 1. In parallel to the controlled experiments discussed in this article, we also determined the vernalization response, and photoperiod sensitivity of these cultivars, and measured their heading date under field conditions and included these data in Table 1 as additional information.
Phenotypic characterization
The controlled tests consisted of the factorial combinations of 2 photoperiods (16 hour light period in a 24-hour day, referred to as LD; and 12 hour light period in a 24-hour day referred to as SD) and three constant ambient temperature levels (11, 18 and 25C) in the phytotron
facilities of the Centre of Agricultural Research of the Hungarian Academy of Sciences (MTA ATK), Martonvásár, Hungary, with all the other environmental factors kept uniform across the treatments. The temperature levels we used in the experiments were between the two extremes of cold or heat stress. As Porter & Gawith (1999) identified the optimum ambient temperature for wheat being in the range of 17–23C over the course of the entire growing season, the three temperatures we applied represented sub-optimal (11C), optimal (18C) and supra-optimal but no-heat-stress (25C) temperature levels. To refer to this range we use the term of ambient temperature only for simplifying the presentation of our results. The same three Conviron PGR-15 growth chambers (Controlled Environments Limited, Winnipeg, Canada) were used for these purposes, each representing one temperature level; first the three temperatures at LD were tested in parallel, which was followed by the three temperature treatments at SD. The light source was metal halide lamps and the light intensity was set to 240 µmolm−2s−1 photosynthetic photon flux density (PPFD), at plant level. For all the experiments, the plants were germinated in Jiffy pots at room temperature for one week, which was followed by the vernalization treatment at 3°C for 45 days under short photoperiod (9 hour light period in a 24-hour day) and low PPFD (20 µmolm−2s−1). At the end of the vernalization the plants were at 1-2 leaf stages. They were then transplanted into pots 12 cm in diameter and 18 cm in height, with a soil capacity of 1.5 kg filled with a 4:1 mixture of garden soil and sand, and they were placed into the growth chambers. Four plants of each genotype were planted in two pots as replications giving an average plant density of approximately 60 plants/m2 in the chamber space.
The plants were measured in 5-day intervals for number of leaves and plant height from soil to last leaf sheath on the main stem. In comparing the different treatments, thermal time (TT) was calculated as the sums of daily average temperatures (i.e. assuming a base temperature of 0ºC and an optimum temperature higher than 25ºC for all G × E conditions analysed). The
connection between thermal and chronological times under the various ambient temperature levels is listed in Supplementary Table 1. The associations between thermal time and time course data for plant height, and number of leaves were calculated as described by Kiss et al. (2011). Regular monitoring of the plant developmental traits made it possible to identify a series of consecutive phenophases that spanned the life cycle from seedling stage to attainment of maximum plant height. Thus, the phenophases were defined based on the Zadoks’ scale (Zadoks et al. 1974) as follows: appearance of the first main stem node (ZD31), onset of intensive stem elongation (ZD30), appearance and full expansion of the flag leaf (ZD37, ZD39), booting stage (ZD49), heading (ZD59) and the end of intensive stem elongation (ZDSE). The experiments were terminated after 140 days at 25°C (equivalent to 3500 °Cd on thermal time), 150 days at 18°C (2700 °Cd) and 180 days at 11°C (2000 °Cd). For genotypes not reaching a given developmental stage till then the respective thermal time values were given for statistical purposes.
In each treatment, sets of extra plants for each genotype were also grown for regular sampling of three plants as replications (at 100, 200, 300, 500, 1000, and 1500 °Cd, if necessary) in order to examine the apex structure by measuring the length of the apex and evaluating the apex developmental phase using the Waddington scale (Waddington & Cartwright 1983). In addition, the thermal time to double ridge (DR) and terminal spikelet (TS) formation in the apex was determined for all the genotypes in all treatments.
The statistical analyses were carried out using Statistica 6, GenStat 18.0 and SPSS 16.0 program packages. The variance components were estimated using a restricted maximum likelihood method (REML). Broad-sense heritability (h2) was calculated as genetic variance divided by total variance. The phenotypic diversity of the 19 wheat cultivars based on the trait matrix (19 genotypes × 6 environments × 16 phenology traits) was established using the UPGMA grouping module in Statistica 6.
Genotypic characterization
The major allele types of the 19 wheat cultivars in the VRN and the PPD genes (Table 1) were determined using gene allele specific primers as listed in Kiss et al. (2014). In addition, they were subjected to the 15K Illumina SNP platform (TraitGenetics Ltd, Gatersleben, Germany), which resulted in 4971 polymorphic markers after leaving out those with any missing values, being monomorphic, or rare alleles (characteristic to only one genotype) or showing complete linkage within the same genetic distance in the consensus marker map provided by the company. The genetic diversity of the 19 wheat cultivars was established by calculating the Kinship matrix in the TASSEL 5.0 program.
Studying the gene-expression levels
For studying the gene expressions of the major plant developmental genes, leaf tissues were collected at 0, 100, 200, and 300 thermal times (°Cd) after the end of the vernalization treatment. The last fully expanded leaf was collected one hour after the beginning of the light cycle in each particular treatment. The time-point for sample collection was chosen based on the results of a previous experiment (Allard et al., personal communication), where no strong diurnal cycle was observed for the studied genes. The only exception was PPD1, the expression level of which allowed discriminating photoperiod sensitive and insensitive genotypes only at the start of the day. Leaves of three plants were pooled for one biological replicate, with a total of three biological replicates. Total RNA was isolated using the Qiagen RNeasy plant mini kit after Trizol extraction, with an extra step of DNase treatment programmed in the QIAcube equipment (Qiagen Ltd). The cDNA transcription was performed from 1.0 μg of total RNA using the RevertAid First Strand cDNA synthesis kit (Thermo Scientific Ltd) with the standard protocol provided by the company.
For the expression studies 11 wheat cultivars (listed with bold and italic letters in Table 1) were selected to represent the three phenotypic subgroups which were identified based on the plant developmental patterns (as shown in Results). Changes in the expression levels were analysed for the vernalization response genes, VRN1, VRN2 and VRN3, and for the photoperiod sensitivity gene PPD1 using the generic gene specific primers listed in Supplementary Table 2. The primer pairs amplify all homoeoalleles (A, B and D copy) of each studied gene. The quantitative real-time PCR was carried out in three biological and two technical replicates in a Rotor-Gene Q equipment (Qiagen Ltd) applying the syber-green technology of the company. Expression was normalized to Actin using the Rotor-Gene software, which also takes amplification efficiency into account.
In order to establish causal relationships between the gene expression levels and the various plant developmental phases Principal Component Analysis (PCoA) was carried out on the data matrix of the 11 wheat cultivars containing the gene expression data and the apex developmental data measured at 0, 100, 200, and 300 °Cd as well as plant phenology data. In order to simplify the complex associations we distinguished three, partially technical categories of plant development; (1) early apex development (EA) stands for the Waddington stage and apex length measured at 0, 100, 200, and 300 °Cd, (2) the late apex development (LA) includes the thermal times for reaching double ridge (DR) and terminal spikelet (TS) formation and the interval between these two phases in thermal time (1 and 2 show opposing signs in correlations, making it necessary to separate them), while (3) later plant developmental stages (post TS) cover the thermal times between TS and first node appearance (ZD31TS), and those of first node appearance (ZD31) and booting (ZD49).
Results
Phenology in the context of temperature × photoperiod
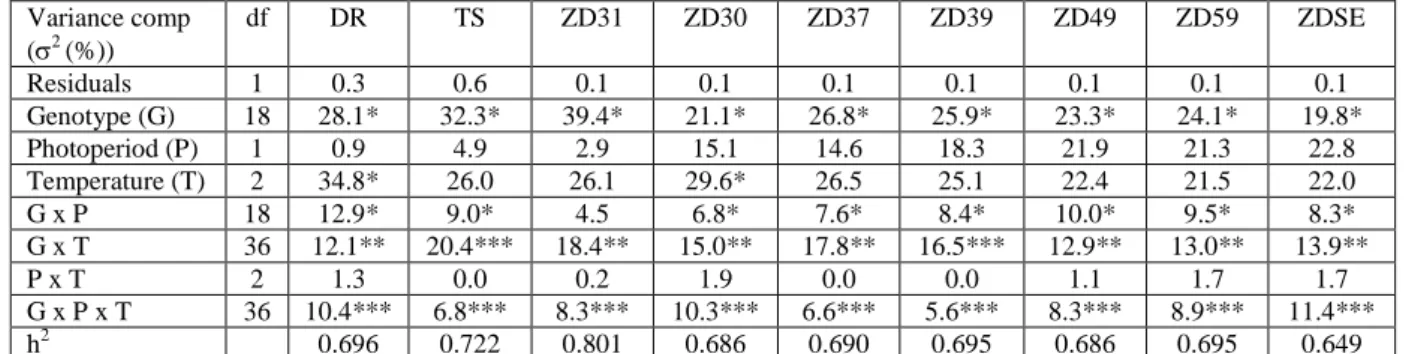
When development was evaluated in thermal time requirements of each phases, the effects of temperature were stronger than those of photoperiod on plant development, especially on the two phases of DR and ZD30. At these developmental phases the temperature effect amounted to one third of the variance, and was also dominant for all the other phases with around a quarter of the variance explained (Table 2). The effect of photoperiod was limited during the early developmental phases, but continuously increased starting from the onset of the intensive stem elongation, reaching its maximum at ZD49, ZD59 and ZDSE phases when the photoperiod contributed to about 22% of the phenotypic variance. Genotype as a main variance component was significant at all the developmental phases, covering a larger portion of the variance at the earlier development, especially at the TS and ZD31 phases (30-40%). Following these phases the effect of genotype gradually decreased to its lowest value of 19.8% at the ZDSE phase. Genotype × temperature interaction covered a significant proportion of the variance at all the phases, being the highest around the terminal spikelet formation and onset of the intensive stem elongation. The genotype × photoperiod and the three way interactions were also significant variance components, but only explained less than 10% of the variance in most of the cases. The interaction between photoperiod and temperature was not significant throughout the development. Due to the high genotypic ratio, the broad-sense heritability/reproducibility (h2) values of the developmental phases were significant and high, between the values of 0.649 (for ZDSE) and 0.80 (Z31).
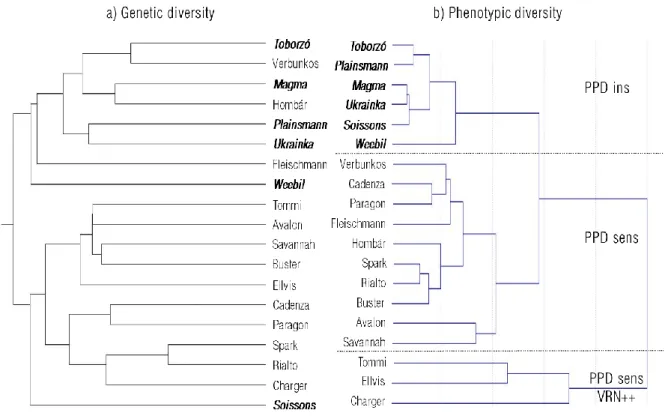
The 19 wheat genotypes represented a wide genetic pool with two separate groups organised by the geographic origin (Fig 1). One group contained all the West-European wheat cultivars,
while the Hungarian cultivars together with the two American genotypes were placed into the other group. The population structure was moderately associated with the PPD-D1 allele type. The insensitive allele was more frequent in the Hungarian and American wheats, but there was one insensitive genotype among the West-European wheats, as well. When the phenotypic responses under the six environments were taken into account, the PPD-D1 allele type became the major separating factor; the reaction patterns of the six wheat genotypes carrying the insensitive allele (PPDins) were distinctly different from those with photoperiod sensitivity (PPDsens). Three cultivars of the sensitive group however (PPDsens, VRN++), with the largest vernalization reactions (Suppl Fig 1.) were the most distinct of all. Due to the strong group patterns detected in the phenotypic values, the results will be presented as averages over the genotypes belonging to each of the three groups in the following sections of the article.
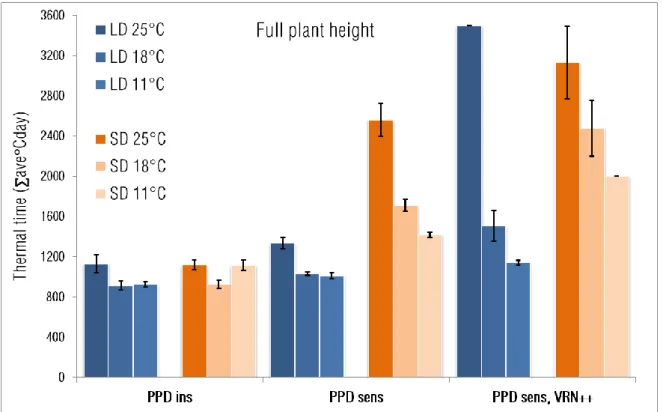
The developmental patterns and the responses to photoperiod and growing temperature were significantly different between the three phenotypic groups (Fig 2). The PPDins group exhibited the fastest plant development under all environmental combinations. Temperature and photoperiod effects were small even if the LD 18°C, LD 11°C and SD 18°C treatment exhibited a small but significantly faster developmental time than LD 25°C, SD 25°C and SD 11°C. In this group, the duration of early phases until terminal spikelet formation (TS) within the whole plant development decreased parallel to the lower temperature levels, irrespective to photoperiod (Fig 3a). The effect of temperature on the interval length between the first node appearance (ZD31) and the beginning of intensive stem elongation (ZD30) however was strongly influenced by the photoperiod, there was a significant increase in Z3031 due to 11°C only under SD. Other developmental phases were relatively proportional at all the six environments.
Under LD, the response patterns of the PPDsens group and the relative duration of the phases were very similar to those of the PPDins (Fig 2 and Fig 3b). Under SD, however the effect of temperature became very pronounced on the development of the PPDsens group. High temperature significantly delayed plant development which was the most evident in the interval between first node appearance (ZD31) and the start of intensive stem elongation (ZD30) (Fig 3b). At SD 25°C, the interval of Z3031 took 28% of the whole developmental span mostly at the expense of the interval of the start of intensive stem elongation (ZD30) to flag leaf appearance (ZD37); the flag leaves had already expanded before the start of intensive stem elongation.
The reaction patterns of the PPDsens, VRN++ group were influenced by the temperature to the largest extent (Fig 2). The plant development of this group was extremely delayed both by the 25°C temperature and by SD. Plant development completed normally only at LD 18°C, LD 11°C and SD 18°C, under all the other conditions their development stopped at various developmental stages (Fig 3c). At 25°C they reached the ZD31 stage, but the intensive stem elongation did not start at all (LD) or was extremely delayed (SD) as it can be seen by the increased ratio of Z3031 interval in Fig3c. Under SD 11°C again the process of intensive stem elongation was disrupted, but in a different way; the intensive stem elongation started right after the first node appearance and proceeded till the flag leaf extended. Afterwards however the stem growth stopped between booting (ZD49) and heading (ZD59), as a result of which the heads remained in the flag leaf sheaths in most of the cases.
Expression patterns of the major developmental genes in the context of temperature × photoperiod
In the case of 11 wheat cultivars, the expression patterns of VRN1, VRN2, VRN3 and PPD1 genes were also evaluated at early stages of the plant development at four thermal time points
of 0, 100, 200, and 300 °Cd for all treatments. In addition, at the same thermal time points the apex developmental stages were also determined.
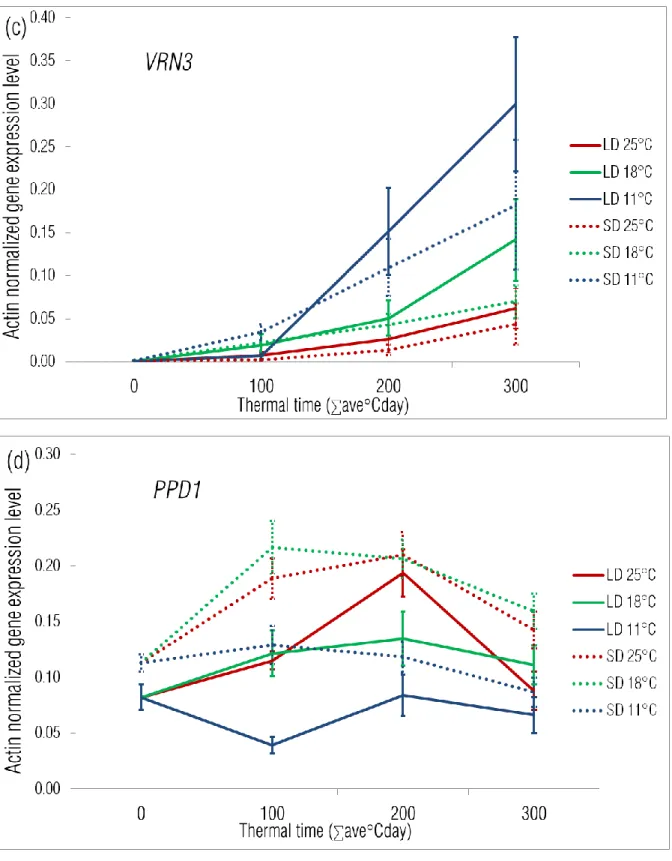
In analysing the gene expressions both the thermal time and the calendar time course data were compared in order to be able to determine the true effects of the environmental factors on the individual gene (Fig 4 and Suppl. Fig 2). This parallel evaluation revealed that with the exception of VRN3, temperature significantly influenced the gene expression levels of the major plant developmental genes, VRN1, VRN2 and PPD1, the magnitude of which was dependent on the photoperiod.
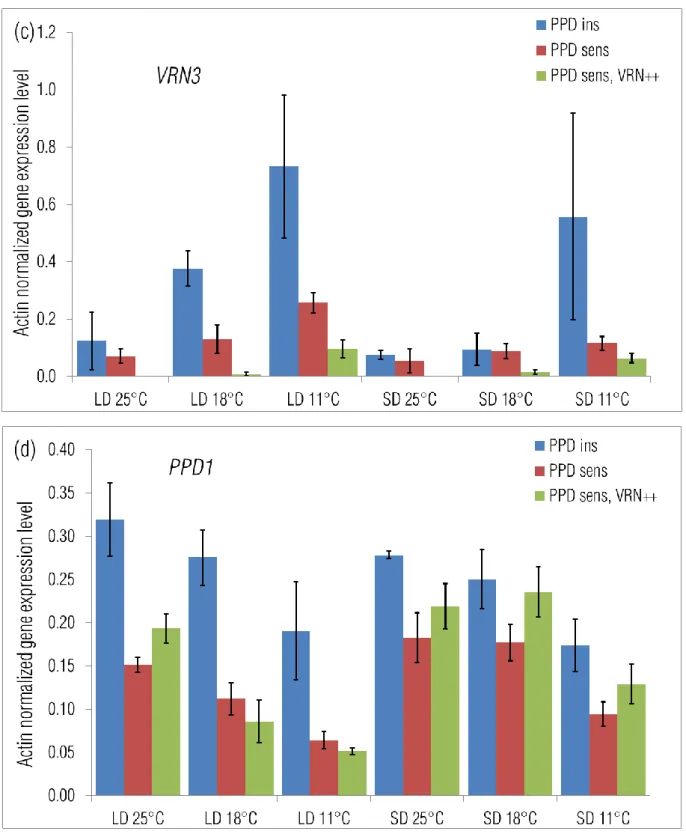
The VRN1 transcript was already present at a low level by the end of the vernalization treatment (Fig 4a). This transcript level remained the same at 25°C, irrespective to the photoperiod, showed only a slight increase under 18°C by 300 °Cd, while the largest increase (6-7 fold) occurred at 11°C. VRN1 expression in the three phenotypic groups was compared at 300 °Cd, when its average level was the highest. Under LD, the difference between the PPDins and PPDsens increased with the lower temperature and became significant at 11°C, while under SD, PPDins had higher VRN1 level not only at 11°C but also at 25°C (Fig 5a). The VRN1 level of the PPDsens, VRN++ group was significantly the lowest at 25°C and 18°C, but at 11°C this group had the same gene expression level as the PPDsens group.
VRN3 was not yet expressed at the end of the vernalization treatment; its expression increased
with thermal time (Fig 4c). The increase in gene transcript however proved to be proportional to the chronological time elapsed till the same thermal time equivalents of the three temperatures, especially under LD (Suppl Fig 3c). At its maximum transcript level, the VRN3 expression of the PPDins group was significantly the highest at 18°C and 11°C under LD, while only at 11°C under SD (Fig 5c). The VRN3 level of the PPDsens, VRN++ group was significantly the lowest in all treatments.
Temperature had a very strong effect on the expression pattern of VRN2 (Fig 4b). The VRN2 transcript level was very low at the end of the vernalization treatment. VRN2 expression slightly increased after the transfer to 11°C; at higher temperatures, however VRN2 showed a significant increase to a peak level which was then followed by a decrease as development proceeded. At 18°C this peak was smaller and occurred at 100 °Cd (around 10 – 12 days in chronological time), which was followed by a gradual decline. At 25°C, the peak occurred at 200 °Cd (around 7 – 8 days in chronological time) and was significantly larger, followed by a sharper decline. The effect of the photoperiod increased with the higher temperature levels. At 11°C and 18°C there was no difference between the two photoperiods, while at 25°C, photoperiod had a very strong modifying effect. A temperature of 25°C together with LD resulted in the highest transient increase of the VRN2 expression. Under LD the transient expression peak was the highest in the case of the PPDsens, VRN++ group, irrespective to the temperature level, while the PPDins and PPDsens groups had similar activities (Fig 5b). This tendency was also characteristic of the SD 18°C and SD 11°C treatments. Under SD 25°C, however the PPDins cultivars had the highest transient expression of VRN2. The appearance of transient expression peaks at the higher temperature levels (18°C and 25°C) was also characteristic of the PPD1 gene (Fig 4d). The magnitudes of the transient peaks were similar, the differences were only apparent in the timing of the peak and in the significance of photoperiod as a modifying factor. At 18°C the transient expression occurred only under SD with a peak at 100-200 °Cd (10 - 12 days) followed by a gradual decline, while at 25°C the pattern of this transient expression was independent of the photoperiod, with a peak at 200 °Cd (5 – 6 days), followed by a sharper decline. PPD1 activity was lowest at 11°C and showed a gradual but continuous decrease in expression over both time courses. Under LD the PPD1 activity in the PPDins group was 2 – 4 times higher compared to the two PPDsens groups, irrespective to the ambient temperature (Fig 5d). Under SD this difference
between the insensitive and sensitive groups mostly diminished and only at 25°C was the activity of the insensitive group somewhat higher.
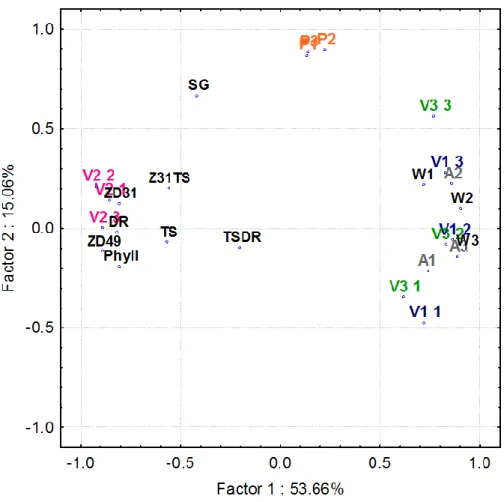
The associations between the gene expression levels, the apex and later plant developmental phases (as defined in the MM section) across the 11 wheat genotypes were also evaluated for all the six environments applying principal component analyses. Under the standard environment of LD 18°C, the first 5 factors had Eigenvalues higher than 1, and together they explained 91.6% of the variation. The VRN1, VRN3 gene expression appeared to be closely correlated with each other and also with the early developmental phases of the apex as characterised by the Waddington scale (WD) and the apex length (APL) (Fig 6); the higher expression levels were significantly associated with the more developed and longer apices. Opposing to this group was VRN2 expression together with both the early apex development (formation of double ridges (DR) and terminal spikelet (TS)) and the later plant developmental phases (interval between terminal spikelet and first node appearance (Z31TS), first node appearance (ZD31), and booting stage (ZD49), underlining the strong negative correlations between these two groups. The PPD1 activity was independent from all the other variables.
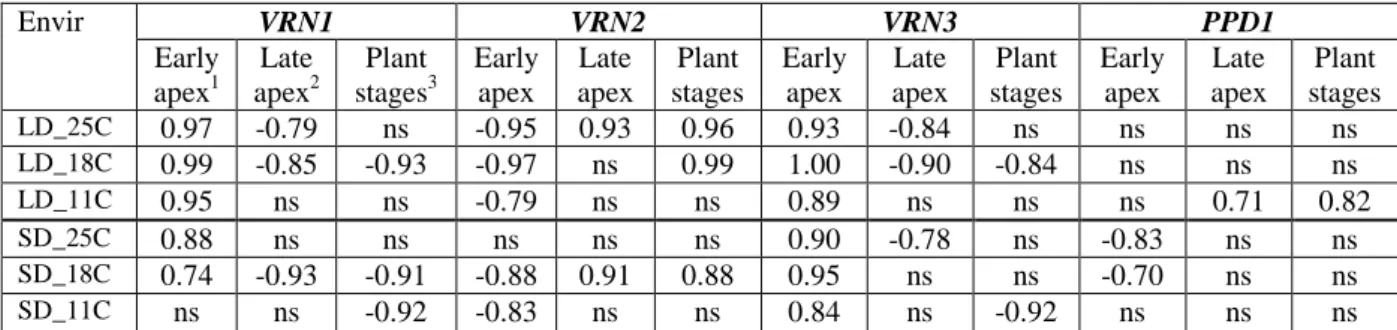
The changes in the association patterns between gene expressions and development were evaluated by correlating the significant background PCoA factors of the traits under the various environments (Suppl. table 3 and 4), the results of which are summarised in Table 3. Under LD, the VRN1, VRN2, and VRN3 expression levels strongly correlated with the early apex development, irrespective to the temperature. Higher VRN1 and VRN3 levels were paralleled with more developed apices, while in the case of VRN2 the correlation was opposite. The association of the expression levels with the later apex and plant developmental phases were temperature dependent for all the VRN genes. The correlation was similar for
18°C the correlation was significant at all stages, while at 25°C their expressions correlated with apex development until the later stages, but not with the plant development. In contrast the VRN2 expression significantly correlated with early apex, later apex and later plant development both at 18°C and 25°C. The PPD1 gene expression showed significant association with apex and plant development only at 11°C, and this was strongest with the later plant developmental phases.
Under SD, the associations between gene expressions and developmental phases were less pronounced and more variable across the temperatures. The early apex development correlated with the VRN3 expression to the greatest extent at all three temperature levels, followed by the negative association with VRN2. Though the correlation between VRN1 expression and apex development was weak or not significant, the activity level of this gene strongly correlated with the later plant developmental phases at 18°C and 11°C.
Discussion
Temperature and photoperiod are two of the most tractable environmental stimuli which influence the rate and development of plants. Here we have presented a series of factorial experiments which start to dissect the combined roles of temperature and photoperiod. In particular we further investigate the previous observations which show that the effects of temperature signalling are concentrated on certain developmental phases (Slafer & Rawson 1996; Borras-Gelonch et al. 2012; Karsai et al. 2013).
Based on the response patterns to ambient temperature the wheat cultivars presented formed three distinct categories: fully vernalized (or with spring habit) photoperiod insensitive, fully vernalized photoperiod sensitive, and partially vernalized photoperiod sensitive genotypes, which are similar to categories observed in barley (Karsai et al. 2013). This classification
highlights that photoperiod sensitivity and vernalization requirement largely determines the temperature response. Our results indicate that in temperate cereals ambient temperature as an environmental cue acts on plant development under inductive photoperiods for that genotype, reinforcing its effect on the sensitive genotypes during and after vernalization. This is of particular significance when considering the effects of warm periods during winter or early spring which would allow periods of active growth.
Our results identify that temperature most significantly influenced the process of intensive stem elongation. This was most apparent in the photoperiod sensitive genotypes, particularly under the 12 hour photoperiod. As in barley, where the beginning of intensive stem elongation was found to be determined by higher temperatures (Borras-Gelonch et al. 2012; Karsai et al. 2013) we found compartmentalization in how temperature acted on wheat stem elongation. A warmer temperature delayed the start of stem elongation irrespective of vernalization whilst lower temperatures only influenced genotypes with partially saturated vernalization requirement, which often caused the premature abortion of stem elongation around the booting stage.
To start to understand the molecular basis of how temperature and photoperiod interact we measured the expression of the major vernalization response (VRN1, VRN2, and VRN3) and photoperiod sensitivity (PPD1) genes. Our findings identify that temperature exerted significant effects on the expression of most of these genes in a gene-specific manner, which was modulated by photoperiod to a small extent. VRN3 was the exception, which under long photoperiod showed its expression to be chronologically regulated and not influenced by temperature, which is in complete agreement with results in barley (Hemming et al. 2012). Ambient temperature had the strongest and opposing effect on the expression of VRN1 and
VRN2. Higher temperatures down regulated the expression of VRN1 while the expression of VRN2 increased, although this increase in expression was transient. This trend of increased
VRN2 expression under warmer temperatures was clearest in the partially vernalized
genotypes but remained true, with a lower amplitude, in the fully vernalized genotypes. Our results suggest that VRN2 has an important role in determining plant development even after vernalization, which further expands its role from that proposed by Yan et al. (2004) and Fjellheim et al. (2014). The expression of PPD1 also showed a transient increase under both long day and short day photoperiods, the pattern of which varied depending on temperature. The mechanism of this regulation may relate to its sequence and possible functional similarity to its A. thaliana ortholog AtPRR7 which is part of the circadian clock network and involved in temperature sensing (Farre et al. 2005). Evidence shows that the cereal PPD1 is under circadian regulation as well as participating in a photoperiod regulating pathway which has evolved specifically in the grasses (Campoli et al. 2012).
The results also show that the expression levels of VRN1 and VRN2 strongly correlated with the apex development and later plant development phases. Notably the association between
VRN1 gene expression and the different developmental stages, especially the later ones, was
only significant under fully inductive conditions. This indicates that partially different regulation mechanisms exist for the generative apex development and the later plant developmental phases. Particularly interesting is the observation that there is a photoperiod dependent reverse turn in the correlation between VRN2 and later plant developmental phases. Under long photoperiod with increased temperature higher VRN2 expression was associated with delayed development however under the short photoperiod the transient high
VRN2 expression peak was most pronounced in the photoperiod insensitive genotypes, which
showed normal initiation and procession of stem elongation.
One of the significant differences between the genetic control of A. thaliana and temperate cereals is that in A. thaliana the vegetative – generative transition and the generative apex development take place synchronously with the process of bolting, thus the factors
determining bolting practices inseparable effects on flower development (Holt et al. 2014). In cereals, however these two processes are partially separated from each other; the generative development of the apex with the formation of terminal spikelet has already been accomplished by the time of the beginning of intensive stem elongation. Our results show that the regulation of vegetative to generative apex and the subsequent stem elongation respond to distinct environmental signals, with this partially independent regulation being more evident under non optimal conditions for a particular genotype. In barley, candidate genes from early maturing (eam) loci were identified to belong to the circadian clock and when mutated not only resulted in early heading but also in faster plant and stem growth rates (Faure et al. 2012; Campoli et al. 2013; Boden et al. 2014). These, combined with our own findings suggest that intensive stem elongation phase could be under the control of the circadian clock, possibly in a more direct way than the apex to generative phase which are controlled by the gene cascades of vernalization and photoperiod (Dubcovsky et al. 2006; Fjellheim et al. 2014). If so, then the environmental factors such as ambient temperature and light quality which influence the entrainment of the clock should also strongly influence stem elongation. Here we demonstrate that ambient temperature exerts such an important impact on stem elongation in wheat. This intricate regulating system which integrates temperature signals in the later developmental phases builds on the primary control mechanisms of vernalization and photoperiod, and leads to the environmentally driven plasticity of plant development, as such it is an important element in ecological adaptation in cereals.
Acknowledgement
This research was funded by the ADAPTAWHEAT EU-FP7 and EU_BONUS_12-1-2012- 0024 research grants. The authors declare no conflict of interest.
Author’s contributions
I.K. and S.G. designed the research, T.K, A.S, J.B., M.M. and K.B. performed the experiment, T.K, A.S., L.D. and K.B. processed the data, I.K, T.K, V.A. S.G, G.S. O.V., and G.G. analysed and interpreted the data, T.K, L.D. and I.K wrote the manuscript, S.G, L.D., V.A., G.S., G.G, and O.V. edited the manuscript and all authors approved the final version.
References
Appendino M.L. & Slafer G.A. (2003) Earliness per se and its dependence upon temperature in diploid wheat lines differing in the major gene Eps-Am1 alleles. The Journal of Agricultural Science 141, 149-154.
Atkinson D. & Porter, J.R. (1996) Temperature, plant development and crop yields. Trends in
Plant Science 1, 119- 124.
Bahuguna R.N. & Jagadish K.S.V. (2014) Temperature regulation of plant phenological development. Environmental and Experimental Botany 11, 83-90.
Beales J., Turner A., Griffiths S., Snape J.W. & Laurie D.A. (2007) A Pseudo-Response Regulator is misexpressed in the photoperiod insensitive Ppd-D1a mutant of wheat (Triticum aestivum L.). Theoretical and Applied Genetics 115, 721-733.
Borras-Gelonch G., Slafer, G.A., Casas A.M., van Eeuwijk F. & Romagosa I (2010) Genetic control of pre-heading phases and other traits related to development in a double-haploid barley (Hordeum vulgare L.) population. Field Crops Research 119, 36–47. Borras-Gelonch G., Denti M., Thomas W.T.B. & Romagosa I. (2012) Genetic control of
pre-heading phases in the Steptoe x Morex barley population under different conditions of photoperiod and temperature. Euphytica 183, 303–321.
Boden S.A., Weiss D., Ross J.J., Davies N.W., Trevaskis B., Chandler P.M. Swain, S.M. (2014) EARLY FLOWERING3 Regulates Flowering in Spring Barley by Mediating
Gibberellin Production and FLOWERING LOCUS T Expression. The Plant Cell 26, 1557-1569.
Bullrich L., Appendino M.L., Tranquilli G., Lewis S. & Dubcovsky J. (2002) Mapping of a thermo-sensitive earliness per se gene on Triticum monococcum chromosome 1Am.
Theoretical and Applied Genetics 105, 585-593.
Campoli C., Shtaya M., Davis S.J. & von Korff M. (2012). Expression conservation within the circadian clock of a monocot: natural variation at barley Ppd-H1 affects circadian expression of flowering time genes, but not clock orthologs. BMC Plant Biology 12, 97. Campoli C., Pankin A., Drosse B., Casao C.M., Davis S.J., & von Korff M. (2013). HvLUX1
is a candidate gene underlying the early maturity 10 locus in barley: phylogeny, diversity, and interactions with the circadian clock and photoperiodic pathways. New
Phytologist 199, 1045–1059.
Campoli C, & von Korff M (2014) Genetic Control of Reproductive Development in Temperate Cereals. In Advances in Botanical Research: Vol. 72. The molecular
genetics of floral transition and flower development (eds J.P. Jacquot, P. Gadal & F.
Fornara), pp. 131–158. Academic Press, Elsevier Ltd. ISBN: 9780124171626
Capovilla, G, Schmid, M, Posé, D (2015) Control of flowering by ambient temperature.
Journal of Experimental Botany 66, 59–69.
Cockram J., Horsnell R., Soh E., Norris C. & O’Sullivan D.M. (2015) Molecular and phenotypic characterization of the alternative seasonal growth habit and flowering time in barley (Hordeum vulgare ssp. vulgare L.). Molecular Breeding 35, 165-175.
Deng W., Casao M.C., Wang P., Sato K., Hayes P.M., Finnegan E.J. & Trevaskis B. (2015) Direct links between the vernalization response and other key traits of cereal crops.
Díaz A., Zikhali M., Turner A.S., Isaac P., Laurie D.A. (2012) Copy Number Variation Affecting the Photoperiod-B1 and Vernalization-A1 Genes Is Associated with Altered Flowering Time in Wheat (Triticum aestivum). PLoS One 7, e33234.
Distelfeld A., Li C. & Dubcovsky J. (2009) Regulation of flowering in temperate cereals.
Current Opinion in Plant Biology 12, 178-184.
Dubcovsky J., Loukoianov A., Fu D., Valarik M., Sanchez A. & Yan L. (2006) Effect of photoperiod on the regulation of wheat vernalization genes VRN1 and VRN2. Plant
Molecular Biology 60, 469–480.
Farré E.M., Harmer S.L., Harmon F.G., Yanovsky M.J & Kay S.E. (2005) Overlapping and distinct roles of PRR7 and PRR9 in the Arabidopsis circadian clock. Current Biology 15, 47–54.
Faure S., Higgins J., Turner A. & Laurie D.A. (2007) The FLOWERING LOCUS T-like gene family in barley (Hordeum vulgare). Genetics 176, 599-609.
Faure S., Turner A.S., Gruszka D., Christodoulou V., Davis S.J., von Korff M. & Laurie, D.A. (2012) Mutation at the circadian clock gene EARLY MATURITY 8 adapts domesticated barley (Hordeum vulgare) to short growing seasons. Proceedings of the
National Academy of Sciences of the United States of America 109, 8328–8333.
Fjellheim S., Boden S. & Trevaskis B. (2014) The role of seasonal flowering responses in adaptation of grasses to temperate climates. Frontiers in Plant Science 5, 431.
Fu D., Szűcs P., Yan L., Helguera M., Skinner J.S., von Zitzewitz J., Hayes P.M. & Dubcovsky J. (2005) Large deletions within the first intron in VRN-1 are associated with spring growth habit in barley and wheat. Molecular Genetics and Genomics, 273, 54-65.
Hemming M.N., Walford S.A., Fieg S., Dennis E.S. & Trevaskis B. (2012) Identification of high temperature responsive genes in cereals. Plant Physiology 158, 1439–1450.
Holt A.L., van Haperen J.M.A., Groot E.P. & Laux T. (2014) Signaling in shoot and flower meristems of Arabidopsis thaliana. Current Opinion in Plant Biology 17, 96–102. Karsai I., Szűcs P., Mészáros K., Filichkina T., Hayes P.M., Skinner J.S., Lang L. & Bedő Z.
(2005) The Vrn-H2 locus is a major determinant of flowering time in a facultative x winter growth habit barley (Hordeum vulgare L.) mapping population. Theoretical and
Applied Genetics 110, 1458-1466.
Karsai I., Igartua E., Casas A.M., Kiss T., Soós V., Balla K., Bedő Z. & Veisz O. (2013) Developmental patterns of a large set of barley (Hordeum vulgare) cultivars in response to ambient temperature. Annals of Applied Biology 162, 309–323.
Kiss T., Balla K., Veisz O. & Karsai I. (2011) Elaboration of a non-destructive methodology for establishing plant developmental patterns in cereals. Acta Agronomica Hungarica 59, 293-301.
Kiss T., Balla K., Veisz O., Láng L., Bedő Z., Griffiths S., Isaac P. & Karsai I. (2014) Allele frequencies in the VRN-A1, VRN-B1 and VRN-D1 vernalization response and PPD-B1 and PPD-D1 photoperiod sensitivity genes, and their effects on heading in a diverse set of wheat cultivars (Triticum aestivum L.). Molecular Breeding 34, 297–310.
Lempe J., Balasubramanian S., Sureshkumar S., Singh A., Schmid M. & Weigel D. (2005) Diversity of flowering responses in wild Arabidopsis thaliana strains. PLoS Genetics 1, e6.
Milec Z., Sumikova T., Tomkova L., Pankova K. (2013) Distribution of different Vrn-B1 alleles in hexaploid spring wheat germplasm. Euphytica 192, 371-378.
Nishida H., Yoshida T., Kawakami K., Fujita M., Long B., Akashi Y., Laurie D.A., Kato K. (2013) Structural variation in the 5’ upstream region of photoperiod-insensitive alleles
Ppd-A1a and Ppd-B1a identified in hexaploid wheat (Triticum aestivum L.), and their
Porter J.R. & Gawith M. (1999) Temperatures and the growth and development of wheat: a review. European Journal of Agronomy 10, 23–36.
Rawson H.M. & Richards R.A. (1993) Effects of high temperature and photoperiod on floral development in wheat isolines differing in vernalization and photoperiod genes. Field
Crops Research 32, 181–192.
Slafer G.A. & Rawson H.M. (1995) Base and optimum temperatures vary with genotype and stage of development in wheat. Plant Cell and Environment 18, 671-679.
Slafer G.A. & Rawson H.M. (1996) Responses to photoperiod change with phenophase and temperature during wheat development. Field Crops Research 46, 1-13.
Slafer G.A., Kantolic A.G., Appendino M.L., Tranquilli G., Miralles D.J., & Savin R. (2015) Genetic and environmental effects on crop development determining adaptation and yield. In Crop Physiology: Applications for Genetic Improvement and Agronomy (eds V.O. Sadras & D.F. Calderini), pp. 285-319. Elsevier Inc, Amsterdam.
Trevaskis B., Bagnall D.J., Ellis M.H., Peacock W.J. & Dennis E.S. (2003) MADS box genes control vernalization-induced flowering in cereals. Proceedings of the National
Academy of Sciences of the United Nations of America 100, 13099-13104.
Trevaskis B., Hemming M.N., Dennis E.S. & Peacock W.J. (2007) The molecular basis of vernalization-induced flowering in cereals. Trends in Plant Science 12, 352-357.
Turner A., Beales J., Faure S., Dunford R.P. & Laurie D.A. (2005) The pseudo-response regulator Ppd-H1 provides adaptation to photoperiod in barley. Science 310, 1031-1034.
Waddington S.R. & Cartwright P.M. (1983) A quantitative scale of spike initial and pistil development in barley and wheat. Annals of Botany 51, 119–130.
Wellmer F. & Riechmann J.L. (2010) Gene networks controlling the initiation of flower development. Trends in Genetics 26, 519-527.
Yan L., Loukoianov A., Tranquilli G., Helguera M., Fahima T. & Dubcovsky J (2003) Positional cloning of the wheat vernalization gene VRN1. Proceedings of the National
Academy of Sciences of the United Nations of America 100, 6263-6268.
Yan L., Loukoianov A., Blechl A., Tranquilli G., Ramakrishna W., SanMiguel P., Bennetzen J.L., Echenique V. & Dubcovsky J. (2004) The wheat VRN2 gene is a flowering repressor down-regulated by vernalization. Science 303, 1640-1644.
Zadoks J.C., Chang T.T. & Konzak C.F. (1974) A Decimal Code for the Growth Stages of Cereals. Weed Research 14, 415–421.
von Zitzewitz J., Szûcs P., Dubcovsky J., Yan L., Francia E., Pecchioni N., Casas A., Chen T.H.H., Hayes P.M. & Skinner J.S. (2005) Structural and functional characterization of barley vernalization genes. Plant Molecular Biology 59, 449-467.
Table 1 List of the wheat genotypes examined under the factorial combinations of two photoperiod and three temperature levels in controlled experiments
Abbr Name Origin Spring allele1 Insensitive allele2 Vern resp3 (days) Photoperiod sens4 (days) HD in field5 AT1 Mv Toborzó* H - PPD-D1 44 2 133 AT2 Mv Verbunkos H - - 50 23 146 AT3 Tommi D - - 66 44 146 AT4 Ellvis D - - 68 67 146
AT5 Plainsmann V USA - PPD-D1 49 -2 131
AT6 Mv Magma H VRN-B1 PPD-D1 44 1 144
AT7 Soissons F - PPD-D1 52 -4 138
AT8 Fleischman 481 H - - 30 29 139
AT9 Mv Hombár H - - 43 29 142
AT10 Ukrainka UKR - PPD-D1 51 0 137
AT11 Avalon GB - - 56 37 147
AT12 Cadenza GB VRN-A1 - 4 28 145
AT13 Spark GB - - 18 42 151
AT14 Rialto GB - - 18 51 149
AT15 Paragon GB VRN-A1,
VRN-B1 - 5 53 147
AT17 Weebil Mex VRN-D1 PPD-D1 9 5 141
AT18 Savannah GB - - 43 33 149
AT19 Buster GB - - 43 36 146
AT20 Charger GB - - 67 61 145
1 Presence of spring allele(s) in the vernalization response loci of VRN1 2 Presence of insensitive allele(s) in the photoperiod response loci of PPD1 3 Difference in heading date (ZD59) after 0 and 45 days vernalization
4 Difference in heading date (ZD59) at 12 and 16 hours photoperiods (after 45 days vernalization) 5 Days to heading from Jan 1 (ZD59) in autumn sown experiment, Martonvásár, 2014/15; LSD0.05 = 1.8 days
Table 2 Effects of genotype, photoperiod and temperature on the consecutive developmental phases evaluated in thermal times as characterised with their respective percentages of the total variance in wheat by using the MLM module of GenStat 18.0
Variance comp (2 (%)) df DR TS ZD31 ZD30 ZD37 ZD39 ZD49 ZD59 ZDSE Residuals 1 0.3 0.6 0.1 0.1 0.1 0.1 0.1 0.1 0.1 Genotype (G) 18 28.1* 32.3* 39.4* 21.1* 26.8* 25.9* 23.3* 24.1* 19.8* Photoperiod (P) 1 0.9 4.9 2.9 15.1 14.6 18.3 21.9 21.3 22.8 Temperature (T) 2 34.8* 26.0 26.1 29.6* 26.5 25.1 22.4 21.5 22.0 G x P 18 12.9* 9.0* 4.5 6.8* 7.6* 8.4* 10.0* 9.5* 8.3* G x T 36 12.1** 20.4*** 18.4** 15.0** 17.8** 16.5*** 12.9** 13.0** 13.9** P x T 2 1.3 0.0 0.2 1.9 0.0 0.0 1.1 1.7 1.7 G x P x T 36 10.4*** 6.8*** 8.3*** 10.3*** 6.6*** 5.6*** 8.3*** 8.9*** 11.4*** h2 0.696 0.722 0.801 0.686 0.690 0.695 0.686 0.695 0.649
DR: double ridge; TS: terminal spikelet; ZD31: first node appearance; ZD30: onset of the intensive stem elongation; ZD37: flag leaf appearance; ZD39: flag leaf fully expanded; ZD49: booting stage; ZD59: heading; ZDSE: end of the intensive stem elongation
Table 3 Associations between the gene expressions and the apex and plant developmental patterns under the six environments of two photoperiods × three temperatures evaluated on the data matrices of 11 wheat cultivars based on the r values between the significant background PCoA factors of the various traits.
(the largest r values over the three sampling times and over the different early and late developmental phases subtracted from Suppl Tables 3 and 4 are presented at each cell)
Envir VRN1 VRN2 VRN3 PPD1 Early apex1 Late apex2 Plant stages3 Early apex Late apex Plant stages Early apex Late apex Plant stages Early apex Late apex Plant stages LD_25C 0.97 -0.79 ns -0.95 0.93 0.96 0.93 -0.84 ns ns ns ns LD_18C 0.99 -0.85 -0.93 -0.97 ns 0.99 1.00 -0.90 -0.84 ns ns ns LD_11C 0.95 ns ns -0.79 ns ns 0.89 ns ns ns 0.71 0.82 SD_25C 0.88 ns ns ns ns ns 0.90 -0.78 ns -0.83 ns ns SD_18C 0.74 -0.93 -0.91 -0.88 0.91 0.88 0.95 ns ns -0.70 ns ns SD_11C ns ns -0.92 -0.83 ns ns 0.84 ns -0.92 ns ns ns 1
early apex development as measured by apex length and Waddington scale at the thermal times of 0, 100, 200, and 300 °Cd
2
Thermal times of two apex developmental phases of double ridge (DR) and terminal spikelet formation (TS) and the thermal time interval between them (TSDR)
3
thermal time between TS and first node appearance (ZD31TS), first node appearance (ZD31) and booting (ZD49)
Figure legends
Figure 1 Genetic and phenotypic diversities between the 19 wheat cultivars, based on (a) 4971 SNP markers and (b) 16 phenology traits measured at 6 various environments combining 2 photoperiod × 3 temperature regimes (Wheat genotypes with bold italics carry the PPD-D1 insensitive allele)
Figure 2 Thermal times collected till attaining the final plant height in the three phenotypic groups of 19 wheat cultivars at 6 various environments combining 2 photoperiod × 3 temperature regimes (Error bars are based on standard deviations among wheat genotypes belonging to a subgroup (n= 6 for PPD ins; n= 10 for PPD sens; n=3 for PPD sens, VRN++)
Figure 3 Proportions of the consecutive developmental phases until attaining the full plant height in the three phenotypic groups of 19 wheat cultivars at 6 various environments combining 2 photoperiod × 3 temperature regimes; (a) PPD insensitive (PPD ins), (b) PPD sensitive (PPD sens) and (c) PPD sensitive group with strong vernalization requirement (PPD sens, VRN++) (Length of developmental intervals: TS – terminal spikelet formation, Z31TS – between first node appearance and terminal spikelet, Z3031 – between the start of intensive stem elongation and first node appearance, Z3930 – between fully emerged flag leaf and the start of intensive stem elongation, ZSE39 – between fully emerged flag and the end of intensive stem elongation)
Figure 4 Dynamics of expression levels of VRN1 (a), VRN2 (b), VRN3 (c) and PPD1 (d) genes in association with the thermal times averaged over 11 wheat cultivars across the factorial combinations of 2 photoperiods and 3 temperature levels (Error bars are based on
Figure 5 Mean values of the three phenotypic groups of 11 wheat cultivars at the respective maximum activities of VRN1 (a), VRN2 (b), VRN3 (c), and PPD1 (d) genes (Error bars are
based on standard deviations among wheat genotypes belonging to a subgroup (n= 2 for PPD ins; n= 6 for PPD sens; n=3 for PPD sens, VRN++))
Figure 6 Principal component analysis (PCoA) carried out on the data matrix of gene expression levels and plant developmental parameters of 11 wheat cultivars under the environment of 16 hour photoperiod and 18°C temperature.
Abbreviations:
V1 – VRN1; V2 – VRN2; V3 – VRN3; P – PPD1; A – Apex length, W – Waddington stage; DR – double ridge; TS – terminal spikelet; TSDR – interval length between DR and TS; ZD31 – first node detectable; Z31TS – interval length between TS and ZD31; ZD49 – booting stage; SG – rate of stem growth, Phyll – phyllochron.