HAL Id: hal-01287492
https://hal.archives-ouvertes.fr/hal-01287492
Submitted on 14 Mar 2016HAL is a multi-disciplinary open access archive for the deposit and dissemination of sci-entific research documents, whether they are pub-lished or not. The documents may come from teaching and research institutions in France or abroad, or from public or private research centers.
L’archive ouverte pluridisciplinaire HAL, est destinée au dépôt et à la diffusion de documents scientifiques de niveau recherche, publiés ou non, émanant des établissements d’enseignement et de recherche français ou étrangers, des laboratoires publics ou privés.
Microscopic thermal characterization of C/C composites
J Jumel, F Lepoutre, Franck Enguehard, D Rochais, M Cataldi
To cite this version:
J Jumel, F Lepoutre, Franck Enguehard, D Rochais, M Cataldi. Microscopic thermal characterization of C/C composites. 4th International Conference on High Temperature Ceramic Matrix Composites (HT-CMC4)„ Oct 2001, Munich, Germany. �hal-01287492�
Microscopic thermal characterization of C/C composites
J. Jumel(1,2), F. Lepoutre(1), F. Enguehard(2), D. Rochais(2), M. Cataldi(3)(1) ONERA, Châtillon, France (2) CEA Le Ripault, Monts, France (3) SNECMA, Saint Médard en Jalles, France
1. Introduction
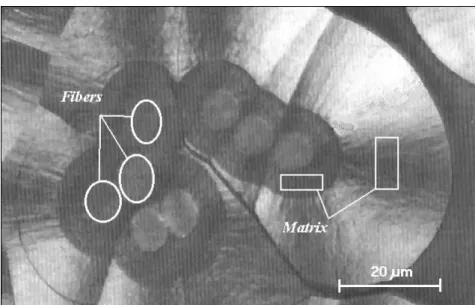
Figure 1. Micrograph of a C/C composite showing the locations and the dimensions of carbon fibers and matrix.
Both carbon fibers and matrix of C/C composites (figure 1) are made of graphite nano-elements, whose texture rules the local thermal properties, and consequently the macroscopic ones of the composite [1]. Thus, precise characterizations of fibers and matrix are required to improve these composites and to optimize their processes. It has been demonstrated that photoreflectance microscopy is able to provide the thermal properties measurement of complex materials such as graphite at a microscopic scale [2,3]. Nevertheless, additional efforts are necessary to remove the measurement artifacts, encountered when characterizing C/C composites local properties [4].
2 Microscopic thermal characterization by photoreflectance microscopy
Photothermal microscopy is based on the measurement and analysis of the periodic temperature increase induced by the absorption of an intensity modulated laser beam (pump beam). By detecting with a secondary laser beam (probe beam), the thermally induced reflection coefficient variations, we measure the temperature increase at the sample surface with a sensitivity better than 10-3
K.Hz-1/2
. This optical method has a micrometric spatial resolution, and furthermore, is non destructive and contactless.
2.1 Thermal waves propagation
When an isotropic, homogeneous medium is heated by a periodic point-like heat source, the periodic temperature increase, also called “thermal wave”, at a distance r from the pump location is described by the following equation:
( )
⎟⎟⎠ ⎞ ⎜⎜⎝ ⎛ +− = jr kr Q x T µ π δ exp 1 4 (1) where: f πα µ= (2)is called thermal diffusion length, f being the modulation frequency of the harmonic heat source, α=k/ρC the thermal diffusivity of the material, k its thermal conductivity, and ρC its volume specific heat. Thermal waves are damped, the higher the modulation frequency is, the sharper the periodic temperature decrease. At a few hundreds of kHz and for usual thermal diffusivity values (smaller than 1cm2/s), the thermal wave is confined in a few cubic micrometers volume. The argument of δT (i.e. its phase) slope along r is equal to
µ1
− , which permits to evaluate the thermal diffusivity of the media, using a simple linear regression. A focused laser beam, is generally used as pump beam. Its energy distribution, which limits the spatial resolution of the measurements [4], must be taken into account.
2.2 Photoreflectance measurements principle and experimental set-up
To detect the temperature variations with a microscopic spatial resolution, the most convenient technique is photoreflectance microscopy. It consists in measuring with a photocell the light flux of a continuous laser beam (probe beam) of intensity I0, after being
reflected by the sample surface in the periodically heated zone. If the reflection coefficient of the material, R, varies linearly with temperature,
]
)
(
1
1
[
)
(
0 0T
r
e
j tT
R
R
R
r
R
=
+
∂
∂
δ
ω (3) the periodic reflected probe beam intensity variations are then equal to:]
)
(
1
.[
.
)
(
0 0 0T
r
e
j tT
R
R
I
R
r
δ
ωφ
=
∂
∂
(4)These very small periodic intensity variations can be detected by a photocell providing the signal is filtered by a lock-in analyzer which strongly increases the signal to noise ratio. The signal being proportional to the local periodic temperature increase, the phase of the signal only depends on the material thermal diffusivity, while, on the contrary, the amplitude depends on the optical properties as well.
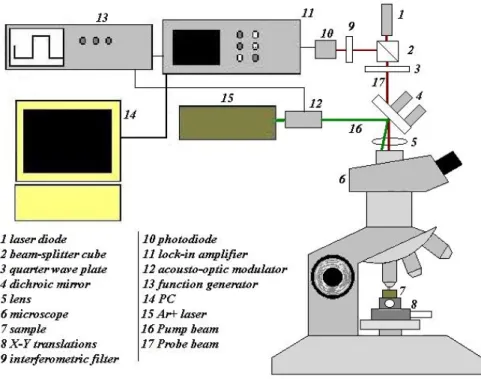
Figure 2. Description of the photothermal microscope.
The experimental set-up, described on figure (2), contains three main parts. An optical set-up to focus and to position the pump and probe beams, a device to measure the reflected probe beam flux, and several electronic devices to detect the signal and drive the experiment. The pump beam is an Ar+ laser whose maximum power is 600 mW. The intensity is modulated with an acousto-optic modulator operating up to 1 MHz. An a.c. waves generator delivers the driving signal. The pump beam is then orientated by a dichroïc mirror and finally focused onto the sample surface with a microscope. The probe beam is a laser diode that goes through a quarter wave plate, the dichroïc mirror and then is focused onto the sample surface with the same microscope. After reflection, it goes through the quarter wave plate again and is then deviated to the photodiode with a beam splitter cube. An optical filter prevents from any return of the pump beam toward the detector. A lock-in amplifier extracts the amplitude and phase of the periodic signal. A personal computer controls the dichroic mirror orientation and consequently the distance r between probe and pump beam positions.
3 C/C Composites microscopic thermal characterization
In this section, we wish to emphasize the influence of graphite local texture on the microscopic thermal properties of carbon fibres and matrix. At first, heat diffusion in the transverse section of different types of carbon fiber is visualized. In a second step, the three dimensional thermal diffusivity tensor of various morphologies of pyrocarbon matrix are precisely measured.
3.1 Heat diffusion in carbon fiber visualization.
As mentioned in section 2, the phase signal evolution around the heat source reveals the way heat diffuses in the media. Then, to point-out the role of fiber morphology in the heat transfer process at a microscopic scale, the heat diffusion in fiber cross section is visualized by
focusing the pump beam on the fiber and by measuring the periodic temperature increase around this point.
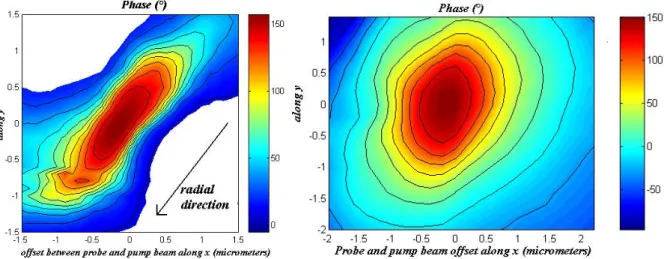
Figure 3. Visualization of heat diffusion in a carbon fiber cross section. On the left, pitch based fiber, on the
right, PAN based fiber, grayscales are in degrees.
Figure 4. On the left, pitch based fiber fractography revealing the strong radial morphology of this fiber (typical
diameter 10 µm), and, on the right, typical high modulus PAN based carbon fiber “transversely isotropic” microstructure.
Figure 3. shows typical results in the case of pitch based and PAN based fibers. When the heat source is slightly offset with respect to the pitch based fiber cross section center, the strong thermal anisotropy of heat diffusion immediately appears. The thermal wave essentially propagates along the radial direction, while it is strongly blocked along the circumferential one. These phenomenon are due to the strong radial texture of this fiber as revealed by the fractography presented in figure 4. The same measurement performed in a PAN based fiber confirm the expected transversely isotropic thermal behavior of these fibers due to their crumpled paper like microstructure.
3.2 Pyrocarbon matrix characterization.
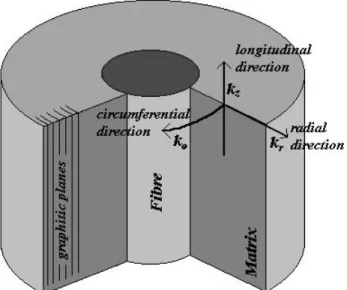
The pyrocarbon matrix is made of graphitic planes that surround the carbon fiber such as in a leek. Because of the strong thermal anisotropy of the graphite this makes the thermal properties of the matrix orthotropic in cylindrical coordinates. The curvature of the graphitic
planes has to be taken into account for precise determination of the matrix circumferential thermal diffusivity.
Figure 3. Experimental configuration for matrix characterization.
The periodic temperature increase, in the matrix, during the photoreflectance experiment is approximated by:
( )
⎟ ⎠ ⎞ ⎜ ⎝ ⎛ +− = jR R k R T r r ~ 1 exp ~ 4 1 ~ µ π δ (8) where(
)
2 0 2 2 2 cos ~ z k k k k rR R r R z r r + ⎟⎟⎠ ⎞ ⎜⎜⎝ ⎛ − − + = θ θ θ (9)kz, kr and kθ are respectively the thermal conductivities of the media in the longitudinal, radial
and circumferential direction. (R,θ0) being the polar coordinates of the heat source with
respect to the fibre referential. According to relations (8) and (9), when the graphitic curvature is small, the phase slope along the circumferential direction permits to determine the matrix circumferential thermal diffusivity, as explained in section 2.
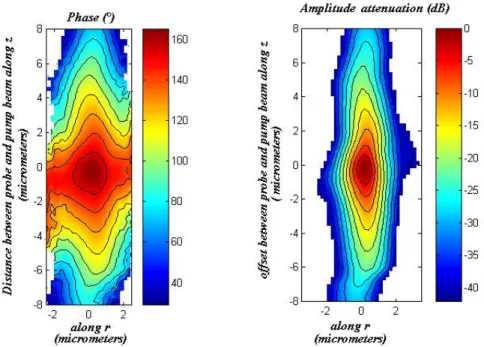
Figure 4. Photoreflectance measurement in a matrix longitudinal section (f = 1MHz), attenuation gray scale in
dB (right), Phase gray scale in degree (left).
Figure 5. Photoreflectance measurement in a matrix cross section (f = 1MHz).
Figures 6 and 7 show typical aspects of the periodic temperature increase field in matrix longitudinal and cross sections. From these experimental data, thermal diffusivities along the longitudinal, radial and circumferential directions are found to be equal respectively to: 8.1x10⁻⁵ m2/s, 3.0x10⁻⁶m2/s and 7.8x10⁻⁵ m2/s. Figure 7. illustrates the effect of graphitic planes curvature with heat diffusing circularly. Using this method, we studied six different samples of various morphologies determined by polarized light microscopy:
Sample A: dark laminar, no heat treatment, Sample B: smooth laminar, no heat treatment, Sample C: rough laminar, no heat treatment,
Sample D: Sample C, + medium temperature heat treatment, Sample E: Sample C, + high temperature heat treatment,
Sample F: Sample B, + medium temperature heat treatment.
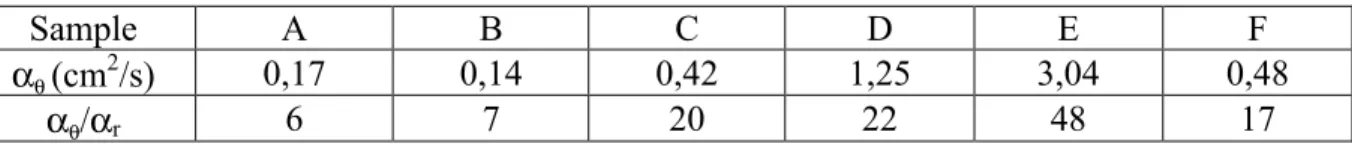
Sample A B C D E F
αθ (cm2/s) 0,17 0,14 0,42 1,25 3,04 0,48
αθ/αr 6 7 20 22 48 17
Table 1. Influence of processes on the matrix thermal properties.
The results given in table 1 demonstrate, at a microscopic scale, the correlation between graphitization and thermal ansitropy. Furthermore, it gives an experimental support to supply quantitative microscopic thermal properties. Correlated with TEM or polarized light microscopies, these results help material scientists to determine the optimal process parameters and permit physical interpretation of the macroscopic properties evolution of the composite.
4. Conclusion
Once having recalled the photoreflectance microscopy principle and performance, experimental results showing heat diffusion, at a microscopic scale, in PAN and pitch based carbon fibers were presented, in order to outline the role of fiber morphology during the microscopic heat transfer processes. Using a rigorous thermal parameters extraction scheme, different varieties of pyrocarbon matrix are then analyzed, in order to determine quantitatively their thermal diffusivity tensor. Finally, the results on different samples are analyzed in relation with their known morphologies as determined by polarized light microscopy.
Reference:
[1] A. Legendre, Le matériau carbone, Ed. Eyrolles, 1992.
[2] L., Pottier; Appl. Phys lett., 64, n°13, p. 1618-1619, 18 March 1994.
[3] B., Li; L., Pottier; J.P., Roger; D., Fournier; Thin Solid Film, n° 352, p. 91-96, 1999. [4] J., Jumel ; F., Lepoutre ; J.P., Roger ; D., Fournier ; M., Cataldi ; F., Ravel ; QNDE 2000, Iowa State Center, Iowa State University, jully16-21, 2000.