HAL Id: hal-01633462
https://hal.archives-ouvertes.fr/hal-01633462
Submitted on 23 Nov 2018HAL is a multi-disciplinary open access archive for the deposit and dissemination of sci-entific research documents, whether they are pub-lished or not. The documents may come from teaching and research institutions in France or abroad, or from public or private research centers.
L’archive ouverte pluridisciplinaire HAL, est destinée au dépôt et à la diffusion de documents scientifiques de niveau recherche, publiés ou non, émanant des établissements d’enseignement et de recherche français ou étrangers, des laboratoires publics ou privés.
Investigation of the Si-rich silicon oxide by 3D atom
probe tomography
Etienne Talbot, Rodrigue Lardé, Fabrice Gourbilleau, Christian Dufour,
Philippe Pareige
To cite this version:
Etienne Talbot, Rodrigue Lardé, Fabrice Gourbilleau, Christian Dufour, Philippe Pareige. Investiga-tion of the Si-rich silicon oxide by 3D atom probe tomography. 2008 MRS Fall Meeting, Dec 2008, Boston, United States. �10.1557/PROC-1111-D06-08-MM09-08�. �hal-01633462�
Investigation of the Si-rich silicon oxide by 3D atom probe tomography
Etienne Talbot1, Rodrigue Lardé1, Fabrice Gourbilleau2, C. Dufour2 and Philippe Pareige1
1
Groupe de Physique des Matériaux, Université et INSA de Rouen, UMR CNRS 6634, avenue de l’université, BP 12, 76801 Saint Etienne du Rouvray, France
2
Centre de Recherche sur les Ions, les Matériaux et la Photonique, équipe NIMPH, UMR CNRS 6252, ENSICAEN, 6 boulevard Maréchal Juin, 14050 Caen, France
ABSTRACT
Silicon rich silicon oxide multilayers for optical devices have been investigated by laser assisted wide angle atom probe tomography. Three dimensional mapping of silicon nanoclusters multilayers was obtained. The composition of the different phases were deduced and compared to theoretical concentration. These results evidenced a size distribution of the Si clusters diameter and an incomplete phase separation between silica and silicon particles.
INTRODUCTION
The miniaturization and the integration of photonic components, notably for the telecommunications, are one of the main stakes of this last decade. In particular, Si based systems presenting promising potential for realization of light sources [1, 2], waveguide
amplifiers [1, 3] and electroluminescence diodes compatible with the Si technology. One of the major lines deal with Silicon nanoclusters (Si-nc) embedded in silica which are promising for the realization of Si-based photonic devices. For example, Er doped silicon rich silica (SRSO) are promising candidate for planar optical amplifier at the wavelength of 1,54µm, which correspond to the minimum attenuation of silica optical fiber. In these systems, Si nanoclusters (Si-nc) have a sensitizer effect on Er3+ ions, and enhanced the effective cross section of rare earth dopants by means of an efficient energy transfer between Si-nc and Er ions. To improve the properties of these devices, it will be essential to characterize more precisely Si nanoparticles and especially size distribution and interface nature between Si-nc and matrix in samples annealed in the optimized conditions of the Er emission [4,5,6].
In this paper, we report for the first time 3D mapping of Si-nc embedded in SiO2 at the atomic
level. We focused our study on the local chemistry, size distribution, and Si-nc density in
SRSO/SiO2 multilayered structures annealed at 900°C during one hour. The results are compared
to the “theoretical” case of complete phase separation between Si and SiO2.
EXPERIMENT
SRSO/SiO2 multilayers (MLs) were prepared on Si substrates ([110] oriented) by an
alternative reactive magnetron sputtering of the silica target under a plasma of 50% H2 + 50% Ar Mater. Res. Soc. Symp. Proc. Vol. 1111 © 2009 Materials Research Society 1111-D06-08-MM09-08
to obtain SRSO sublayers, owing to the ability of hydrogen to reduce oxygen [7] and under a plasma of pure Ar to deposit the SiO2 sublayers. The MLs were grown at 650°C with a power
density of 1.3 W.cm-2 and were subsequently annealed at 900°C for 1h under a flux of N2 mixed
with 5% of H2 in order to favor the phase separation between Si and SiO2. The thickness of the
SiO2 and SRSO sublayers are 4nm and 3.8nm, respectively, and the size of the Si dots is limited
by the thickness of the SRSO layers. High Resolution Transmission Electron Microscopy was performed using a Topcon 002B on samples prepared in the cross-section configuration.
Three-dimensional laser assisted atom probe tomography (3D-APT) analysis provides a spatial chemical map at the atomic scale of a material with an ultrahigh spatial resolution (depth resolution ~0.1 nm) [8, 9]. The use of APT on semiconductor or insulator has always been limited due to the poor conductivity of these materials. Today, the recent development of the laser assisted APT allows to analyze these materials [10, 11]. During the analysis, a high positive DC voltage (several kilovolts) is applied on the sample in order to create a high electric field at the apex of the tip. The superposition of femtosecond laser pulses lead to the controlled
evaporation of the specimen. The evaporated ions are collected on a position-sensitive detector which is used to i) measure the time of flight of individual ions and ii) the impact position of each ion on the surface of the detector. These data permit the three dimensional reconstruction of the analyzed volume. One requirement is the sharp tip shaped sample with an end curvature radius smaller than 50nm and a small cone angle in order to create a very high electric field at the surface of the tip. The specimen is prepared using Focus Ion Beam (FIB) annular milling [12, 13]. SRSO/SiO2 samples were prepared using a focused Ga beam (30 kV). To prevent ion beam
damage and gallium implantation, samples were protected with a ~300nm Cr layer and the final steps of milling were performed at low acceleration voltage (2 kV). The results described in this paper were obtained by means of a Laser Assisted Wide Angle Tomographic Atom Probe (LAWATAP) from CAMECA. These experiments were performed at 80K in an ultrahigh vacuum chamber at a pressure of 10-8 Pa, and using femtosecond laser pulsing (50 nJ, 350 fs) at the wavelength of 343 nm.
DISCUSSION
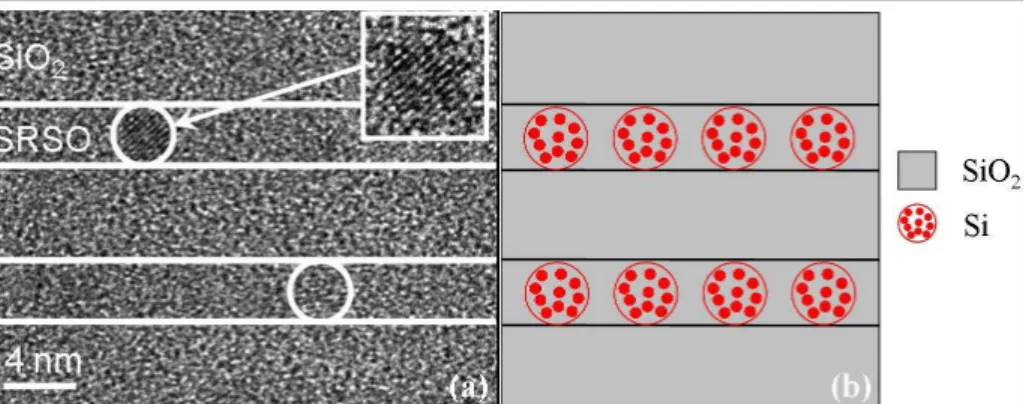
The cross-sectional HRTEM image of the SRSO/SiO2 multilayers is shown on Figure
1.(a). A careful observation of this micrograph allows to reveal the presence of crystallized Si nanoclusters. Si-nc are only localized in the SRSO sublayers. As expected by the multilayers structures, no clusters with a diameter greater than the thickness of the SRSO layers are detected. However, due to the poor contrast between silica matrix and Si-nc, small or amorphous
nanoclusters are not distinguishable with such a technique. Therefore, it is difficult to estimate the density and the size distribution of the Si-nc. The nominal composition, stacking of all MLs, was XSi=41% and XO=59%. This corresponds to an excess of silicon of ~11% for the MLs,
which is about ~25% in the SRSO sublayers. Under the hypothesis of complete phase separation between Si and SiO2 (SiOx xSiO x)Si
2 1 ( 2 2 − +
→ ), we can calculate the particles density in the
MLs. In this case, all Si-nc have a diameter of 3.8nm, a sharp interface with the matrix and the density of Si-nc is about ~ 5.1×10¹⁸ Si-nc/cm3. A schematic representation of this case is shown on Figure 1.(b).
Figure 1 : (a) High-Resolution TEM image of the SRSO (3.8nm) / SiO2 (4nm) multilayers.
Crystallized silicon nanoclusters can be seen (circle and magnified image); (b) Schematic drawing of the MLs configuration in the case of a complete phase separation between Si and SiO2 phases.
3D-APT results
We have performed Laser Assisted Atom Probe Tomography analyses on these SRSO/SiO2
MLs. A typical 3D reconstruction of the analysed volume is shown in Figure 2.(a). Alternating silica and silicon rich silica (indicate by arrows) regions are clearly distinguishable on this image. These results clearly evidence the alternating composition of the sample with layer of pure silica and layer of Si-nc in silica matrix. The associated concentration profile along the sample growth direction is presented in Figure 2.(b). The abscise axis corresponds to the ML’s growth direction. The overall measured composition is XSi ≈ 43.0 ± 0.3% and XO ≈ 57.0 ± 0.3%,
which correspond to a Si excess of ~14%, in good agreement with the nominal composition. The concentration in sublayers of pure silica is XSi ≈ 34.3 ± 0.3% and XO ≈ 65.7 ± 0.3%, and it is XSi
≈ 51.0 ± 0.3% and XO ≈ 49.0 ± 0.3% in the SRSO sublayers. The Si excess reached in the SRSO regions is about ~26% in good agreement with the nominal content.
Figure 2 : (a) 3D reconstruction of SRSO/SiO2 ML’s analysed by LA-WATAP (arrows and
dashed-line indicate rich Si regions). The volume is 13××××13××××51 nm3. (b) Composition profile
along the multilayer.
Figure 3.(a) shows a 3D iso-concentration surface image of the multilayers which reveals the presence of Si-nc (red-zones) embedded in silica regions (green-zones). This image clearly evidenced the expected uniform distribution of Si-nc in the SRSO sublayers alternatively with pure silica sublayers after a 1h-annealing at 900°C. Data treatment of the 3D-APT analyses allow us to investigate independently, at the atomic scale, each nano-cluster or the matrix (excluding Si-nc). First, the composition of the SRSO matrix (measured after subtraction of the Si-nc cluster), which corresponds to the decomposition of the surrounding Si-nc, has been obtained. The measured SRSO matrix composition is XSimatrix≈ 41.9 ± 0.3% and XOmatrix≈ 58.1 ± 0.3%,
which is significantly higher than pure silica phase (XSi=33.3% and XO=66.7%) and indicating
an incomplete phase separation. The Si excess remaining in the SRSO sublayers after 1h-annealing at 900°C is ~13%, i.e. only ~50% of the Si excess has precipitated. The 1h-annealing conditions (1h at 900°C) are not long enough to ensure a complete phase separation of the system. These results confirm the slow phase separation process at this temperature as suggested by Iacona et al. [14].
Figure 3 : (a) 3D iso-concentration of the SRSO/SiO2 ML’s (red zones indicate Si-nc and green
zones indicate silica). (b) Measured and theoretical size distribution of the Si-nc diameter in the SRSO layers.
Finally, the Si-nc size distribution in the SRSO/SiO2 multilayers was studied and compared to
the ideal case of a complete phase separation. An accurate size distribution of the silicon clusters in the SRSO layers is presented in figure 3.(b). The detections of small Si-nc embedded in silica matrix by APT highlight the capability of this technique compared to other ones (HRTEM, XRD, Raman spectroscopy, EFTEM …). On the figure 3.(b), the diameter ranges from 0.5 to 4.5 nm. The mean diameter was estimated to 2.9 nm. The silicon rich silicon oxide – silica multilayers was used to prevent Si diffusion in the silica during phase separation and the growth of clusters, and as a consequence limit the Si-nc size to the thickness of the SRSO sublayers. As expected, the presence of the SiO2 sublayers on each side of the SRSO one limits efficiently the diameter
of the Si-nc which has been found in majority to be less than 3.8 nm (i.e. less than the thickness of the SRSO layer). As evidenced by the size distribution (figure 3.b), there are small clusters in the ML’s. Their presence can be explained by the incomplete phase separation between Si and SiO2. The detection of Si particles with a diameter greater than silica sublayers thickness can be
partially explained by a poor interface quality between SiO2 and SRSO layers and uncertainties
on the layer thickness. The Si nanocluster number density is estimated to 5.7±1.0×10¹⁸ Si-nc/cm3. This result can be compared to the “theoretical” prediction of a complete phase
separation between Si and SiO2 phases considering that all nanoclusters have a diameter of 3.8
nm (figure 3.b). In this case, the Si-nc density would be about 5.1×10¹⁸ Si-nc/cm3. The measured density is in good agreement with the hypothesis of a complete phase separation, but our size distribution evidenced the fact that annealing time and/or annealing temperature are not so long to favour homogeneous Si-nc size density.
CONCLUSIONS
In summary, Si nanoclusters array in SRSO/SiO2 multilayered structures have been
investigated by an original approach by means of three-dimensional atom probe tomography. 3D-APT results show at the atomic scale the characteristic of the structure. In the annealing conditions investigated here, i.e. 900°C, our results show an incomplete phase separation between Si and SiO2. This is evidenced by a Si supersaturation in the SRSO layers and a large
scale distribution size of the Si-nc.
ACKNOWLEDGMENTS
This work was supported by the Upper Normandy Region and the French Ministry of Research in the framework of Research Networks of Upper-Normandy.
REFERENCES
1. L. Pavesi, L. Dal Negro, C. Mazzoleni, G. Franzo and F. Priolo, Nature, 408, 440 (2000). 2. L. Canham, Appl. Phys. Lett., 57, 1046 (1990).
3. L. T. Canham, Nature, 408, 411 (2000).
4. F. Gourbilleau, M. Levalois, C. Dufour, J. Vicens and R. Rizk, J. Appl. Phys., 95, 3717 (2004).
5. M. Wodjak, M. Klik, M. Forcales, O.B. Gusev, T. Gregorkiewicz, D. Pacifici, G. Franzo, F. Priolo and F. Iacona, Phys. Rev. B, 69, 233315 (2004).
6. G. Franzo, S. Boninelli, D. Pacifici, F. Priolo F. Iacona, and C. Bongiorno, Appl. Phys. Lett.,
82, 3871 (2003).
7. F. Gourbilleau, X. Portier, C. Ternon, P. Voivenel, R. Madelon and R. Rizk, Appl. Phys. Lett.,
78, 3058 (2001).
8. D. Blavette, A. Bostel, J. M. Sarrau, B. Deconihout and A. Menand, Nature, 363, 432 (1993). 9. M. K. Miller, Atom Probe Tomogrpahy: Analysis at the Atomic Level, Springer 2000.
10. G. Kellog and T. Tsong, J. Appl. Phys., 51, 1184 (1980).
11. B. Gault, F. Vurpillot, M. Gilbert, A. Vella, A. Menand, D. Blavette and B. Deconihout, Rev.
Sci. Instrum., 77, 043705 (2006).
12. G. B. Thomson, M. K. Miller and H. L. Fraser, Ultramicroscopy, 100, 25 (2004).
13. D. J. Larson, D. R. Foord, A. K. Perford-Long, H. Liew, M. G. Blamire, A. Cerezo, and G. D. W. Smith, Ultramicroscopy, 79, 287 (1999).
14. F. Iacona, C. Bongiorno, C. Spinella, S. Boninelli and F. Priolo, J. Appl. Phys., 95, 3723 (2004).