HAL Id: hal-02307972
https://hal.archives-ouvertes.fr/hal-02307972
Submitted on 13 Nov 2020
HAL is a multi-disciplinary open access
archive for the deposit and dissemination of
sci-entific research documents, whether they are
pub-lished or not. The documents may come from
teaching and research institutions in France or
abroad, or from public or private research centers.
L’archive ouverte pluridisciplinaire HAL, est
destinée au dépôt et à la diffusion de documents
scientifiques de niveau recherche, publiés ou non,
émanant des établissements d’enseignement et de
recherche français ou étrangers, des laboratoires
publics ou privés.
The XXL Survey
E. Koulouridis, M. Ricci, P. Giles, C. Adami, M. Ramos-Ceja, M. Pierre, M.
Plionis, C. Lidman, I. Georgantopoulos, L. Chiappetti, et al.
To cite this version:
E. Koulouridis, M. Ricci, P. Giles, C. Adami, M. Ramos-Ceja, et al.. The XXL Survey: XXXV. The
role of cluster mass in AGN activity. Astronomy and Astrophysics - A&A, EDP Sciences, 2018, 620,
pp.A20. �10.1051/0004-6361/201832974�. �hal-02307972�
Astronomy
&
Astrophysics
Special issue
A&A 620, A20 (2018) https://doi.org/10.1051/0004-6361/201832974 © ESO 2018The XXL Survey: second series
The XXL Survey
XXXV. The role of cluster mass in AGN activity
?
E. Koulouridis
1, M. Ricci
2, P. Giles
3, C. Adami
4, M. Ramos-Ceja
5, M. Pierre
1, M. Plionis
6,7, C. Lidman
8,
I. Georgantopoulos
9, L. Chiappetti
10, A. Elyiv
11,12, S. Ettori
13,14, L. Faccioli
1, S. Fotopoulou
15, F. Gastaldello
10,
F. Pacaud
5, S. Paltani
16, and C. Vignali
121 AIM, CEA, CNRS, Université Paris-Saclay, Université Paris Diderot, Sorbonne Paris Cité, 91191 Gif-sur-Yvette, France
e-mail: [email protected]
2 Laboratoire Lagrange, Université Côte d’Azur, Observatoire de la Côte d’Azur, CNRS, Bd de l’Observatoire, CS 34229, 06304 Nice
cedex 4, France
3 School of Physics, HH Wills Physics Laboratory, Tyndall Avenue, Bristol BS8 1TL, UK 4 Aix Marseille Univ., CNRS, CNES, LAM, Marseille, France
5 Argelander-Institut für Astronomie, University of Bonn, Auf dem Hügel 71, 53121 Bonn, Germany 6 National Observatory of Athens, Lofos Nymfon, 11810 Athens, Greece
7 Physics Department of Aristotle University of Thessaloniki, 54124 Thessaloniki, Greece 8 Australian Astronomical Observatory, North Ryde, NSW 2113, Australia
9 Institute for Astronomy & Astrophysics, Space Applications & Remote Sensing, National Observatory of Athens, 15236 Palaia
Penteli, Greece
10INAF - IASF - Milano, Via Bassini 15, 20133 Milano, Italy
11Main Astronomical Observatory, Academy of Sciences of Ukraine, 27 Akademika Zabolotnoho St., 03680 Kyiv, Ukraine 12Dipartimento di Fisica e Astronomia, Universitá di Bologna, via Gobetti 93/2, 40129 Bologna, Italy
13INAF - Osservatorio Astronomico di Bologna, via Pietro Gobetti 93/3, 40129 Bologna, Italy 14INFN, Sezione di Bologna, viale Berti Pichat 6/2, 40127 Bologna, Italy
15Center for Extragalactic Astronomy, Department of Physics, Durham University, South Road, Durham DH1 3LE, UK 16Department of Astronomy, University of Geneva, ch. d’Ecogia 16, 1290 Versoix, Switzerland
Received 6 March 2018 / Accepted 19 July 2018
ABSTRACT
Context. We present the results of a study of the active galactic nucleus (AGN) density in a homogeneous and well-studied sample of 167 bona fide X-ray galaxy clusters (0.1 < z < 0.5) from the XXL Survey, from the cluster core to the outskirts (up to 6r500). The
results can provide evidence of the physical mechanisms that drive AGN and galaxy evolution within clusters, testing the efficiency of ram pressure gas stripping and galaxy merging in dense environments.
Aims. The XXL cluster sample mostly comprises poor and moderately rich structures (M = 1013–4 × 10¹⁴
M ), a poorly studied population that bridges the gap between optically selected groups and massive X-ray selected clusters. Our aim is to statistically study the demographics of cluster AGNs as a function of cluster mass and host galaxy position.
Methods. To investigate the effect of the environment on AGN activity, we computed the fraction of spectroscopically confirmed X-ray AGNs (LX[0.5−10 keV]> 1042erg cm−1) in bright cluster galaxies with Mi∗− 2 < M < M
∗
i + 1, up to 6r500radius. The corresponding
field fraction was computed from 200 mock cluster catalogues with reshuffled positions within the XXL fields. To study the mass dependence and the evolution of the AGN population, we further divided the sample into low- and high-mass clusters (below and above 1014
M , respectively) and two redshift bins (0.1–0.28 and 0.28–0.5).
Results. We detect a significant excess of X-ray AGNs, at the 95% confidence level, in low-mass clusters between 0.5r500and 2r500,
which drops to the field value within the cluster cores (r < 0.5r500). In contrast, high-mass clusters present a decreasing AGN fraction
towards the cluster centres, in agreement with previous studies. The high AGN fraction in the outskirts is caused by low-luminosity AGNs, up to LX[0.5−10 keV]= 1043erg cm−1. It can be explained by a higher galaxy merging rate in low-mass clusters, where velocity
dispersions are not high enough to prevent galaxy interactions and merging. Ram pressure stripping is possible in the cores of all our clusters, but probably stronger in deeper gravitational potentials. Compared with previous studies of massive or high-redshift clusters, we conclude that the AGN fraction in cluster galaxies anti-correlates strongly with cluster mass. The AGN fraction also increases with redshift, but at the same rate with the respective fraction in field galaxies.
Key words. galaxies: active – galaxies: clusters: genera – X-rays: galaxies: clusters – galaxies: interactions – galaxies: evolution – large-scale structure of Universe
?Based on observations obtained with XMM-Newton, an ESA science mission with instruments and contributions directly funded by ESA Member
States and NASA.
A20, page 1 of10
Open Access article,published by EDP Sciences, under the terms of the Creative Commons Attribution License (http://creativecommons.org/licenses/by/4.0), which permits unrestricted use, distribution, and reproduction in any medium, provided the original work is properly cited.
1. Introduction
Since the discovery that all massive galaxies in the local Universe host a central super massive black hole (SMBH) with a mass proportional to that of the galaxy spheroid (known as the Magorrian relation,Magorrian et al. 1998;Gültekin et al. 2009; Zubovas & King 2012), the study of SMBHs and active galactic nuclei (AGNs) has been a lively topic in modern astrophysics. To explain this interactive co-evolution, theoretical models pro-posed an AGN-driven feedback wind as a mechanism to regulate the amount of gas in galaxies (Schawinski et al. 2006; Cen & Chisari 2011). Therefore, an accurate census of AGNs is essential in understanding the cosmic history of accretion onto SMBHs and their relation to the host galaxy.
However, there is still no consensus about the mechanisms that trigger or suppress AGNs. There is evidence that galaxy mergers and interactions play an important role in triggering AGNs (Koulouridis et al. 2006b;Hopkins et al. 2008), but on the other hand, AGNs are also found isolated and undisturbed. Nevertheless, there is compelling evidence that the presence of AGNs is closely linked to the large-scale environment. As struc-tures grow hierarchically, galaxies are accreted by progressively more massive dark matter halos, and the majority of galaxies end up in groups and clusters (Eke et al. 2004; Calvi et al. 2011), which are therefore the predominant environment of galaxies and can play a very important role in establishing galaxy proper-ties. As the most massive self-gravitating entities of the universe, clusters are also ideal laboratories for investigating the impact of dense environments on AGN demographics.
Clusters and groups are usually identified by optical and infrared surveys as concentrations of red-sequence galaxies (e.g. Gladders & Yee 2000; Koester et al. 2007; Hao et al. 2010; Rykoff et al. 2014; Bleem et al. 2015) or galaxy overdensi-ties in photometric redshift space (e.g. Wen et al. 2009,2012; Szabo et al. 2011). They are then confirmed by follow-up spec-troscopy. They can also be identified by X-ray observations as extended sources, unambiguously testifying the presence of hot gas trapped in the potential well of a virialised system (e.g. Pierre et al. 2004;Pacaud et al. 2007; Pierre et al. 2016, here-after XXL Paper I). In comparison to optically selected samples, X-ray selected cluster samples are much less affected by pro-jection effects, and their properties can be measured with good accuracy. In addition, the best way to detect active galaxies is through X-ray observations (e.g.Brandt & Alexander 2015).
However, the effect of the group and cluster environment on the activity of the central SMBH of galaxies and vice versa is still fairly undetermined. Although it has been clearly established that an excess of X-ray point-like sources is found within clus-ters (e.g. Cappi et al. 2001; Molnar et al. 2002;Johnson et al. 2003;D’Elia et al. 2004;Cappelluti et al. 2005;Gilmour et al. 2009), recent studies have reported a significant lack of AGNs in rich galaxy clusters with respect to the field (e.g.Koulouridis & Plionis 2010;Haines et al. 2012;Ehlert et al. 2013,2014). Nev-ertheless, spectroscopic studies of X-ray point-like sources in rich galaxy clusters have concluded that low X-ray luminosity AGNs (LX< 3 × 1042erg s−1) are equally present in cluster and
field environments (e.g.Martini et al. 2007;Haggard et al. 2010). In addition, most of the X-ray sources found in clusters present weaker optical AGN spectrum than AGNs in the field (Marziani et al. 2017) or show no signs of an optical AGN (e.g. Martini et al. 2002,2006;Davis et al. 2003). However, luminous AGNs are rarely found in clusters (Kauffmann et al. 2004;Popesso et al. 2006;Caglar & Hudaverdi 2017).
On the other hand, although AGNs are not found in cluster cores (e.g.Söchting et al. 2002;Ehlert et al. 2014;Melnyk et al. 2018, XXL Paper XXI), there is evidence that X-ray AGNs found in massive clusters are an in-falling population located mostly in the outskirts (Haines et al. 2012). Furthermore,Ehlert et al. (2015) argues that an important part of the cluster AGN popula-tion is triggered by galaxy mergers. Theoretically, the feeding of the black hole can be enhanced by means of non-axisymmetric perturbations that induce mass inflow during galaxy interactions and merging. This can lead to the AGN triggering (e.g.Kawakatu et al. 2006;Koulouridis et al. 2006b,a,2013;Ellison et al. 2011; Silverman et al. 2011;Hopkins & Quataert 2011;Villforth et al. 2012;Hopkins et al. 2014;Koulouridis 2014), rendering the high-density cluster surroundings a favourable AGN environment. While this maybe the case for the outskirts, the rather extreme conditions within the innermost cluster regions seem to have the opposite effect. In more detail, the ram pressure stripping from the intracluster medium (ICM) is probably able to strip or evaporate the cold gas reservoir of galaxies (Gunn & Gott 1972; Cowie & Songaila 1977; Giovanelli & Haynes 1985; Popesso et al. 2006;Chung et al. 2009;Jaffé et al. 2015;Poggianti et al. 2017b) and can strongly affect the fueling of the AGN. However, we note that the efficiency of ram pressure in transforming blue-sequence galaxies to red has been challenged (e.g.Larson et al. 1980;Balogh et al. 2000,2002;Bekki et al. 2002;van den Bosch et al. 2008;Wetzel et al. 2012) and halo gas stripping has been suggested instead (“strangulation”; e.g.Larson et al. 1980;Bekki et al. 2002;Tanaka et al. 2004). Nevertheless, recent spectro-scopic observations demonstrated the efficiency of ram pressure stripping in cluster galaxies (Poggianti et al. 2017b). Interest-ingly, in merging or actively growing clusters the high incidence of galaxy mergers can potentially enhance the number of AGNs, while at the same time, shock waves in the ICM generated by cluster mergers may also enhance the ram pressure stripping (e.g. Vijayaraghavan & Ricker 2013;Jaffé et al. 2016).
Whichever the exact physical mechanism, if the suppression of accretion onto the SMBH is due to the gravitational potential, we would expect the AGN presence to anti-correlate with cluster mass. However, the majority of previous studies have investi-gated rich X-ray clusters (e.g.Martini et al. 2006;Koulouridis & Plionis 2010; Haines et al. 2012) or optically selected galaxy groups (e.g.Bitsakis et al. 2015).Arnold et al.(2009) studied a sample of 16 local groups and rich clusters and found evidence of this anti-correlation.Oh et al.(2014) reported similar findings for a sample of 16 poor X-ray clusters at intermediate redshifts. InKoulouridis et al.(2014), we investigated the AGN frequency in 33 poor and moderately rich clusters of the XMM-LSS sur-vey up to z= 1 and found no AGN suppression near the cluster centres, as would be expected for more massive structures (e.g. Koulouridis & Plionis 2010;Ehlert et al. 2013,2014). In addition, Ehlert et al.(2015) argued that the number of AGNs in a sample of 135 clusters scales with M−1.2. On the other hand, studying the fraction of luminous AGNs (LX> 1043erg s−1) in the DES
clus-ter sample,Bufanda et al.(2017) reported no differences between groups and clusters at any redshift. We note, however, that the differences in the sample mass range of the above studies may account for the discrepant results. For example, there is no cluster in the sample ofEhlert et al.(2015) below the mass threshold of 1014M which has been used in the literature to separate groups from clusters (e.g.Bufanda et al. 2017).
In the current work, we study the X-ray AGN frequency in 167 spectroscopically confirmed X-ray selected clusters of the XXL survey (The Ultimate XMM-Newton Survey, see
E. Koulouridis et al.: The XXL Survey. XXXV.
XXL Paper I), spanning a redshift range of z = 0.1–0.5. This homogeneous collection of relatively low-mass X-ray clusters provides a far larger sample of such clusters than previous studies. This mass range is largely unexplored, but is neverthe-less an essential link between optical galaxy groups and massive clusters. With its depth, uniform coverage, and well-defined selection function, the XXL Survey is making a unique contri-bution to the study of clusters. More importantly, its two 25 deg2
fields are essential to the study of AGNs in the cluster envi-ronment, since clusters can be very extended, of the order of a few Mpc, and AGNs may preferentially reside in their outskirts.
In Sect.2of the paper, we present the cluster and AGN cat-alogues. In Sect.3, we describe the applied methodology and in Sect.4, we present the results. Finally, we draw our conclusions and discuss the results in Sect.5. Throughout this paper, we use H0= 70 km s−1Mpc−1,Ωm= 0.3, and ΩΛ= 0.7.
2. Data description 2.1. The XXL Survey
The XXL Survey is the largest XMM-Newton project approved to date (>6 Ms), surveying two ∼25 deg2fields, called the
north-ern (XXL-N) and the southnorth-ern (XXL-S) fields, with a median exposure of 10.4 ks and a depth of ∼5 × 10⁻¹⁵erg s−1cm−2in the
(0.5–2 keV) soft X-ray band (completeness limit for point-like sources). The two fields have extensive multiwavelength cover-age from X-ray to radio. A general description of the survey and its goals was published in XXL Paper I. To date approximately 450 new galaxy clusters have been detected out to redshift z ∼ 2, and more than 20 000 AGNs out to z ∼ 4. The main goal of the project is to constrain the dark energy equation of state parame-ter, w, using clusters of galaxies. This survey will also be a lasting legacy for cluster scaling laws and studies of galaxy clusters, AGNs, and X-ray background (see alsoPierre et al. 2017). 2.2. Galaxy cluster sample
From the total cluster catalogue of the XXL survey, we select all spectroscopically confirmed class-1 (C1) and class-2 (C2) clusters spanning a redshift range of 0.1 < z < 0.5. The lower redshift limit discards a small number of nearby clusters because their angular diameter is very extended, even for the 25 deg2 of each XXL field. The upper redshift limit allows us to uni-formly detect AGN cluster members down to a lower soft-band (0.5–2 keV) X-ray luminosity of LX[0.5−2 keV]> 1042erg cm−1. In
addition, we limit our sample to these clusters with direct X-ray temperature and luminosity measurements (see next paragraph for more details). The above selection yields 121 C1 and 46 C2 X-ray selected galaxy clusters.
The C1 and C2 selection criteria are described in Pacaud et al. (2006) and the properties of the clusters are thoroughly studied and presented in (Adami et al. 2018, hereafter XXL Paper XX). The C1 selection guarantees a pure cluster sam-ple, while the C2 selection pertains to less massive clusters and is a priori contaminated by false detections (30–50% are point-like sources mistaken for clusters). Therefore, we selected only the spectroscopically confirmed clusters to avoid includ-ing false sources. The cluster mass and the r5001radius are well
defined for our clusters, which is crucial for the current study. In more detail, we were able to measure directly the X-ray tem-perature and luminosity performing a spectral analysis of the
1 Overdensity radius with respect to the critical density.
0
10
20
30
40
50
0.1
0.2
0.3
0.4
0.5
Nz
0
10
20
30
40
50
13.0 13.2 13.4 13.6 13.8 14.0 14.2 14.4 14.6 14.8
Nlog
10M/M
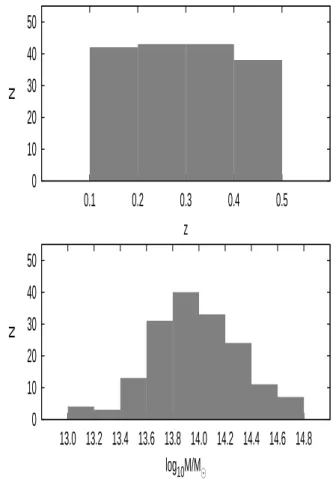
⊙Fig. 1.Redshift (top panel) and mass distribution (bottom panel) of the 167 spectroscopically confirmed C1 and C2 clusters in the two XXL fields.
X-ray observations. Initially, the extent of the emission was defined as the radius beyond which no significant cluster emis-sion is detected using a threshold of 0.5σ above the back-ground level. For detailed backback-ground modelling we followed the methodology described inEckert et al.(2014). The soft pro-ton background was modelled with a broken power law, and the non-X-ray background using closed filter observation. In addi-tion, the sky background was modelled using data extracted from an offset region (outside the cluster emission), using a three-component model. Finally, cluster source spectra were extracted for each of the XMM-Newton cameras separately and the (0.4–11.0 keV) band was modelled with an absorbed Astro-physical Plasma Emission Code (APEC; Smith et al. 2001) model (v2.0.2) with a fixed metal abundance of Z = 0.3 Z . Using the mass-temperature scaling relation ofLieu et al.(2016, XXL Paper IV), we calculated the (M500,MT) mass and the r500,MT
radius. The mass and redshift distribution of our sample are presented in Fig.1.
Although there is no clear definition, galaxy concentrations more massive than 1014M are defined as galaxy clusters, while less massive aggregations are called galaxy groups. According to the above classification almost half of the extended X-ray sources in the current study fall in the former category and the rest in the latter. Our sample includes very few clusters above a mass of M500,MT ∼ 3 × 10¹⁴M . Our sources cover an estimated mass
range of 1013−5 × 10¹⁴
M , which classifies them as poor clus-ters (groups) or moderately rich clusclus-ters. This is an important feature of our sample for the current study, allowing us to inves-tigate the role of the cluster mass in triggering and suppressing AGN activity.
2.3. X-ray point-source sample and spectroscopic redshifts The X-ray point source catalogue is thoroughly described in Chiappetti et al. (2018, XXL Paper XXVII), where all X-ray and the associated ancillary data (infrared, near-infrared, opti-cal, ultraviolet, radio, and spectroscopic redshift when available) of 26056 X-ray sources are described.
Spectroscopic redshifts were obtained with large spectro-scopic surveys with which we have collaborative agreements, for example SDSS, VIPERS (Guzzo et al. 2014), and GAMA (Liske et al. 2015) in XXL-N, and from a large campaign with the AAOmega spectrograph on the Anglo-Australian Telescope (seeLidman et al. 2016, XXL Paper XIV). Other smaller scale spectroscopic observations (e.g. with WHT, Koulouridis et al. 2016b, XXL Paper XII) complement the sample.
All spectroscopic information is hosted in the Centre de donnéeS Astrophysiques de Marseille (CeSAM) database in Marseille2. The second data release (CeSAM-DR2) is public and can be downloaded directly from the database.
3. Methodology
3.1. Spatial density of optical galaxies
Any excess of X-ray AGNs in the area of galaxy clusters can be due to the obvious abundance of galaxies with respect to the field (e.g.Koulouridis & Plionis 2010; Haines et al. 2012; Koulouridis et al. 2014). Therefore, to reach a meaningful inter-pretation of the X-ray AGN density we need to compare it to the density of optical sources. To this end we have used the clus-ters of XXL-N that fall in the CFHTLS-W1 field and therefore have reliable photometric redshifts (Ilbert et al. 2006;Coupon et al. 2009). The methodology used to select galaxies and define the background is described in detail inRicci et al.(2018, XXL Paper XXVIII). To summarise, we selected galaxies with pho-tometric redshifts in a certain window around the spectroscopic redshift of each cluster. This window was precisely defined in order to obtain a homogeneous 68% membership completeness that depends both on cluster redshift and galaxy magnitude. In order to select bright galaxies in a homogeneous way, we used an evolutionary model as reference for the redshift evolution of the characteristic apparent magnitude m∗. This model was
computed with LePhare using the elliptical galaxy SED tem-plate “burst_sc86_zo.sed” from the PEGASE2 library (Fioc & Rocca-Volmerange 1997), with a redshift of formation zf = 3.
We normalised the model using K* values from Lin et al. (2006), and corrected to AB system. This leads to a magnitude of M∗i = −21.75 at z = 0 in the i0 band, which does not sig-nificantly evolve within the redshift span of the current study. Finally, we selected galaxies (and counterparts of the X-ray sources) having an absolute magnitude Miin the i band within
Mi∗− 2 < Mi < M∗i + 1. The background galaxy density was
computed as the mean galaxy density in the entire CFHTLS-W1 field.
For the purposes of the current study, we calculated two opti-cal profiles, one for poor clusters with masses below M500,MT =
1014M and one above this threshold, since the mass-range of our clusters is rather narrow. The analysed sample, comprises ∼50% of the total cluster sample, and we assumed that it is repre-sentative of the full XXL population. For the rest of the clusters, one of the two available optical profiles was adopted on the basis of their estimated mass.
2 http://www.lam.fr/cesam/
Fig. 2. Position of the 75 spectroscopically confirmed X-ray selected clusters in the XXL-S field. The size of the circles in this figure corresponds to 6r500,MTradius.
3.2. X-ray AGN selection
In our analysis, we considered all X-ray point-like sources that (a) fall within 6r500,MT of the centre of each cluster (see
Fig.2), (b) have X-ray luminosities in excess of LX[0.5−10 keV] >
1042erg s−1, and (c) whose optical counterparts have absolute i-band magnitudes within M∗
i − 2 < Mi < M∗i + 1, consistently
with the range used for optical galaxies in Sect. 3.1. Of the above sources, ∼90% and ∼70% have a spectroscopic redshift in XXL-S and XXL-N, respectively. We divided the area around each cluster into six annuli of r500 radius, and we counted all the sources that fell into one of the following categories: spectroscopic members, for which the maximum radial velocity difference between the galaxy and the cluster is chosen at ∆u = ±2000(zspec+ 1) km s−1(e.g.Koulouridis & Plionis 2010;
Martini et al. 2013;Koulouridis et al. 2014,2016b) or photomet-ric members, which are galaxies with low probability of being stars or outliers, and with a narrow probability distribution func-tion (PDF) around the cluster redshift. The first annulus is further divided because the detection of X-ray sources close to the clus-ter core may be affected by the extended X-ray emission of the hot gas. Therefore, the number counts in the innermost region is always a lower limit. We also note that X-ray AGNs associated with the brighter cluster galaxies were removed, since their triggering and evolution is not the subject of the present study.
To compute the background level, we constructed 200 mock catalogues, 100 for each XXL field. We match the number and redshift distribution of our clusters, randomising only their posi-tion in the fields. The most important property of the mock catalogues is that they follow the X-ray sensitivity of the sur-vey allowing us to tackle selection effects. The average density of X-ray sources was found to be roughly the same in all annuli. In Fig.3, we present the X-ray AGN density profiles in the two fields using both selections. The profiles were constructed by computing the density of X-ray AGNs,∆X, in each annulus i, following the formula
∆Xi= Nc X 1 Ni XNc 1 Ai,
where Nc is the number of clusters, Ni the number of X-ray
AGNs in annulus i, and Aiis the respective area. The differences
E. Koulouridis et al.: The XXL Survey. XXXV. 0.00 0.05 0.10 0.15 0.20
∆
X (Mpc
-2)
M>1014M⊙ (spec AGN) M>1014M⊙ (spec+phot AGN) M<1014M⊙ (spec AGN) M<1014M⊙ (spec+phot AGN) 0.00 0.05 0.10 0.15 0.20 0 1 2 3 4 5 6∆
X (Mpc
-2)
r/r
500
M>1014M⊙ (spec AGN) M>1014M⊙ (spec+phot AGN) M<1014M⊙ (spec AGN) M<1014M⊙ (spec+phot AGN) M>1014M⊙ (spec AGN) M>1014M⊙ (spec+phot AGN) M<1014M⊙ (spec AGN) M<1014M⊙ (spec+phot AGN) 0 1 2 3 4 5 6r/r
500
M>1014M⊙ (spec AGN) M>1014M⊙ (spec+phot AGN) M<1014M⊙ (spec AGN) M<1014M⊙ (spec+phot AGN)Fig. 3.Density profiles of AGN cluster members, separated in two cluster mass bins (left and right panels). Only AGNs with spectroscopic redshifts are included in the top panels, while photometric redshifts are also used in the bottom panels. The dashed line represents the AGN field density as calculated from 100 mock catalogues in each case. Open circles mark the results of the first bin split into two. Error bars indicate the 1σ confidence limits for small numbers of events (Gehrels 1986).
between using all AGNs or only the spectroscopically confirmed ones are not significant. Considering that the spectroscopic com-pleteness of our sample is high (especially in XXL-S), while on the other hand AGN photometric redshifts have large uncer-tainties, we chose to proceed using only the spectroscopically confirmed members.
For the presentation of the results, we computed the AGN fraction in cluster member galaxies, or the ratio of cluster AGN fraction to the field AGN fraction. Our results are compared with similar studies of the AGN fraction in bright cluster galaxies selected in various bands. The majority of these studies use an M∗+ 1 magnitude cut below the knee of the luminosity function, consistent with that used in the current study. For the analy-ses that use M∗+ 1.5, Martini et al. (2013) argued that any possible discrepancy caused by the 0.5 magnitude difference is far smaller than the Poisson uncertainties. Errors were com-puted based on the confidence limits for small number of events (Gehrels 1986).
4. Results
In Fig.4, we present the results of our analysis, where we plot the fraction of X-ray AGNs in cluster galaxies to the fraction of X-ray AGNs in field galaxies up to 6r500 radii. We divided the
cluster population into low- and high-mass structures using the M500,MT= 1014M threshold. This limit is frequently used in the
literature to separate groups from massive clusters (e.g.Bufanda et al. 2017). The two subsamples roughly contain equal numbers of cluster galaxies. To obtain statistically significant results we merge the two XXL fields.
The first important result is the difference between the low-and high-mass cluster samples. A significant excess of X-ray AGNs, at the 95% confidence level, is found in the first 2r500,MT
range of the low-mass cluster population. In contrast, the AGN fraction in the high-mass sample is consistent with the field value, and there is also evidence of a decreasing trend towards the cluster centres. The results of the innermost 0.5r500,MT
annu-lus are plotted separately since they may be affected by obser-vational effects (see Sect.3.2). The number of AGNs detected in cluster cores is small and the statistics are poor, but we find a decreasing trend, especially for the low-mass sample in which the AGN fraction falls to the field level.
We also compare our results with those of massive clus-ter studies. In Fig. 4, we overplot the results of 16 massive Abell clusters presented inKoulouridis & Plionis(2010). Spec-troscopic redshifts were not available and therefore the projected X-ray AGN densities were computed, statistically subtracting the background. Data were available within a constant radius of 1 Mpc for most of the sources, which is close to the r500radius for
rich clusters. Optical galaxy densities were computed in the same regions, respectively, within m∗r − 0.5 < mr< m∗r+ 0.5 (SDSS).
We also plot the results of a spectroscopic study of 26 massive clusters that reported 40% fewer X-ray AGNs in galaxies brighter than M∗
K+ 1.5 within 2r500(Haines et al. 2012) when compared
to the field density (Haggard et al. 2010). They also found that these AGNs comprise an in-falling population. Martini et al. (2007) found a similarly low AGN fraction in MR < −20
galax-ies for a smaller sample of seven clusters. The cluster-centric radius probed by the Chandra field of view varied from r200
down to ∼0.5 Mpc. In sharp contrast to Haines et al. (2012),
0.5 1 1.5 2 2.5 0 1 2 3 4 5 6
cluster AGN fraction/field AGN fraction
r/r
500 Lx>1042 erg s-1 M>1014 M⊙ M<1014 M⊙ Haines+12 KP+10 Martini+07Fig. 4.Fraction of XXL bright cluster galaxies hosting an X-ray AGN (LX[0.5−10 keV] > 1042erg s−1), divided by the field fraction. The results
are plotted as a function of distance from the cluster centre. The sam-ple is divided in two based on cluster mass. Error bars indicate the 1σ confidence limits for small numbers of events (Gehrels 1986). For comparison we plot results from the analyses of massive clusters by Martini et al.(2007, 8 clusters, 0.06 < z < 0.31),Koulouridis & Plionis (2010, 16 clusters, 0.07 < z < 0.28), andHaines et al.(2012, 26 clusters, 0.15 < z < 0.30). A significant AGN excess is found between 0.5r500,MT
and 2r500,MT, at the 95% confidence level.
they argue that their AGN sample is not in-falling. Interest-ingly, their X-ray sources are systematically less luminous than the sample inHaines et al.(2012), although both studies probe roughly the same galaxy population, up to ∼M∗+ 1.5. In
addi-tion,Martini et al.(2007) reported that the most luminous AGNs (LX> 1042erg s−1) are more centrally concentrated. This excess
is significant and peaks at ∼0.5 Mpc. These results are consistent with our findings for the high-mass cluster population, but again is in contrast to the results of the low-mass sample.
Furthermore,Ehlert et al.(2014) used a sample of 42 massive clusters (z < 0.7) to study the X-ray AGN fraction in galaxies with SuprimeCam R-band apparent magnitudes brighter than R = 23. Their least massive cluster (∼6 × 10¹⁴M ) is more
massive than our most massive cluster. However, they used a lower flux limit of 10−14erg s−1cm−2, selecting only the bright-est X-ray sources. We also note that spectroscopic redshifts were not available. For a meaningful comparison, we apply the same flux limit to our samples and we plot the results in Fig. 5. Similarly to Fig. 4, an AGN deficiency is found in both high-mass samples, while the excess is only present in the low-high-mass sample.
To test the stability of our results, we repeated the analysis used in this paper using an alternative cluster mass estimation. In more detail, we performed aperture photometry within 300 kpc in the (0.5–2 keV) band from the cluster centre. Then, we fol-lowed an iterative procedure using the M-L and the L-T scaling relations, fully described in XXL Paper XX, and we obtain the respective M500,scaland r500,scalvalues. This method allows the
use of the full XXL sample of 209 spectroscopically confirmed clusters between z= 0.1 and 0.5. Qualitatively, the results of the present study are not affected and the conclusions remain the same. We note, however, that this method is less precise than the one using direct temperature measurements that we have used in the current study.
0.5 1 1.5 2
0 1 2 3 4 5 6
cluster AGN fraction/field AGN fraction
r/r
500Fx>10-14 erg s-1cm-2
M<1014 M⊙
M>1014 M⊙
M>6x10¹⁴ M⊙
Fig. 5.Fraction of XXL bright cluster galaxies hosting an X-ray AGN for a flux-limited sample (FX[0.5−10 keV]> 10−14 erg s−1cm−2), divided
by the field fraction. The results are plotted as a function of distance from the cluster centre. No AGN suppression is present in our low-mass cluster sample, in contrast to the results ofEhlert et al.(2014) on massive clusters. Error bars indicate the 1σ confidence limits for small numbers of events (Gehrels 1986). 0 0.1 0.2 0.3 0.4 0.5 0.6 0.7 0.8 1013 1014 1015 Nx (Mpc -2 ) M500(M⊙)
Fig. 6. AGN density per cluster within 2r500 as a function of cluster
mass. Error bars indicate the 1σ confidence limits for small numbers of events (Gehrels 1986).
Finally, in Fig. 6 we plot the density of AGN per cluster within 2r500,MT as a function of cluster mass. These results are
similar to those presented in Fig. 6 ofEhlert et al.(2015). In both cases, the statistical significance of AGN excess in individual clusters is small, while several clusters do not contain any AGNs. This is due to the rarity of X-ray AGNs in the total galaxy popu-lation. As a result, the expected number density of X-ray AGNs above the luminosity threshold per cluster is very low. Therefore, very rarely is more than one AGN detected within a 2r500radius
of an individual cluster. However, there is evidence of increasing densities towards less massive clusters. On the other hand, this trend also reflects the declining r500radius in the same direction.
Therefore, we argue that in order to obtain reliable results it is necessary to stack the AGN number counts, as described in the current paper and in the literature (e.g.Koulouridis et al. 2014; Ehlert et al. 2015;Bufanda et al. 2017).
E. Koulouridis et al.: The XXL Survey. XXXV.
5. Conclusions and discussion
We studied the X-ray AGN population of a sample of 167 spec-troscopically confirmed X-ray clusters. Our clusters cover the largely unexplored mass range of poor and moderately rich clus-ters (1013–4 × 10¹⁴M ). In this respect, the XXL sample is
unique and even the next X-ray mission, e-Rosita, will not cover this mass range (Borm et al. 2014).
Our results show a significant excess of X-ray AGNs in low-mass clusters (M500,MT< 1014M ), at the 95% confidence level,
up to a radius of 2r500,MT. Nevertheless, in the innermost cluster
region (<0.5r500,MT) a sharp decrease drives the AGN fraction
back to the field level. On the other hand, the high-mass subsam-ple presents a gradually decreasing AGN fraction towards the cluster centres, which reaches a factor of three lower than in the field level. This result is in agreement with previous studies of AGNs in massive cluster samples.
We argue that the AGN excess found in the cluster outskirts of low-mass clusters in this study supports an in-falling pop-ulation scenario. There is indeed evidence that AGNs can be found in surplus in the periphery of clusters (e.g.Johnson et al. 2003;Koulouridis et al. 2014), and they were further shown to be an in-falling population in Haines et al. (2012). However, other studies claimed the opposite for low-luminosity AGNs (Martini et al. 2007). The excess may be attributed to AGN trig-gering because of the higher galaxy density, which can lead to higher merger rates (Ehlert et al. 2015). In Fig. 7, we present two examples of X-ray clusters with spectroscopically confirmed AGN members in the first two annuli; galaxy interactions or merging is possible in both cases. However, high-velocity dis-persions in massive clusters may diminish the probability of galaxy interactions.Arnold et al. (2009) found that ten groups with velocity dispersion σ < 500 km s−1 present higher AGN
fractions than six clusters above this velocity dispersion limit. They used both X-ray (LX> 1041erg s−1) and optically detected
AGNs.
We also argue that the decrease in the AGN fraction in the cluster cores, both in low- and high-mass clusters, supports the ram pressure stripping scheme produced by the hot ICM. The hotter gas in deep gravitational potentials is expected to strip the galaxy more effectively than the colder gas in our poor cluster population. Indeed, the density of AGNs within the first <0.5r500,MT is consistent with the background level, in contrast
to the well-established lack of AGNs in massive clusters. Both of the mechanisms described above lead to the differ-ences between the AGN activity in poor and massive galaxy clusters. Previous results vary depending on the AGN selection, the cluster-mass range, and the selected cluster-centric radius. However, Ehlert et al. (2015) also reported evidence of this cluster mass–AGN activity anti-correlation in a large sample of 135 clusters (2 × 10⁻¹⁴−2 × 10⁻¹⁵M ). They showed that the
den-sity of cluster AGNs has a strong dependence on cluster mass by modelling the behaviour of the individual projected X-ray point source density profiles of the clusters. We argue that the AGN dependence on cluster mass can only be investigated with large cluster samples in a statistical way. The AGN fraction in individ-ual clusters varies considerably (e.g.Martini et al. 2007), and in most cases there are no AGNs detected.
Because of the stripping, AGN activity should be weak in general. Early studies reported that many X-ray selected AGNs in clusters do not even present optical AGN signatures (Martini et al. 2002,2006). In addition,Marziani et al.(2017) provided strong evidence that optical emission is also weaker when com-pared to field AGNs. There is some evidence in our sample
as well, where most of the detected AGNs present no broad Balmer lines in their optical spectra. In addition, some of them do not show any emission lines, as reported previously. How-ever, no significant difference was found between the median X-ray luminosities of AGNs in the outer and inner annuli of the present study. We reanalysed our data including only X-ray AGNs with LX[0.5−10 keV]> 5 × 1042erg s−1. No AGN deficiency
was found in the first annuli that would suggest a higher den-sity of low-luminoden-sity AGNs. We repeated with LX[0.5−10 keV]>
1043erg s−1 and obtained similar results, although the number
of detected sources is drastically reduced. However, we can-not investigate whether the excess of low-luminosity sources reported in previous studies is due to sources with LX <
1042erg s−1. We do not consider these sources in our study
because the XXL survey is shallow, and also because below this luminosity threshold the X-ray emission may be produced by alternative physical mechanisms (e.g. star formation, X-ray binaries).
We note that the low luminosities of X-ray sources may also be attributed to nuclear obscuration (e.g.Johnson et al. 2003; Martini et al. 2007). High obscuration values may as well be due to recent galaxy merging or interactions (e.g.Hopkins et al. 2008; Koulouridis 2014; Koulouridis et al. 2016a). The activ-ity and the type of our sources will be thoroughly explored in a future study. Nevertheless, a first approach showed that within the first two r500annuli the percentage of hard-band only
detected AGNs, which imply obscuration, reaches 30%, while it is ∼16% in the three outer annuli.
Interestingly, ram pressure stripping was also reported as a possible triggering mechanism for AGN activity in cluster mem-bers (Poggianti et al. 2017a), although the statistics are low (five sources), and all except one would not be selected by most X-ray AGN studies, being less luminous than 1042erg s−1. Both effects
of the intracluster gas seem plausible. MUSE spectroscopy of a jellyfish galaxy entering a cluster (Fumagalli et al. 2014) showed that despite the almost total stripping of the galaxy the core still retained a gas reservoir. Nevertheless, the core presented evidence of stripping as well. Therefore, initial pressure may indeed lead gas toward the galaxy core, triggering the nucleus, but eventually leads to strangulation.
To investigate whether there is any evolution of the AGN fraction in cluster galaxies within our redshift range, we fur-ther divided our cluster population into two redshift bins, z= 0.10–0.28 and z = 0.28–0.50. The time interval in both bins is roughly equal to 1.9 Gyr. In Fig.8, we plot the AGN fraction in clusters for the low-mass and high-mass subsamples separately. We also overplot the field value as calculated from our mock catalogues. When all sources above LX[0.5−10 keV] = 1042erg s−1
are considered (top panel) a slight evolution might be present, while the fraction of more luminous sources (bottom panel), LX[0.5−10 keV] > 1043 erg s−1, clearly evolves more rapidly. The
trend is consistent with the AGN fractions reported inBufanda et al.(2017) in cluster galaxies with MR < MR∗+ 1, also
plot-ted in Fig.8. Nevertheless, the AGN fraction in clusters evolves at the same rate as the AGN fraction in the field. Therefore, the ratio of the cluster to the field AGN fraction remains con-stant within the redshift range of the current study. Therefore, we conclude that any evolution of the cluster AGN fraction up to z = 0.5 is not a result of the environment. Another interest-ing conclusion that can be drawn from this figure is that the AGN excess in low-mass clusters is produced by low-luminosity AGNs with LX[0.5−10 keV] < 1043erg s−1, equally present in both
redshift bins. Similar results were also presented inBufanda et al. (2017).
Fig. 7.Optical images (i band) of two XXL clusters overplotted with X-ray contours (0.5–2.0 keV). Left panels: XLSSC 041 (in XXL-N), a C1 cluster at z= 0.142 with an estimated mass of M500,MT∼ 8.3 × 10¹³M and r500,MT= 636 kpc. Right panels: XLSSC 561 (in XXL-S) a C2 cluster
at z= 0.455 with an estimated mass of M500,MT∼ 9.3 × 10¹³M and r500,MT= 993 kpc. The boxes indicate the position of AGNs with spectroscopic
redshifts concordant with the respective cluster redshift. The bottom panels are zoomed-in images of the AGNs found in the black boxes. Both these AGNs are found in overdense regions, where galaxy interactions and merging are probable.
For a meaningful comparison with similar studies in high-redshift cluster samples and proto-clusters, we computed the fraction of AGNs with LX[0.5−10 keV] > 1043erg s−1 within
2r500,MTof the XXL cluster sample. In Fig.9, we plot our results
and we compare them with two samples of low- and high-redshift clusters (z= 0.3 and 1.3, respectively) fromMartini et al.(2013, MR < MR∗+ 1 and M3.6< M∗3.6+ 1, respectively), a proto-cluster
at z= 1.6 (Krishnan et al. 2017, M∗> 1010M ), and a candidate
proto-cluster at z= 2.23 (Lehmer et al. 2013, Hα emitting galax-ies). Two more proto-clusters at redshift z = 2.3 (Digby-North et al. 2010, Lyman-break galaxies) and z= 3.09 (Lehmer et al. 2009, mean AGN fraction among Lyman-break and Ly α galax-ies) are plotted as well, although the AGN X-ray luminosity limits are higher. We note that proto-cluster studies above red-shift 2 do not trace the same galaxy population since the methods for selecting cluster members are biased towards strongly star-forming galaxies (for more details, see Krishnan et al. 2017). Nevertheless, normalising all AGN fractions to their respective field fractions renders them more appropriate for an instructive comparison. In particular, the 13 clusters between z= 1 and 1.5 inMartini et al.(2013) have estimated masses M > 1014M and
up to a few times 1014
M , consistent with our own high-mass sample. However, their low-redshift sample is much more mas-sive than this, being the compilation of the sample of Haines et al.(2012) andMartini et al. (2009). On the other hand, the
mass of the proto-cluster at z= 1.6 has an estimated mass of 5.7 × 10¹³M , well below that of massive clusters in the local universe, but within the range of our low-mass X-ray clusters. We note that low-luminosity AGNs, which mainly produce the AGN excess in our cluster samples, are not included in Fig.9. Evidently, at redshifts above z= 1 the density of AGNs in clus-ters is not dissimilar to the density of AGNs in our sample of lower redshift clusters. At high-redshifts we probably probe the cores of extended formations, the proto-clusters, which will fur-ther collapse to then become massive clusters. The conditions within the cores of these structures may be similar to the con-ditions in the cores of our low-mass clusters at much lower redshifts. Therefore, we argue that the AGN fraction in cluster galaxies anti-correlates with cluster mass.
In brief, our goal was to study the AGN activity in 167 XXL X-ray galaxy clusters as a function of the mass of the clus-ter and of the location of the AGN in the clusclus-ter. We found a significant AGN excess in our low-mass cluster subsample between 0.5r500,MT and 2r500,MT, which decreases to the
back-ground level in the cluster cores. In contrast, the high-mass subsample presents no AGN excess, but rather a decreasing trend, consistent with the results of previous studies on massive clusters.
The AGN excess in poor clusters indicates AGN trigger-ing in the outskirts, supporttrigger-ing previous studies that reported
E. Koulouridis et al.: The XXL Survey. XXXV. 0.000 0.002 0.004 0.006 0.008 0.010 0.012 0.014
cluster AGN fraction
Lx>1043 erg s-1 Lx>1042 erg s-1 M<1014 M⊙ M>1014 M⊙ field fraction 0.000 0.001 0.002 0.003 0.004 0.005 0.006 0.007 0.008 0.1 0.2 0.3 0.4 0.5 0.6
cluster AGN fraction
z
Lx>1043 erg s-1
Lx>1042 erg s-1
Bufanda+17, M>1014 M⊙
Bufanda+17, M<1014 M⊙
Fig. 8.Fraction of XXL bright cluster galaxies hosting an X-ray AGN (top panel: LX[0.5−10 keV] > 1042erg s−1; bottom panel: LX[0.5−10 keV] >
1043erg s−1) within a 2r
500 radius as a function of redshift. We
over-plot the results of similar analysis byBufanda et al.(2017). Red lines indicate the respective field AGN fractions. Error bars indicate the 1σ confidence limits for small numbers of events (Gehrels 1986).
enhanced galaxy merging. This effect is probably prevented by high-velocity dispersions in high-mass clusters. On the other hand, the AGN density that is consistent with that of the field at the cores of low-mass clusters implies that the AGN suppres-sion mechanism is less effective than the one observed in more massive samples where the AGN density is significantly lower than in the field.
The cluster mass–AGN activity anti-correlation provides evi-dence of how deeper gravitational potentials prevent AGN trig-gering in their outskirts and cause more effective ram pressure gas stripping that leads to AGN suppression in their cores.
This study investigates the AGN demographics in galaxy clusters in a statistical way. Further multiwavelength analysis of the individual sources, as well as a comparison with cosmo-logical hydrodynamical simulations (seeKoulouridis et al. 2018, XXL Paper XIX), will be presented in a companion paper. Acknowledgements. XXL is an international project based around an XMM Very Large Programme surveying two 25 deg2 extragalactic fields at a
depth of 5.8 × 10⁻¹⁵erg s−1cm−2 in (0.5–2 keV) at the 90%
complete-ness level (see XXL Paper I). The XXL website is http://irfu.cea. fr/xxl. Multiband information and spectroscopic follow-up of the X-ray sources are obtained through a number of survey programmes, summarised at
http://xxlmultiwave.pbworks.com/. We would like to thank A. Mantz
10-1
100
101
0 0.5 1 1.5 2 2.5 3
cluster AGN fraction/field AGN fraction
z Lx>1043 erg s-1 This paper Martini+13 Krishnan+17 Lehmer+13 Lehmer+09 Digby-North+10
Fig. 9.Fraction of XXL bright cluster galaxies hosting an X-ray AGN (LX[0.5−10 keV]> 1043erg s−1) within a 2r500 radius, divided by the field
fraction. The results are plotted as a function of redshift. We overplot the results of similar analyses of cluster samples (blue) or individual high-redshift proto-clusters (black), as described in Sect.5. Open symbols mark different luminosity limits used for the X-ray AGNs.
and B. Poggianti for comments on the manuscript. The Saclay group acknowl-edges long-term support from the Centre National d’Études Spatiales (CNES). EK thanks CNES and CNRS for support of post-doctoral research. SF acknowl-edges financial support from the Swiss National Science Foundation. This work was supported by the Programme National Cosmology et Galaxies (PNCG) of CNRS/INSU with INP and IN2P3, co-funded by CEA and CNES. This work is based on observations obtained with MegaPrime/MegaCam, a joint project of CFHT and CEA/IRFU, at the Canada-France-Hawaii Telescope (CFHT) which is operated by the National Research Council (NRC) of Canada, the Institut National des Sciences de l’Univers of the Centre National de la Recherche Sci-entifique (CNRS) of France, and the University of Hawaii. This work is based in part on data products produced at Terapix available at the Canadian Astronomy Data Centre as part of the Canada-France-Hawaii Telescope Legacy Survey, a collaborative project of NRC and CNRS.
References
Adami, C., Giles, P., Koulouridis, E., et al. 2018,A&A, 620, A5(XXL Survey, XX)
Arnold, T. J., Martini, P., Mulchaey, J. S., Berti, A., & Jeltema, T. E. 2009,ApJ, 707, 1691
Balogh, M. L., Navarro, J. F., & Morris, S. L. 2000,ApJ, 540, 113
Balogh, M., Bower, R. G., Smail, I., et al. 2002,MNRAS, 337, 256
Bekki, K., Couch, W. J., & Shioya, Y. 2002,ApJ, 577, 651
Bitsakis, T., Dultzin, D., Ciesla, L., et al. 2015,MNRAS, 450, 3114
Bleem, L. E., Stalder, B., Brodwin, M., et al. 2015,ApJS, 216, 20
Borm, K., Reiprich, T. H., Mohammed, I., & Lovisari, L. 2014,A&A, 567, A65
Brandt, W. N., & Alexander, D. M. 2015,A&ARv, 23, 1
Bufanda, E., Hollowood, D., Jeltema, T. E., et al. 2017,MNRAS, 465, 2531
Caglar, T., & Hudaverdi, M. 2017,MNRAS, 471, 4990
Calvi, R., Poggianti, B. M., & Vulcani, B. 2011,MNRAS, 416, 727
Cappelluti, N., Cappi, M., Dadina, M., et al. 2005,A&A, 430, 39
Cappi, M., Mazzotta, P., Elvis, M., et al. 2001,ApJ, 548, 624
Cen, R., & Chisari, N. E. 2011,ApJ, 731, 11
Chiappetti, L., Fotopoulou, S., Lidman, C., et al. 2018,A&A, 620, A12(XXL Survey XXVII)
Chung, A., van Gorkom, J. H., Kenney, J. D. P., Crowl, H., & Vollmer, B. 2009,
AJ, 138, 1741
Coupon, J., Ilbert, O., Kilbinger, M., et al. 2009,A&A, 500, 981
Cowie, L. L., & Songaila, A. 1977,Nature, 266, 501
Davis, D. S., Miller, N. A., & Mushotzky, R. F. 2003,ApJ, 597, 202
D’Elia, V., Fiore, F., Elvis, M., et al. 2004,A&A, 422, 11
Digby-North, J. A., Nandra, K., Laird, E. S., et al. 2010,MNRAS, 407, 846
Eckert, D., Molendi, S., Owers, M., et al. 2014,A&A, 570, A119
Ehlert, S., Allen, S. W., Brandt, W. N., et al. 2013,MNRAS, 428, 3509
Ehlert, S., von der Linden, A., Allen, S. W., et al. 2014,MNRAS, 437, 1942
Ehlert, S., Allen, S. W., Brandt, W. N., et al. 2015,MNRAS, 446, 2709
Eke, V. R., Frenk, C. S., Baugh, C. M., et al. 2004,MNRAS, 355, 769
Ellison, S. L., Patton, D. R., Mendel, J. T., & Scudder, J. M. 2011,MNRAS, 418, 2043
Fioc, M., & Rocca-Volmerange, B. 1997,A&A, 326, 950
Fumagalli, M., Fossati, M., Hau, G. K. T., et al. 2014,MNRAS, 445, 4335
Gehrels, N. 1986,ApJ, 303, 336
Gilmour, R., Best, P., & Almaini, O. 2009,MNRAS, 392, 1509
Giovanelli, R., & Haynes, M. P. 1985,ApJ, 292, 404
Gladders, M. D., & Yee, H. K. C. 2000,AJ, 120, 2148
Gültekin, K., Richstone, D. O., Gebhardt, K., et al. 2009,ApJ, 698, 198
Gunn, J. E., & Gott, J. R., III, 1972,ApJ, 176, 1
Guzzo, L., Scodeggio, M., Garilli, B., et al. 2014,A&A, 566, A108
Haggard, D., Green, P. J., Anderson, S. F., et al. 2010,ApJ, 723, 1447
Haines, C. P., Pereira, M. J., Sanderson, A. J. R., et al. 2012,ApJ, 754, 97
Hao, J., McKay, T. A., Koester, B. P., et al. 2010,ApJS, 191, 254
Hopkins, P. F., & Quataert, E. 2011,MNRAS, 415, 1027
Hopkins, P. F., Hernquist, L., Cox, T. J., & Kereš, D. 2008,ApJS, 175, 356
Hopkins, P. F., Kocevski, D. D., & Bundy, K. 2014,MNRAS, 445, 823
Ilbert, O., Arnouts, S., McCracken, H. J., et al. 2006,A&A, 457, 841
Jaffé, Y. L., Smith, R., Candlish, G. N., et al. 2015,MNRAS, 448, 1715
Jaffé, Y. L., Verheijen, M. A. W., Haines, C. P., et al. 2016,MNRAS, 461, 1202
Johnson, O., Best, P. N., & Almaini, O. 2003,MNRAS, 343, 924
Kauffmann, G., White, S. D. M., Heckman, T. M., et al. 2004,MNRAS, 353, 713
Kawakatu, N., Anabuki, N., Nagao, T., Umemura, M., & Nakagawa, T. 2006,
ApJ, 637, 104
Koester, B. P., McKay, T. A., Annis, J., et al. 2007,ApJ, 660, 221
Koulouridis, E. 2014,A&A, 570, A72
Koulouridis, E., & Plionis, M. 2010,ApJ, 714, L181
Koulouridis, E., Chavushyan, V., Plionis, M., Krongold, Y., & Dultzin-Hacyan, D. 2006a,ApJ, 651, 93
Koulouridis, E., Plionis, M., Chavushyan, V., et al. 2006b,ApJ, 639, 37
Koulouridis, E., Plionis, M., Chavushyan, V., et al. 2013,A&A, 552, A135
Koulouridis, E., Plionis, M., Melnyk, O., et al. 2014,A&A, 567, A83
Koulouridis, E., Georgantopoulos, I., Loukaidou, G., et al. 2016a,A&A, 586, A3
Koulouridis, E., Poggianti, B., Altieri, B., et al. 2016b,A&A, 592, A11
Koulouridis, E., Faccioli, L., Le Brun, A. M. C., et al. 2018,A&A, 620, A4(XXL Survey, XIX)
Krishnan, C., Hatch, N. A., Almaini, O., et al. 2017,MNRAS, 470, 2170
Larson, R. B., Tinsley, B. M., & Caldwell, C. N. 1980,ApJ, 237, 692
Lehmer, B. D., Alexander, D. M., Geach, J. E., et al. 2009,ApJ, 691, 687
Lehmer, B. D., Lucy, A. B., Alexander, D. M., et al. 2013,ApJ, 765, 87
Lidman, C., Ardila, F., Owers, M., et al. 2016,PASA, 33, e001
Lieu, M., Smith, G. P., Giles, P. A., et al. 2016,A&A, 592, A4
Lin, Y.-T., Mohr, J. J., Gonzalez, A. H., & Stanford, S. A. 2006,ApJ, 650, L99
Liske, J., Baldry, I. K., Driver, S. P., et al. 2015,MNRAS, 452, 2087
Magorrian, J., Tremaine, S., Richstone, D., et al. 1998,AJ, 115, 2285
Martini, P., Kelson, D. D., Mulchaey, J. S., & Trager, S. C. 2002,ApJ, 576, L109
Martini, P., Kelson, D. D., Kim, E., Mulchaey, J. S., & Athey, A. A. 2006,ApJ, 644, 116
Martini, P., Mulchaey, J. S., & Kelson, D. D. 2007,ApJ, 664, 761
Martini, P., Sivakoff, G. R., & Mulchaey, J. S. 2009,ApJ, 701, 66
Martini, P., Miller, E. D., Brodwin, M., et al. 2013,ApJ, 768, 1
Marziani, P., D’Onofrio, M., Bettoni, D., et al. 2017,A&A, 599, A83
Melnyk, O., Elyiv, A., Smolcic, V., et al. 2018,A&A, 620, A6(XXL Survey, XXI)
Molnar, S. M., Hughes, J. P., Donahue, M., & Joy, M. 2002,ApJ, 573, L91
Oh, S., Mulchaey, J. S., Woo, J.-H., et al. 2014,ApJ, 790, 43
Pacaud, F., Pierre, M., Refregier, A., et al. 2006,MNRAS, 372, 578
Pacaud, F., Pierre, M., Adami, C., et al. 2007,MNRAS, 382, 1289
Pierre, M., Valtchanov, I., Altieri, B., et al. 2004,JCAP, 9, 011
Pierre, M., Pacaud, F., Adami, C., et al. 2016,A&A, 592, A1
Pierre, M., Adami, C., Birkinshaw, M., et al. 2017,Astron. Nachr., 338, 334
Poggianti, B. M., Jaffé, Y. L., Moretti, A., et al. 2017a,Nature, 548, 304
Poggianti, B. M., Moretti, A., Gullieuszik, M., et al. 2017b,ApJ, 844, 48
Popesso, P., Biviano, A., Böhringer, H., & Romaniello, M. 2006,A&A, 445, 29
Ricci, M., Benoist, C., Maurogordato, S., et al. 2018,A&A, 620, A13(XXL Survey, XXVIII)
Rykoff, E. S., Rozo, E., Busha, M. T., et al. 2014,ApJ, 785, 104
Schawinski, K., Khochfar, S., Kaviraj, S., et al. 2006,Nature, 442, 888
Silverman, J. D., Kampczyk, P., Jahnke, K., et al. 2011,ApJ, 743, 2
Smith, R. K., Brickhouse, N. S., Liedahl, D. A., & Raymond, J. C. 2001,ApJ, 556, L91
Söchting, I. K., Clowes, R. G., & Campusano, L. E. 2002,MNRAS, 331, 569
Szabo, T., Pierpaoli, E., Dong, F., Pipino, A., & Gunn, J. 2011,ApJ, 736, 21
Tanaka, M., Goto, T., Okamura, S., Shimasaku, K., & Brinkmann, J. 2004,AJ, 128, 2677
van den Bosch, F. C., Aquino, D., Yang, X., et al. 2008,MNRAS, 387, 79
Vijayaraghavan, R., & Ricker, P. M. 2013,MNRAS, 435, 2713
Villforth, C., Sarajedini, V., & Koekemoer, A. 2012,MNRAS, 426, 360
Wen, Z. L., Han, J. L., & Liu, F. S. 2009,ApJS, 183, 197
Wen, Z. L., Han, J. L., & Liu, F. S. 2012,ApJS, 199, 34
Wetzel, A. R., Tinker, J. L., & Conroy, C. 2012,MNRAS, 424, 232
Zubovas, K., & King, A. R. 2012,MNRAS, 426, 2751


![Fig. 4. Fraction of XXL bright cluster galaxies hosting an X-ray AGN (L X[0.5−10 keV] > 10 42 erg s −1 ), divided by the field fraction](https://thumb-eu.123doks.com/thumbv2/123doknet/13039807.382335/7.892.467.826.129.405/fraction-bright-cluster-galaxies-hosting-divided-field-fraction.webp)

![Fig. 8. Fraction of XXL bright cluster galaxies hosting an X-ray AGN (top panel: L X[0.5−10 keV] > 10 42 erg s −1 ; bottom panel: L X[0.5−10 keV] >](https://thumb-eu.123doks.com/thumbv2/123doknet/13039807.382335/10.892.462.829.127.409/fig-fraction-bright-cluster-galaxies-hosting-panel-panel.webp)
