HAL Id: hal-00569550
https://hal.archives-ouvertes.fr/hal-00569550
Submitted on 25 Feb 2011
HAL is a multi-disciplinary open access
archive for the deposit and dissemination of sci-entific research documents, whether they are pub-lished or not. The documents may come from teaching and research institutions in France or abroad, or from public or private research centers.
L’archive ouverte pluridisciplinaire HAL, est destinée au dépôt et à la diffusion de documents scientifiques de niveau recherche, publiés ou non, émanant des établissements d’enseignement et de recherche français ou étrangers, des laboratoires publics ou privés.
Two-dimensional neutron scattering in a floating heavy
water bridge
Elmar C Fuchs, Patrick Baroni, Brigitte Bitschnau, Laurence Noirez
To cite this version:
Elmar C Fuchs, Patrick Baroni, Brigitte Bitschnau, Laurence Noirez. Two-dimensional neutron scat-tering in a floating heavy water bridge. Journal of Physics D: Applied Physics, IOP Publishing, 2010, 43 (10), pp.105502. �10.1088/0022-3727/43/10/105502�. �hal-00569550�
Two-Dimensional Neutron Scattering in a
Floating Heavy Water Bridge
Elmar C. Fuchs1, Patrick Baroni2, Brigitte Bitschnau3, and Laurence Noirez2
1Wetsus, Centre of Excellence for Sustainable Water Technology, Agora 1, 8900 CC Leeuwarden, The
Netherlands
2Laboratoire Léon Brillouin, CEA-CNRS/IRAMIS, CE-Saclay, 91191 Gif-sur-Yvette Cedex, France 3Institute of Physical and Theoretical Chemistry, Graz University of Technology, Rechbauerstraße 12,
8010 Graz, Austria Abstract
When high voltage is applied to pure water filled into two beakers close to each other, a connection forms spontaneously, giving the impression of a floating water bridge. This phenomenon is of special interest, since it comprises a number of phenomena currently tackled in modern water science. In this work, the first two dimensional structural study of a floating heavy water bridge is presented as a function of the azimuthal angle. A small anisotropy in the angular distribution of the intensity of the first structural peak was observed, indicating a preferred orientation of a part of the D2O molecules along the
electric field lines without breaking of the local tetrahedral symmetry. The experiment is carried out by neutron scattering on a D2O bridge.
Introduction
In 1893 Sir William Armstrong placed a cotton thread between two wine glasses filled with chemically pure water. After applying a high voltage, a watery connection formed between the two glasses, and after some time, the cotton thread was pulled into one of the glasses, leaving, for a few seconds, a rope of water suspended between the lips of the two glasses [1]. As gimmick from early days of electricity this experiment was handed down through history until the present authors learned about it from W. Uhlig, ETH Zürich [2]. Although easy to reproduce, this watery connection between the two beakers, which is further referred to as 'floating water bridge' or ‘floating heavy water bridge’ in the case of D2O, respectively, holds a number of interesting static and dynamic phenomena [3-8].
At macroscopic scale several of these phenomena can be explained by modern electrohydrodynamics, analyzing the motion of fluids in electric fields (see, e.g., the Maxwell pressure tensor considerations by Widom et al. [9], or the book of Castellanos [10]), while on the molecular scale water can be described by quantum mechanics (e.g. [11,12]). The gap at mesoscopic scale is bridged by a number of theories including quantum mechanical entanglement and coherent structures in water, theories which are currently discussed (e.g. [13-17]). Previous experiments [3] suggested a possible change of the water micro structure inside the water bride; first neutron scattering experiments [5] showed no difference in the microdensity of a D2O bridge compared to the bulk; detailed
optical measurements [6] suggested the existence of a mesoscopic bubble network within
the water bridge. The properties of water at these scales have drawn special attention due to their suggested importance to human physiology [18].
Experimentally, mesoscopic and microscopic scales are accessible by neutron scattering measurement techniques which are easily applicable to this experiment since the water cylinder forming between the two glass beakers floats in air freely [6]. In this work the first in situ two-dimensional study of a floating D2O bridge with focus the molecular
scale (Q > 1 Å-1) is presented. Experimental
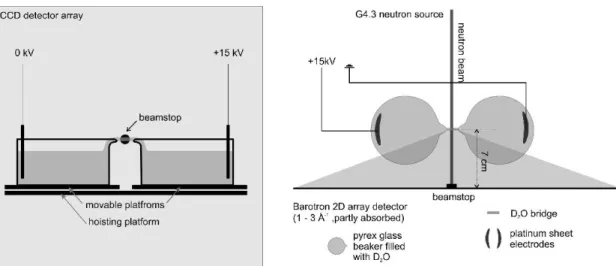
The experiment was carried out at the Laboratoire Léon Brillouin, Saclay, France, on the neutron diffractometer “Barotron” at the G4.3 channel allowing the observation of the large scattering vectors at two dimensions and with a high resolution (0.52mm×0.52mm pixel size) [19-21]. The wavelength of the incident neutrons was λ=2.51 Å, the diameter of the beam was 3 mm. The scattered intensity was measured by a CCD array multidetector with 520 · 520 cells covering scattering angles from q=0.2 Å-1 to 2.5Å-1 where q is the scattering vector defined as 4 .sin(θ/2)
λ π
=
q [22] where θ is the scattering angle. A D2O bridge with 10 mm in length was set up with glass beakers. As
described in [4], Platinum electrodes were submerged in the centre of the beakers, one set to ground potential (cathode), the other on high voltage, up to 25 kV dc (anode). The beakers were filled with double-distilled D2O (isotopic purity >99%, conductivity <1µS/cm). A Phywe high-voltage power supply (‘Hochspannungs-Netzger¨at 25 kV’, Order No 13671.93) was used with a 42 nF ceramic capacitor connected in parallel to the electrodes. The voltage was measured by a potential divider of 500MΩ/500 kΩto ground level. Since the voltage generator provided a limited current output, the electric current was stable at 0.5 mA, while the voltage continuously adapted. Initially the D2O had room temperature, it heated up slowly during bridge operation. The S(q) of water is temperature dependent; however, this effect is important only at low temperatures, particularly for supercooled water [23], but is very small [24] in the considered temperature range (20–40°C [6]). Therefore, it is feasible to compare the resultant I(q) spectra with bulk D2O. The centre of the bridge was 70mm apart from the detector surface. In order to reproduce the beaker position and the bridge length the beakers were placed on platforms that could be moved with µm screws. The height was adjusted with a hoisting platform. A sketch of the set-up is given in Fig. 1, a D2O bridge is shown in Fig.
Fig. 1: Front and top views of the Water bridge set-up at the Barotron 2D detector (reactor Orphée, Saclay).
Fig. 2: D2O bridge (~1.2 cm length, ~2 mm diameter) with triply distilled D2O (σ< 1µS / cm), 15kV DC,
0,5mA.
The bridges were kept stable up to one hour. Whenever a break down occurred, the bridge was manually restarted. In order to avoid light water contamination, bridges were kept under a constant dry nitrogen flux of ~10 mL/s with the N2 outlet placed 10 cm
above the bridge. The data acquisition time for the graph shown in Fig. 3 was 120 min. After subtracting the electronic background, the spectrum was corrected for sample geometry and cell sensitivity using the scattering data of a vanadium rod with the bridge’s geometry measured at the bridge’s position. Bulk D2O was measured in a 2 mm
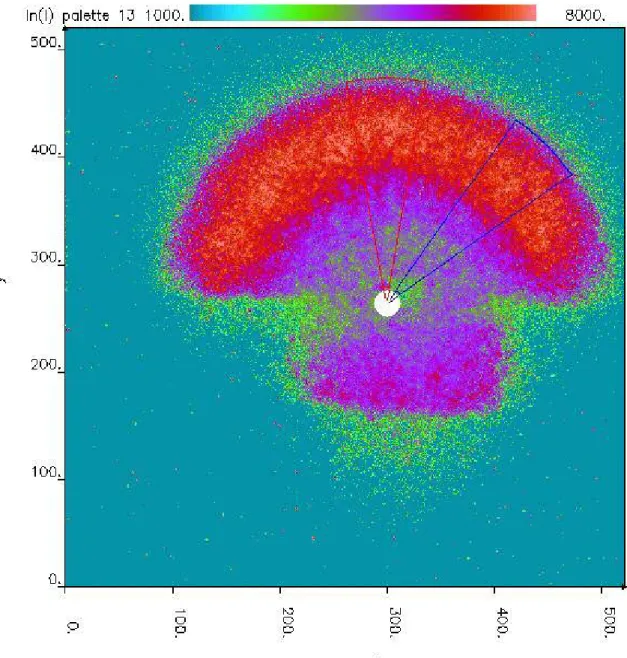
capillary, an empty capillary was used for the correction. The obtained two-dimensional pictures were treated using lab-made software to extract the intensity profile along the scattering vector and along the azimuthal axis [27]. Two angular sectors of 20° width and
centered at 90° and at 45° with respect to the horizontal axis were chosen to represent the intensities scattered perpendicularly to the water bridge and along it respectively. The observation of the intensity scattered strictly (at 0°) along the water bridge was not possible due to the shadows produced by the beakers. Finally, the analysis of the azimuthal intensity distribution was carried out by dividing the water bridge spectrum by the bulk D2O spectrum as a function of the azimuthal angle in a zone concentrated around
the maximum intensity (see Fig. 5). Results
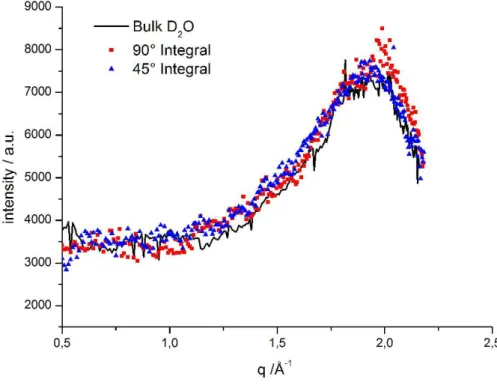
The present geometry allowed the investigation of scattering vectors from 0.5 up to 2.5 Å-1, comprising the first structural peak of D2O. The resultant graph is given in Fig. 3.
Due to the shadow of the beakers and the platform, only the upper half of the spectrum could be analyzed. In order to look for a possible anisotropy whilst staying clear of any shadow effects (present close to 0° and at 180°), spectra centered at 45° and 90° angles with respect to the bridge’s main axes were integrated and are compared to each other and to bulk D2O in Fig. 4.
Fig. 3: Two-dimensional neutron scattering pattern produced by a floating heavy water bridge on a 520x520 CCD detector. The colors represent the number of counts (see scale above). The white dot in the middle is the beam stop. The shadows on the right, left and bottom sides are the (real space) shadows of the beakers and the platform the beakers were standing on, respectively. The marked areas are the ones chosen for integration in Fig. 4.
Discussion
The I(q) graph for bulk D2O and the D2O bridge at the 45° and 90° segments,
respectively, is given in Fig. 4. The lower q region (q < 0.5 Å-1) will not be discussed here, since artifacts like neutron reflection cannot be completely avoided so close to the
beam trap with the geometry chosen for this investigation. Therefore, the authors plan to conduct additional measurements with a different sample / detector geometry in order to specially investigate this scattering region.
Fig. 4: Intensity versus q determined at 90° (red curve) and at 45° (blue curve) compared to bulk D2O at
45° (black line). The colored curves represent the integration of the red and blue marked areas in Fig. 3. The position of the first structural peak of the heavy water bridge is coinciding with bulk D2O, which is in agreement with a previous study [5]. Therefore, the intermolecular
distances are sensibly the same as in the bulk D2O. However, the analysis of the
anisotropy of the signal of the heavy water bridge shows small differences between the scattering spread at 90° and at 45°, with the 90° curve showing a slight over-intensity compared to the other curves. This difference is significant compared to the accuracy of the experiment which was estimated from a set of experiments on the spectra of bulk D2O
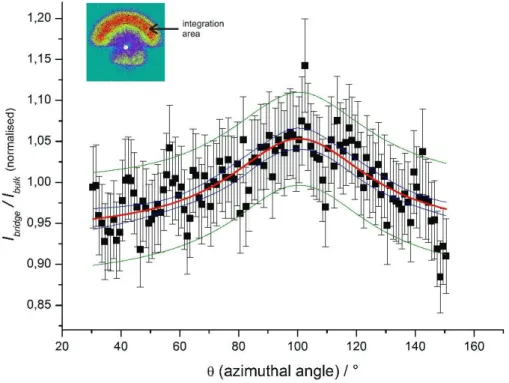
inside a capillary with 2.25mm interior diameter, recorded and treated the same way as the bridge data.Both filled and empty capillary were measured 30 times continuously for 100 sec resulting in spectra withσ<5%. The distribution of orientation is given in Fig. 5 by an angular dependent representation of the over intensity signal (D2O bridge divided
by bulk D2O) of the first structural peak with q ranging from 1.81 to 2.10 Å-1 (see also
framed area in the insert in Fig. 5). In order to obtain the bulk water spectra, the spectra of the filled capillary were divided by the data from the empty one. The resultant spectrum (Ibulk) was used for the calculation of the data in Fig. 5 by dividing the bridge water data by this spectrum with a subsequent normalisation. The red curve represents a Lorentzian function fitted onto the data including the 95% confidence (inner curves) and 95% prediction bands (outer curves). The correlation is reasonably good (r² = 0.570) and
by far better than the correlation with a horizontal line function (r² = 2.5·10-14) which would represent an isotropic behavior.
Fig. 5: Angular dependence of the intensity distribution in the first structural peak of the molecules in the
heavywater bridge. The reported data are the projection along the azimuthal angle of the points lying in the mask and corresponding to the cell to cell division of the D2O bridge data by bulk D2O data. The mask in
the left inset encircles the evaluated area (30°-150°). The red curve is the fitted Lorentzian, the inner (blue) curves are the 95% confidence bands, the outer (green) curves are the 95% prediction bands.
The interpretation of the anisotropic distribution of the intensity is not straight forward. The considered over-intensity actually constitutes an overlap of three different g(r) functions [25]. It nevertheless indicates the increase of the interactions along the vertical axis. Therefore, it is valid to assume that the over-intensity can be interpreted as an orientational preference of some molecules inside of the bridge without any major changes of their local tetrahedral geometry. Such anisotropic scattering distribution is generally expressed in terms of a Lorentzian function where the maximum of which indicates the average orientation of the scatterers and the width of which provides the average degree of orientation of the scatterers in the sample with respect to bridge. The maximum of the fitted Lorentzian is at 100°±2°. This result can be considered to lie within the experimental precision achievable when probing a highly dynamic phenomenon which has an actual maximum probably at 90° perpendicular to the bridge’s main axis (or the electric field lines, respectively). Therefore, it will be treated as such in this evaluation. A possible explanation for a shift could involve the fact that the beam did not hit the horizontal middle of the bridge but a region closer to the cathodic beaker (see
Fig. 3). There, due to its dynamical behavior, the bridge can sometimes change its shape from cylindrical to conical with a larger diameter closer to the beaker [3,4,6], thus resulting in additional attenuation of the signal in that area, an artifact which would shift a 90° maximum to higher angles.
The degree of orientation of the molecules with respect to the preferred direction is estimated from the width of the intensity profile. The Lorentzian fit indicates a relatively large distribution of orientation with a half width at half maximum (HWHM) ofθ=29±5°. This value is characteristic for low-ordered systems.
Such an effect is to be expected due to the applied field. Widom et al. [12] showed that the Maxwell tension inside of a water bridge is actually a tensor, thus anisotropic. Recent simulations (with much higher field strengths) by Rai et al. [26,28] predicted how an external electrical field smoothes the three-dimensional structures, eventually breaking up the structures into more linear or net-like aggregates: “… with an increase in field strength, the H-bond network in a particular configuration of a [water] cluster gets loosened due to enhanced tendency toward reorientation of each constituent water molecule in the direction of an applied field. This, in turn, favors distorting the cluster, on account of increasing interaction between water molecules and applied field winning over that among the clustering water molecules. …” [28] Although the electric field strengths of the simulation are considerably higher than the ones applied in this experiment, the anisotropy can be interpreted as the onset of this re-orientation, aligning some of the tetrahedral clusters without destroying them. The idea that this might be happening within a water bridge was recently suggested by Woisetschläger et al. [6]. Moreover, a preferred molecular orientation could cause the liquid to become partly birefringent. A change of the polarization angle of linearly polarized light was indeed observed in the outer layer of the bridge [4], with birefringence being suggested as one of the possible explanations.
Conclusions
A small anisotropy was found in terms of an over-intensity of the first structural peak perpendicular to the water bridge when compared to the signal intensity of the adjacent azimuthal angles in the range from 30° to 150°, respectively. Amongst the possible explanations of this phenomenon, most plausibly this anisotropy can be interpreted in accordance with an earlier hypotheses [3,6], optical activity [4] and theoretical predictions [7,26,28]and therefore probably representsa preferred orientation of a part of the D2O molecules (their tetrahedral clusters, respectively) along the electric field lines
under retention of their intermolecular distances and geometry, thus reflecting a macroscopic characteristic of the phenomenon – the orientation along a preferred axis – at microscopic levels.In order to complete the study the authors are planning a new series of neutron experiments with an improved geometry, with particular focus on reducing the shadows of the beakers.
Acknowledgments
(Laboratoire Léon Brillouin, Saclay), Eshel Ben-Jacob (Tel Aviv University), Cees Buisman (Wetsus - Centre of Excellence for Sustainable Water Technology), Karl Gatterer (Graz University of Technology), Emilio Del Giudice (Universitá di Milano), Franz Heitmeir (Graz University of Technology), Jan C.M. Marijnissen (Delft University of Technology), Gerald H. Pollack (University of Washington), Alan K. Soper (ISIS Rutherford Appleton Laboratory), José Teixeira (Laboratoire Léon Brillouin, CEA-CNRS/IRAMIS, CEA/Saclay), Giuseppe Vitiello (Universitá degli studi di Salerno) and especially Jakob Woisetschläger (Graz University of Technology) as well as Luewton L.F. Aghostinho, Ingo Leusbrock and Astrid H. Paulitsch (Wetsus, Centre of Excellence for Sustainable Water Technology) for the ongoing discussion on the water bridge phenomenon (in alphabetic order).
References
[1] Armstrong W G, Electrical phenomena The Newcastle Literary and Philosophical Society, The Electrical Engineer (1893)10 February 1893, pp 154-145
[2] Uhlig W, Personal communication, Laboratory of Inorganic Chemistry, ETH
Hönggerberg – HCI, CH-8093 Zürich(2005)
[3] Fuchs E C, Woisetschläger J, Gatterer K, Maier E, Pecnik R, Holler G and Eisenkölbl H, J. Phys. D: Appl. Phys.40 (2007) 6112-6114
[4] Fuchs E C, Gatterer K, Holler G and Woisetschläger J 2008, J. Phys. D: Appl. Phys.
41 (2008) 185502-7
[5] Fuchs E C, Bitschnau B, Woisetschläger J, Maier E, Beuneu B, Teixeira J, J. Phys. D: Appl. Phys.42 (2009) 065502 (4pp)
[6] Woisetschläger J, Gatterer K, Fuchs E C,Exp. Fluids48 (2010) 121-131
[7] Fuchs E C, Bitschnau B, Di Fonzo S, Gessini A, Woisetschläger J, Bencivenga F, J. Phys. D : Appl. Phys. submitted
[8] Nishiumi H, Honda F, Res. Let. Phys. Chem.2009 (2009) art. ID 371650 (3pp)
[9] Widom A, Swain J, Silverberg J, Sivasubramanian S, Srivastava Y N, Phys. Rev. E
80 (2009) 016301 (7pp)
[10] Castellanos A, Electrohydrodynamics, International Centre for Mechanical Sciences, CISM Courses and Lectures No.380, Springer, Wien, New York, Ed. (1998), ISBN 3-211-83137-1
[11] Mrázek J, Burda J V, J. Chem. Phys.125 (2006) 194518
[12] Jorgensen W L, Tirado-Rives J, PNAS Proc Natl Acad Sci.102 (2005) 6685-6670
[13] Del Giudice E, Journal of Physics: Conf. Ser.67 (2006) 012006
[14] Head-Gordon T, Johnson M E, PNAS Proc Natl Acad Sci21 (2006) 7973-7977
[15] Stanley H E, Buldyrev S V, Franzese G, Giovambattista N, Starr F W, Phil. Trans. R. Soc. A363 (2005) 509-523
[16] Chatzidimitriou-Dreismann C A, Redah T A, Streffer R M F, Mayers J, Phys. Rev. Lett.79 (1997) 2839-2842
[17] Arani R, Bono I, Del Giudice E, Preparata G, International Journal of Modern Physics B9 (1995) 1813-1841
[18] Pollack G H, Cells, gels and the engine of life, Ebener & Sons (2001) Seattle WA, ISBN 0-9626895-2-1
[19] Baroni P, Noirez L, US Patent n°0,502,379 (24 March 2005), [20] Baroni P. Noirez L, Neutron News 182007 17,
[21] Noirez L, Baroni P, Appl. Phys. Lett. 902007 243111
[22] Proceedings of the 8thSummer School on Neutron Scattering: Neutron Scattering in Novel Materials, A. Furrer (Editor), Zuoz, Switzerland, World Scientific (2000)
[23] Bosio L, Teixeira J, Dore J C, Steytler D and Chieux P, Mol. Phys. 50 (1983) 733–
40
[24] Gibson I P, Dore J C, Mol. Phys.48 (1983) 1019
[25] Teixeira J, Luzar A., Physics of liquid water. Structure and dynamics, in “Hydration Processes in Biology: Theoretical and experimental approaches”, NATO ASI series, M.-C. Bellissent-Funel ed., (IOS Press, Amsterdam, 1999), 35-65
[26]Rai D,Kulkami A D, Pathak R K, J. Chem. Phys.128 (2006) 034310
[27]Pépy G, J. of Appl. Cryst.40 (2006) 433
[28]Rai D,Ab Initio Investigations on Some Dipole-Bonded Molecular Clusters, Their
Interaction with Water Molecules, and Externally Applied Electric Fields, PhD thesis,