HAL Id: hal-00480935
https://hal.archives-ouvertes.fr/hal-00480935
Preprint submitted on 5 May 2010
HAL is a multi-disciplinary open access
archive for the deposit and dissemination of
sci-entific research documents, whether they are
pub-lished or not. The documents may come from
L’archive ouverte pluridisciplinaire HAL, est
destinée au dépôt et à la diffusion de documents
scientifiques de niveau recherche, publiés ou non,
émanant des établissements d’enseignement et de
Analyzing human gaze path during an interactive
optimization task
Denis Pallez, Marcel Cremene, Thierry Baccino, Ovidiu Sabou
To cite this version:
Denis Pallez, Marcel Cremene, Thierry Baccino, Ovidiu Sabou. Analyzing human gaze path during
an interactive optimization task. 2010. �hal-00480935�
1
Analyzing human gaze path during an interactive
optimization task
Denis Pallez
University of Nice, Sophia-Antipolis
Laboratoire I3S - UMR6070 - UNSA CNRS
[email protected]
,
Marcel Cremene
Technical University of Cluj-Napoca
Str. Baritiu, no. 26, Cluj-Napoca, Romania
[email protected]
Thiery Baccino
LUTIN (UMS-CNRS 2809)
Cité des sciences et de l'industrie de la Villette
[email protected]
Ovidiu Sabou
Babes-Bolyai University
Cluj-Napoca, Romania
[email protected]
ABSTRACTInteractive Evolutionary Computation (IEC) community aims at reducing user’s fatigue during an optimization task involving subjective criteria: a set of graphic potential solutions are simultaneously shown to a user which task is to identify most interesting solutions to the problem he had to solve. Evolutionary operators are applied to user choices expecting to produce better solutions. As traditional IEC ask the user to give a mark to each solution or to explicitly choose bests solutions with a mouse, we propose a new framework that uses in real time gaze information to predict which parts of a screen is more significant for a user. We can therefore avoid the user to explicitly choose which solutions are interesting for him. In this paper, we mainly focus on automatically ordering solutions shown on a screen given a gaze path obtained by an eye-tracker. We applied several supervised learning methods (SVM, neural networks…) on two different experiments. We obtain a formula that predict with 85% user choices. We demonstrate that decisive criterion is time spent on one solution and we show the independency between this formula and the experiment.
Author Keywords
Interactive Evolutionary Computation, Eye-tracker, supervised learning, implicit choice, human gaze behaviour. ACM Classification Keywords
H5.m. Information interfaces and presentation (e.g., HCI): Miscellaneous.
INTRODUCTION
Interactive Evolutionary Computation community aims at reducing user’s fatigue during an optimization task involving subjective criteria: a set of graphic potential solutions are simultaneously shown to a user which task is to identify most pleasant or interesting solutions to the problem he had to solve. User choices are commonly done by identifying one or several solutions using a mouse or in bad cases, given marks to each potential solution. In both cases, this is an explicit task that could be a long cognitive consuming task. Afterwards, evolutionary operators are applied to user choices expecting to produce better solutions the user has to evaluate. This algorithm, based on Darwin theory, is applied until user is tired or he has found a good solution to his problem.
By using eye-trackers, a computer is able to know what the user is looking at and even how concentrated he is by analyzing pupils diameter. Common uses of eye-trackers are: a pointing mechanism [1], a tool for adapting information presentation and so on [2]. In this paper, we present a framework that uses in real time gaze information (fixations and saccades) to predict which parts of a screen (solution) is more significant for a user. By this way, we can therefore avoid the user to explicitly choose which solutions are interesting for him.
Firstly, we present interactive evolutionary computation and related works. Next, we present our application which combines IEC and an eye-tracker in order to minimize user’s fatigue during interactive evaluation of candidate solutions. To be fully operational, our application needs to convert gaze information to rank values for each solution presented to the user. In order to correlate those data, we present two experiments we have conducted. We analyse results coming from this two experiments by using supervised learning methods that give us a formula. This formula gives us a rank value for each solution given gaze information (fixations and saccades).
Presented at International IUI 2010 Workshop on Eye Gaze in Intelligent Human Machine Interaction.
WHAT IS IEC?
Interactive Evolutionary Computation is an optimization technique based on evolutionary computation such as genetic algorithm, genetic programming, evolution strategy, or evolutionary programming. Evolutionary computation considers several candidate solutions to a problem called the population. Thanks to an iterative progress, this population is computationally evolved by using mechanisms inspired by biological evolution such as reproduction, mutation, recombination, natural selection or survival of the fittest [3] according to the Darwin’s theory. In classical evolutionary computation, a selection operator is often a program or a mathematical expression called the
fitness function that expresses the quality of a candidate
solution. Interactive Evolutionary Computation is used when it is hard or impossible to formalize efficiently this function where it is therefore replaced by a human user. A large survey of more than 250 papers can be obtained in [4], but the generally accepted first work on IEC is Dawkins [5], who studied the evolution of creatures called “biomorphs” by selecting them manually. A very good example to better understand the interest of IEC could be photofit building [6]. In that case, there is no mathematical function which could specify how much a photofit is interesting; only the witness can subjectively tells whether proposed photofits are similar or not to the person he had seen before.
Characteristics of IEC are inconsistencies of individuals fitness values given by the user, slowness of the evolutionary computation due to the interactivity, and
fatigue of the user due to the obligation to evaluate
manually all the individuals of each generation [4, 7]. For instance, the user is often asked to give a mark to each individual or to select the most promising individuals: it still requires active time consuming participation during the interaction. The number of individuals of a classical IEC is about 20 (the maximum that can be simultaneously shown on the screen), and about the same for the number of generations.
However, some tricks are used to overcome those limits, e.g., trying to accelerate the convergence of IEC by showing the fitness landscape mapped in 2D or 3D, and by asking the user to determine where the IEC should search for a better optimum [8]. Other work tries to predict fitness values of new individuals based on previous subjective evaluation. This can be done either by constructing and approaching the subjective fitness function of the user by using genetic programming [9] or neural networks, or also with Support Vector Machine [10, 11]. In the latter case, inconsistent responses can also be detected thanks to graph based modelling.
In next paragraph, we propose a new framework which aims at reducing user fatigue by using an eye tracker. Rather than explicitly choosing bests solutions or giving a mark to each candidate solution, human subject just has to watch candidate solutions.
THE EYE-TRACKING EVOLUTIONARY ALGORITHM What is an eye-tracking system?
An eye-tracking system consists of following the eye’s motions while a user watches a screen on which something is presented. It pinpoints in real time the position where the eye is looking, with the help of one video camera focusing on a reflected infrared ray sent to the user’s cornea. This device coupled with a computer regularly samples the space position of the eye and the pupil diameter (Figure 1). We need to extract some semantic information from gaze information coming from the eye-tracker: what is interesting for the subject? To answer this question, we need to compute fixations; that is to say: what did the subject fixate during movement of his eyes? A fixation seems to last between 100 and 300 milliseconds. So fixations are computed from filtered raw data where “jerks” have been removed. For each fixation computed, we know the coordinates (x,y) of subject’s gaze and its duration in microsecond.
Moreover, information given by an eye-tracker also provides user’s pupil diameter. This latter parameter lets us know the cognitive intensity of the user: size of pupil diameter is directly correlated to the concentration of the subject where is looking at something [12, 13]. As one fixation is composed of several values of pupil diameter, we have computed and stored several data related to this pupil diameter for each fixation:
• The mean of the diameter;
• The size at the beginning and at the end of the fixation; • The maximum variation of the size;
• The sum of variation of the size.
Nowadays, eye-tracking systems are very useful because they can analyze in real time what a user is focused on without any effort and in a completely non-restrictive manner. With such equipment, one can finally capture when, how much time, and with which cognitive intensity a screen area is looked at.
video camera tracking reflected infrared ray
on user’s cornea infrared ray sent to user’
right eye
3 How to use an eye-tracker in IEC for minimizing user’s fatigue?
A new evolutionary algorithm called Eye-Tracking Evolutionary Algorithm (E-TEA) has been proposed in [14]. It combines an eye-tracker and a classical evolutionary algorithm as follow:
1.generate initial population randomly; 2.present the population to the user; 3.let the user watch the candidate solutions;
4.compute how much time, how many times and with which cognitive intensity the presented solutions are watched thanks to an eye-tracker;
5.combine previously obtained parameters and compute a fitness value or a relative fitness value for each solution (called “rank” in the rest of the paper);
6.select the most promising solutions thanks to the computed fitness value or rank;
7.make crossover and mutation;
8.return to step 2 until no further good solutions are found. Thus, the user just has to watch the screen and says when he has finished watching/evaluating. There is no need for the user to mark each solution or to explicitly choose the best or most interesting ones. This will save considerable time and the user will be capable to evaluate more solutions; consequently there will be more evaluated generations. We estimate we can double the number of evaluated screens. The main difficulty is to determine how to combine different parameters captured by the eye-tracker (step 5 of the algorithm, i.e. fixations and saccades) in order to define a computable fitness and/or a rank for each solution as automatically as possible.
Motivations
As said previously and in order to minimize user’s fatigue, we need to transform fixations on each solution into rank or fitness for each solution. To do so, we have conducted two experiments, detailed in next paragraphs, for which we can easily compute a rank and/or a fitness for each solution. The goal is to learn user’s behaviour during an optimization task during which we know the rank and/or the fitness for each solution. We hope then this learned behaviour should be used in other optimization tasks for which we are not able to compute fitness and/or rank for each solution: for instance, in photofit design.
EXPERIMENTS
Initial conditions of experiments
As we capture eye motion, the screen presents only 8 zones (one candidate solution per zone) and no solution in the centre of the screen. We avoid presenting solutions in the centre because eyes are naturally attracted to the centre. Also, if the user wants to compare two solutions that are diametrically opposite, eyes are obliged to cross the centre. Consequently, the number of transitions for the centre will
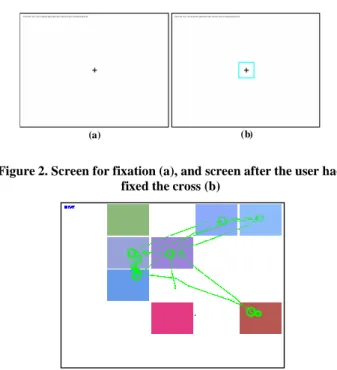
increase considerably and will disrupt the estimated fitness of the solution which could be in the centre. Moreover, when the application is launched, we present a screen composed of a cross in the centre in order to captivate the user’s gaze in the centre where no candidate solutions will be presented (Figure 2a). When the gaze is concentrated on the cross (Figure 2b), the next screen composed of candidate solutions to a problem is presented (Figure 3). But, just before this screen of candidate solutions is presented to the user, a reference’s value of the pupil diameter is computed and stored.
When a new subject (experimenter) wants to participate, we ask him to read the following instructions: “The experiment is made up of a set of tries. Each try will proceed in two phases (Phase 1 and Phase 2). The experiment begins by the calibration of the device (the eye-tracker). All over the experiment, we recommend not to move the head. During the calibration, a blue circle is presented; fixate it. Phase 1 named ‘cross fixation’: A cross is presented in the centre of the screen. Focus on this cross to go next screen (when correctly fixed a blue rectangle will surround the cross). Phase 2 named ‘evaluation’: Several solutions will be presented simultaneously. Detect the one you prefer. Once you think you have finished, press the space bar without looking at it to go next screen (next try).” When the user presses the keyboard’s space bar, we detect whether the user was watching a solution. If it is the case, the solution is marked as “selected”.
Stored data
As there are potentially several fixations for one candidate solution, we have to compute new data from fixations for
(a) (b)
Figure 2. Screen for fixation (a), and screen after the user had fixed the cross (b)
Figure 3. Several candidate solutions simultaneously presented to a human subject and its gaze graphically represented
each candidate solution. So, data that we had really stored are the following:
R,G,B or a number
information identifying each candidate solution (RGB model for experiment on colours or the number for the experiment on numbers)
Trans
The number of transitions towards one screen area in which the candidate solution is shown. When gaze path entered in a zone, Trans is increased TransRank The rank of the previous value compared
with the other values of the screen TransPop The sum of transition’s number for all the
candidate solutions of the screen
TransNorm The relative transition’s number (= Trans/TransPop)
Time The time the user has focused on a candidate solution
TimeRank The rank of the Time value compared with the other values of the screen TimePop The sum of focused time for all the
candidate solutions
TimeNorm The relative time focused on screen (= Time/TimePop)
MeanDP / MeanDPRank
The mean of the pupil diameter and its relative rank
RefDP The reference value of the pupil diameter CognitiveDP The cognitive pupil diameter
(=MeanDP‒RefDP) MaxDPVar /
MaxDPVarRank
The maximum variation of the pupil diameter and its relative rank
SumDPVar / SumDPVarRank
The sum of variation of the pupil diameter and its relative rank
Selected
A Boolean value representing whether the candidate solution has been fixed just before going to next screen
Luminance Value of the objective fitness used by supervised learning methods
(x1,y1,x2,y2)
Positions of candidate solutions on the screen (between 0 and 1): (x1,y1) of upper left corner and (x2,y2) of bottom right corner
First experiment based on colours
Optimization problem
This experiment is borrowed from [15] where the One-Max problem is considered as an interactive optimization
problem in order to compare Interactive Genetic Algorithm (IGA) and Human-Based Genetic Algorithm (HBGA). Recall that the One-Max optimization problem consists in maximizing the number of 1s in a string of bits (0 or 1) only in using evolving operators (selection, mutation, crossover…). It is the simplest optimization problem. The Interactive One-Max problem consists in choosing the clearest colour amongst presented colours on a screen. Solutions are represented in the evolutionary computation algorithm by a string of 24 bits, 8 bits each for red, green and blue.
Objective Fitness
The objective way to find the clearest colour is obtained by computing the luminance defined by
B G R B G R L( , , )=0.299 +0.587 +0.114 where R, G and B
respectively represent the amount of Red, Green and Blue in the colour.
Number of subjects
During one week and a half, 81 subjects have evaluated 7350 screens composed each by 8 coloured squares.
First Results
When analyzing number of transitions on each solution
(a)
(b)
Figure 4. Sample of one screen for each experiment (circles and lines respectively represent fixations and saccades, larger
5 during this experiment, we discovered that subjects didn’t watch all solutions presented on a screen (Figure 4a). It seems that subjects were using their peripheral visions to look at a colour. Thus, we proposed a new experiment based on numbers which forces the subject to read something (Figure 4b).
Second experiment based on numbers
The optimization goal is simply to find the greatest number among several graphically presented ones. To avoid introducing some bias, only numbers with same number of digits were simultaneously presented on the same screen, but it was not said to subjects.
Solutions are represented in the evolutionary computation algorithm by a string of 32 bits, 4 bits for one digit number.
Number of subjects
During two days, 32 subjects have evaluated 1585 screens composed each by 8 coloured squares.
CANDIDATE SOLUTIONS AUTOMATED ORDERING Candidate solutions automated ordering is the operation that orders solutions (for one generation of the evolutionary computation algorithm) by assigning a rank to each of them. For generations composed by N solutions the ranks values are: 1, 2, 3...N where 1 is the rank for the most interesting/relevant solution (in our experiments N = 8). In order to solve this issue we need to create a system
S_rank that takes as inputs the ocular data (stored data, see
section 4.2) and gives as output the solutions ranks 1…N. The objective fitness computed in the experiments described in the section 4.3 and 4.4 enable us to use supervised training for the S_rank system.
Two different approaches were considered for identifying/training the S_rank system:
• Supervised classification. According to this approach
each rank is associated with a different class. The system will determine the rank by classifying the input data. We train (supervised training, using the objective fitness) the system to classify in the same class all the solutions that have a same rank.
• Regression or function approximation. According to this approach, we are looking for a function f (implemented by the system S_rank) that takes as argument a vector corresponding to the ocular data (for one solution) and return a value corresponding to the rank. The function is searched by supervised training.
Results obtained with the classification approach
Classification methods used
Several classification methods were used in order to analyze the data obtained from the eye-tracking system. These methods are described below.
Linear (Fisher's) classifier. This method is related to the
Fisher's linear discriminant [16]. The idea is to find the linear combination of features, which separate two or more classes of objects. This method projects high-dimensional data onto a one dimensional space and performs classification in this one-dimensional space. The projection maximizes the distance between the means of the two classes while minimizing the variance within each class.
Neural networks (NN) classifier, using variable number of
hidden neurons (HidN). This method relates to the well known classical pattern recognition using neural networks[17].
Naive Bayesian (NB) classifier. A naive Bayes classifier
[18] is a simple probabilistic classifier based on applying Bayes' theorem with strong independence assumptions (the presence of a particular feature of a class is unrelated to the presence of any other feature). Usually, parameter estimation for naive Bayes models uses the method of maximum likelihood.
Gaussian (ML) classifier. Gaussian classification [19] is a
type of statistical classification. Statistical classification is a procedure in which solution items are placed into groups based on quantitative information on one or more characteristics inherent in the items.
Direct Tree (DT) classifier. A decision tree [20] is a
predictive model; that is, a mapping from observations about an item to conclusions about its target value. In these tree structures, leaves represent classifications and branches represent conjunctions of features that lead to those classifications.
T-distribution, full covariance classifier. The (Student)
t-distribution is a probability t-distribution [21] that arises in the problem of estimating the mean of a normally distributed population when the sample size is small and this algorithm is a special case of the generalized hyperbolic distribution.
Classification results analysis
A set of about 54000 data vectors (one per solution) was recorded from the eye tracking system. Each vector corresponds to one candidate solution. We make the hypothesis that there is a correlation between the ocular activity and the solution rank.
Classifier performance depends very much on the characteristics of the analyzed data. In general, there is no a best classifier that works on all possible problems. Knowing that, we have done some comparative tests using the toolbox "Matlab Classification Toolbox" from Meraka Institute. The results are depicted in Figure 5 and indicate the Fisher’s method as the best one for this first experiment, with a global error rate of 23%.
A multi-class implementation of SVM [22] was also used to classify the dataset. The initial data was split in two parts, a training set of 5000 examples and the test set, contains the rest of the examples. The global accuracy was about 32%. After observing that the output of the classifier is not just a usual pattern, but a rank that forms an order relation with the rest of the classes, the accuracy analysis was further developed by taking into consideration the distance between the expected output and the one obtained from the SVM. An output result was considered accurate if it had an error less or equal than one. For example, if the expected output was 4 and the actual output was 3, 4 or 5, the output was considered correct. For ranks 1, 2, 7 and 8 the new accuracy was 81%. The middle ranks: 3, 4, 5, 6 were classified with 55% accuracy. A possible explanation is that solutions of strong interest or no interest stand out from the set.
Some other tests were done with SVM using this time a binary classification. The most relevant individual (first rank) was recognized with 85% accuracy, the second rank accuracy was 33% and the others solutions had about 20% accuracy each one.
The best classification rates were obtained by considering only three classes: a first class containing only the solution which has a rank equals to (1), a second class containing only the solution which has a rank equals to (2) and a third class grouping solutions which have ranks equal to (3, 4, 5, 6, 7, 8). The global accuracy was about 81%. The first class was correctly classified in 83% of cases; the second class in 33% of cases and for the third class, the accuracy was 88%. These results have shown that the first class may be classified with a good accuracy but it is very difficult to correctly classify all 8 solutions. These results lead us to the conclusion that the classification approach is not the most appropriate for solutions automated ordering.
Results obtained with the regression/function approximation approach
A problem is that the classification approach does not take into account the fact that the classes represent ranks. In order to overcome this limitation, we have tested also a function approximation approach. According to this approach, we search a function/relation that allows us to compute the solution ranks starting from the input data. As input data, we have only selected: TransRank, TimeRank,
MeanDPRank and MaxDPVarRank (see section 4.2.).
These values are taking into account the relative differences between the solutions from the same generation.
Several approaches (SVM, MLP backpropagation, RBF, linear neurons) were used for approximating the function
rank = f (TransRank, TimeRank, MeanDPRank, MaxDPVarRank). We have tested the function by taking the
solutions by generations (8 by 8), compute their ranks and then sorting these values in order.
We observed that the function trained using the number-based data (data coming from experiment 2, §4.4) works also for the colour-based data set (data coming from experiment 1, §4.3). When we trained the function using the colour-based set the results were less good for the number-based data set.
With SVM (function approximation mode) the results were the following:
• For the most important solution, the accuracy was 88% for the colour-based experiment and 85% for number-based experiment. If we tolerate an error of 1 (accept to confound sometimes the first with the second) the new accuracy is 97% respectively 95%.
• For the second solution, the accuracy was 31% for numbers and 24% for colours. If we tolerate an error of 1 (accept to confound sometimes the second with the first or with the third) the new accuracy is 55% for numbers and 45% for colours.
• For each of the solutions 3, 4, 5, 6, 7 the mean accuracy was about 17% and, if we tolerate an error of 1, the new accuracy was about 45%.
We observed that there is no significant difference between the different methods used: SVM, MLP non-linear network and a linear neural network. This may be explained by the fact that data is entangled, excepting for the most important solutions. This observation helped us also to find a simple linear formula for the function f.
This formula was obtained by training a linear neuron:
rank = 0.0353TransRank + 0.3967TimeRank + 0.0208MeanDPRank + 0.0416MaxDPVarRank + 2.6957
This formula also shows that the most relevant input is the time as [23] had stated but it was done on very few experimenter (about only 4 human subjects).
Figure 5. Data classification errors obtained with different classification algorithms ("Matlab Classification Toolbox"
7 To verify this formula, 8 colours or 8 numbers are taken from same generation (same screen) and are ordered according to the value (rank) given by the formula. With the rank computed by this linear formula the results were: • For the first (most important) solution, the accuracy was
87% for the colours and 82% for numbers. If we tolerate an error of 1, the new accuracy is 97% respectively 94%. • For the second solution, the accuracy was 33% for
numbers and 24% for colours. If we tolerate an error of 1 the new accuracy is 58% respectively 44%.
• For each of the solutions 3,4,5,6,7 and 8 the mean accuracy was about 16% and, if we tolerate an error of 1, the accuracy is about 45%.
These results show that the regression/function approximation approach is better than the classification approach for this kind of problems and may be used for ordering the solutions. The most frequent errors appear between neighbour ranks. If we consider acceptable an error of 1 the results are much better.
CONCLUSION
Research presented in this paper is to analyse gaze data coming from two experiments with the aim of understanding human gaze behaviour during an optimization task. Several candidate solutions are shown to a human subject which task is to find a good solution according to its optimization problem. This optimization problem can not be solved with deterministic algorithms because we consider only problems for which it is impossible to formalize how good a solution is: fitness function of interactive evolutionary computation can not be formalized.
Gaze data are obtained thanks to an eye tracker. We analyzed obtained data with several classification and function approximation experiments. The function approximation approach offered better results than the classification: 85% accuracy for the first candidate solution and 96% if we admit an error of 1. A linear formula was found by training a linear neuron. This formula shows that the most important parameter is the time.
These results clearly show that the selection of the most significant solution is possible with a good accuracy and the proposed approach can be used with success for Interactive Evolutionary Computation applications with aim of reducing user fatigue.
As future work, we intend to extend our framework by adding some new input parameters collected from bio-feedback sensors.
ACKNOWLEDGMENTS
This research was partially supported by the project PN II Ideas, no. 1062, financed by the Romanian Research Council CNCSIS-UEFISCSU.
REFERENCES
1. Kumar, M., et al. Reducing Shoulder-surfing by Using Gaze-based Password Entry. in Symposium On Usable Privacy and Security (SOUPS 07). 2007.
2. Istance, H. Gaze-based Creativity and Interacting with Games and On-line Communities. in Communication by Gaze Interaction (COGAIN). 2007. Leicester, UK. 3. Engelbrecht, A.P., Computational Intelligence: An
Introduction. Second Edition ed. 2007: John Wiley and Sons. 597 pages.
4. Takagi, H., Interactive Evolutionary Computation: Fusion of the Capacities of EC Optimization and Human Evaluation, in Proceedings of the IEEE. 2001. p. 1275-1296.
5. Dawkins, R., The Blind Watchmaker. 1986, New York: Norton & Company, Inc.
6. Takagi, H. and K. Kishi. On-line Knowledge Embedding for an Interactive EC-based Montage System. in Third International Conference on Knowledge-Based Intelligent Information Engineeing Systems. 1999. Adelaide, Australia.
7. Semet, Y., Interactive Evolutionary Computation : a survey of existing theory. 2002, University of Illinois. 8. Hayashida, N. and H. Takagi, Acceleration of EC
convergence with landscape visualization and human intervention. Applied Soft Computing, 2002. 1(4): p. 245.
9. Costelloe, D. and C. Ryan, Genetic Programming for Subjective Fitness Function Identification, in Genetic Programming, LNCS, Editor. 2004. p. 259-268.
10. Llorà, X. and K. Sastry. Combating User Fatigue in iGAs : Partial Ordering , Support Vector Machines and Synthetic Fitness. in GECCO. 2005. Washington, D.C., USA.
11. Llorà, X., K. Sastry, and F. Alias. Analyzing Active Interactive Genetic Algorithms using Visual Analytics. in Genetic and Evolutionary Computation (GECCO). 2006. Seattle, Washington, USA.
12. Hess, E. and J. Polt, Pupil size in relation to mental activity during simple problem solving. Science, 1964. 143(3611): p. 1190-1192.
13. Just, M.A. and P.A. Carpenter, The intensity dimension of thought: Pupillometric indices of sentence processing. Canadian Journal of Experimental Psychology, Special Issue: Reading and language processing, 1993. 47(2): p. 310-339.
14. Pallez, D., et al. Eye-Tracking Evolutionary Algorithm to minimize user fatigue in IEC applied to Interactive One-Max problem. in GECCO (Genetic and Evolutionary Computation COnference). 2007. University College, London.
15. Cheng, C.D. and A. Kosorukoff. Interactive One-Max Problem Allows to Compare the Performance of
Interactive and Human-Based Genetic Algorithms. in Genetic and Evolutionary Computation (GECCO). 2004. Seattle, Washington, USA.
16. McLachlan, G.J., ed. Discriminant Analysis and Statistical Pattern Recognition. Wiley-Interscience; New Ed edition ed. 2004.
17. Bishop, C.M., Neural Networks for Pattern Recognition. 1995: Oxford University Press.
18. Zhang, H., Naive Bayesian Classifiers for Ranking in Lecture Notes in Computer Science (Machine Learning: ECML 2004), S.B. Heidelberg, Editor. 2004. p. 501-512.
19. Girard, R., High dimensional gaussian classification. 2008.
20. Quinlan, J.R., Induction of Decision Trees. 1986. 21. Wang, H.X., Zhang, Q.B., Luo, B., Wei, S., Robust
mixture modelling using multivariate t-distribution with missing information. PRL, 2004. 25(6): p. 701-710. 22. Chang, C.-C. and C.-J. Lin. LIBSVM : a library for
support vector machines. 2001; Available from: http://www.csie.ntu.edu.tw/~cjlin/libsvm.
23. Holmes, T. and J. Zanker. Eye on the Prize: Using Overt Visual Attention to Drive Fitness for Interactive Evolutionary Computation. in GECCO (Genetic and Evolutionary Computation COnference). 2008. Atlanta, Georgia, USA.