HAL Id: hal-01460068
https://hal-mines-paristech.archives-ouvertes.fr/hal-01460068
Submitted on 7 Feb 2017HAL is a multi-disciplinary open access archive for the deposit and dissemination of sci-entific research documents, whether they are pub-lished or not. The documents may come from teaching and research institutions in France or abroad, or from public or private research centers.
L’archive ouverte pluridisciplinaire HAL, est destinée au dépôt et à la diffusion de documents scientifiques de niveau recherche, publiés ou non, émanant des établissements d’enseignement et de recherche français ou étrangers, des laboratoires publics ou privés.
Integration of a Comprehensive Stochastic Model of
Occupancy in Building Simulation to Study how
Inhabitants Influence Energy Performance
Eric Vorger, Patrick Schalbart, Bruno Peuportier
To cite this version:
Eric Vorger, Patrick Schalbart, Bruno Peuportier. Integration of a Comprehensive Stochastic Model of Occupancy in Building Simulation to Study how Inhabitants Influence Energy Performance. 30th international plea 2014 conference, Dec 2014, Ahmedabad, India. �hal-01460068�
Eric Vorger is currently a PhD candidate. Patrick Schalbart is a research engineer and Bruno Peuportier is the principal investigator of the research group “Eco-design and energy performance of building” in the Centre for energy efficiency of systems, MINES ParisTech, PSL Research University, Paris, France.
Integration of a Comprehensive Stochastic
Model of Occupancy in Building
Simulation to Study how Inhabitants
Influence Energy Performance
Eric Vorger, MSc Patrick Schalbart, PhD Bruno Peuportier, PhD
MINES ParisTech, PSL Research University, CES - Centre for energy efficiency of systems, 60 Bd St Michel 75006 Paris, France
eric.vorger@mines-paristech.fr
ABSRACT
Building energy simulation (BES) is currently used to design comfortable and energy efficient buildings, e.g. by comparing architectural alternatives. However, usual assumptions on occupancy are too simplistic and do not correspond to real situations. According to performance monitoring experiments, measured buildings consumptions are generally higher than predicted ones. Among the causes of these differences, the role of occupant's behaviour is identified as particularly important. In the tools used by professionals, occupancy is modelled by conventional ratios (e.g. number of persons per m²) and profiles. Besides being inaccurate this representation leaves no place for diversity. On the contrary, the stochastic model presented here takes into account households' and inhabitants' variability in terms of socio-demographic characteristics, schedules, use of electrical appliances, and adaptive behaviour. Instead of one simulation with conventional scenario leading to a unique energy consumption value, a series of simulations is conducted and yields a statistical distribution. For each simulation, virtual households are created through a probabilistic procedure according to dwellings' properties and each occupant is defined by a set of characteristics (age, sex, employment status, etc.). These characteristics condition households' electrical appliances ownership and occupants' activity scenarios, generated through a stochastic model calibrated on data from a French Time Use Survey (TUS). The activity scenarios are used as inputs to simulate the use of electrical appliances, and predict adaptive actions (depending on external and ambient conditions). A case study on a residential building located in Lyon (France) illustrates how the energy consumption probability distribution obtained after a thousand simulations can be used in a process of energy performance guarantee (EPG).
INTRODUCTION
Many monitoring experiments performed in the past years on new or retrofit buildings revealed that buildings energy consumptions exceeded the previsions of the simulation tools. This gap can partly be explained by differences between the real building envelope and the simulated one but it seems that the effective conditions of occupancy play an even more important role. Andersen (2012), for example, highlighted this point by observing very dispersed annual heating consumptions for similar dwellings
under the same climate. Moreover, the role of occupant's behaviour is particularly important in efficient buildings whose performance is very sensitive to solar and internal heat gains as well as to heat losses due to ventilation. In the simulation tools, occupancy is modelled by conventional ratios and profiles. A new approach is necessary to increase the relevance of simulation results (in terms of energy consumption and thermal comfort), avoid design errors and represent behavioural diversity. Controlling the uncertainties related to occupancy is also essential to develop a process of EPG, currently a major issue for the building sector. An original model of occupancy that tackles this issue in the case of residential buildings is described in the second part. The third one presents its application to the issue of EPG. Suggested improvements for the model and possible applications are discussed in the conclusion.
DESCRIPTION OF THE INTEGRATED BEHAVIOURAL MODEL
The proposed integrated behavioural model is composed of several submodels in order to:
- create realistic virtual inhabitants defined by a set of socio-demographic characteristics (no equivalent model has been found in the literature),
- generate inhabitants' activity scenarios according to their characteristics, using the detailed model developped by Wilke et al. (2013), which was calibrated with data from a TUS,
- equip households, and describe appliances' duty cycles and standby power – data from surveys were used to define ownership probabilities depending on households' characteristics and measurements were used to generate a diversity in appliances' characteristics, while reference models (Richardson, Thomson, Infield, & Clifford, 2010; Tanimoto, Hagishima, & Sagara, 2008; Widén & Wäckelgard, 2009) consider the average national ownership rate and a unique power use for each type of appliance,
- simulate the use of appliances – data from measurement campaigns made possible a calibration for each type of appliance, while previous models used a residual electrical power to comply with aggregated dwelling's electricity consumptions,
- simulate actions of occupant's on windows using Haldi and Robinson's model.
The way the different parts of the model are articulated and coupled to the dynamic BES software
Pleiades+Comfie is summarised in Figure 1.
By repeating the simulation according to the Monte Carlo method, the model generates a distribution of the energy consumption relative to occupancy instead of the usual unique value. Temperature setpoints control is not integrated (indoor temperatures were measured in the building considered for the case study) nor actions on shading devices (which are difficult to model in residential buildings since the driving factors are numerous and vary from case to case : the role of temperature and privacy can be important, whereas the link with visual comfort is strongly prominent in office buildings).
Stochastic creation of virtual households
The first submodel creates virtual inhabitants for every housing at the beginning of a simulation. Since series of simulations are conducted, the same housing is stochastically inhabited by different virtual households at each simulation (e.g. a five-persons family, or a single occupant, etc.). Each inhabitant is described by a set of socio-demographic characteristics that are consistent:
- for a given individual (e.g. the retired status must be in agreement with the age),
- between individuals of the same households (e.g. if the first individual is a married man, father of one child and having a high income level, his wife and child must be generated too, their ages must be consistent and they must share his living standard),
- between inhabitants and the housing, for which the simulation tool user is always able to provide the location (urban/rural), the number of rooms and the type (detached house/apartment/other).
Individuals' characteristics are strongly intercorrelated, therefore they are determined sequentially. From the number of rooms, the type of housing and the location there are probabilities for different number of members of the household; knowing the size of the household there are probabilities for different types of households; knowing the type of household there are probabilities for the age and gender of his reference member, etc. The whole procedure draws on large datasets from the last population census in France and associated surveys.
Generation of activity scenarios for each occupant
Presence and activities modeling allows localising the inhabitants in the different rooms and assigning corresponding metabolic heat gains. But more importantly, it is a necessary input to simulate the adaptive actions and the use of appliances and lighting. Wilke et al.'s model (2013), based on Markov processes and multinomial logit models, was adapted to provide weekly scenarios (then reproduced identically for every week of the simulation) for every inhabitant. In this model, the probability to start an activity and the associated distribution of duration both depend on the day of the week, the time of the day, and the socio-demographic characteristics of the individuals. To illustrate its outputs, Figures 2 and 3 respectively present the average daily profile of the activities for a population of 15,441 people (corresponding to the individuals of the TUS) and a daily scenario for a random occupant.
Figure 3 Example of a daily scenario for a random individual (the colors legends are the same as in Figure 2).
Before linking activity scenarios to appliances operation, households have to be equipped and their equipments described. For all these steps, the example of the dishwasher is used as an illustration.
Households' electrical appliances ownership
This submodel equips households with appliances, according to probabilities relative to their characteristics. More than thirty appliances are modeled, including several instances of the same equipment (e.g. principal and secondary television or computer have different characteristics). According to the type of appliance, probability of ownership corresponds to the average national rate, or depends on the age of the reference person1 , the type of household, its income or a combination of these factors. In the case of dishwashers, probabilities of ownership are determined as functions of the type of households and its income (c.f. Table 1) according to results from (INSEE, 2012).
Table 1. Dishwashers' Probabilities of Ownership
Household type\Income quartile 1st 2nd 3rd 4th
One person household 25 % 30 % 35 % 40 %
Couple alone 60 % 65 % 70 % 80 %
Couple with children 65 % 80 % 85 % 90 %
Single-parent family 35 % 45 % 45 % 55 %
Other type of household 45 % 50 % 50 % 70 %
Description of appliances' duty cycles
This submodel assigns a duty cycle (constituted of a square signal or a succession of square signals) and a standby power to each appliance. Appliances of a same type can have various operating powers according to their technology, dimension and preferred mode of use. Data are mostly provided by several comprehensive measurement campaigns realised by the engineering office ENERTECH in partnership with EDF and ADEME2. For instance, 65 dishwashers' consumptions were measured with a 10 min resolution during one year (ENERTECH, 2008). Dishwashers' duty cycles can be divided into four phases. Water is heated during phases 1 and 3 while cold water is used in phases 2 and 4. A fifth phase of active drying is optional. Each appliance is associated with a nominal power ranging from 1,500 to 2,100 W3. Phases correspond to a percentage of this power and a duration (both potentially variable). In agreement with observations of the campaign, an appliance in a specific household is associated to a unique duty cycle. Table 2 summarises the description of the operating phases.
Table 2. Dishwashers' Duty Cycles
Phases N°1 N°2 N°3 N° 4 N° 5
% of the nominal power 100 10 - 30 40 - 80 5 40 - 80
Duration (min) 20 10 - 60 20 10 5
1 The "reference person" is a demographic concept which indicates a kind of "head of the household". 2
EDF : Eléctricté De France ; ADEME : Agence De l'Environnement et de la Maîtrise de l'Energie 3
Maximal power can be higher but peak loads occur on periods much shorter than the 10 min time step of the model. A superior temporal resolution isn't necessary to evaluate heat gains in a building or even to model the electricity demand of several housing units because of thermal mass and averaging effects.
A seasonal coefficient is affected to the nominal power to reflect the cold water temperature variation. The three values of the coefficient, corresponding to winter, summer and midseason (respectively 1.09, 0.82 and 0.98), were obtained by dividing the measured average daily consumption of the period by the measured annual average daily consumption. Figure 4 shows a good agreement between the modeled cycles consumptions and the measured ones.
Figure 4 Comparison between modeled and measured cycles consumptions.
Simulation of the use of appliances - Starting probabilities calibration
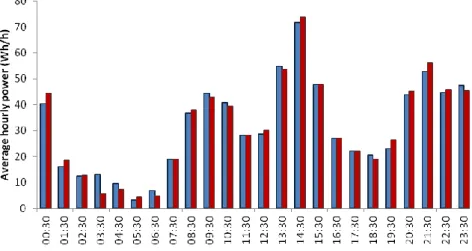
The use of appliances is linked to occupants’ activities through pragmatic hypotheses. In the case of dishwashers, it is assumed that they operate just after the end of a meal. Therefore, every time a period of "Meals and snacks" ends, a random number is sampled on [0, 1] and compared to the dishwasher starting probability to determine wether a cycle begins. For a few appliances, among which dishwashers, time delay functions are integrated to allow shifting the starting time. In the case of dishwashers, delays mostly concern after-dinner cycles, when people do not need to use the appliance before the next morning. Shifting is then used to benefit from lower electricity prices of the night. To have a number of cycles during the night in coherence with measurements it is supposed that 25 % of the cycles between 6 p.m. and 11 p.m. are shifted after 11 p.m., with an average delay of 4 hours. A main objective of the model is to accurately reproduce the load variations during a day. To do so, the starting probabilities are calibrated as functions of the hour, so that the average daily load curve obtained through a great number of simulations fits the average daily load curve taken from the measurements. Figure 5 illustrates the obtained similarity of the two curves (the root mean square error per hour is 2.3 Wh) using the calibrated starting probabilities presented in Table 3.
Table 3. Dishwashers' starting probabilities at the end of a meal as a function of time
0h - 8h30 8h30 - 13h 13h - 14h 14h - 19h 19h - 21h 21h - 24h
0.10 0.16 0.22 0.17 0.25 0.15
Simulation of the use of appliances - Evaluation of the ability of the model to produce diversity
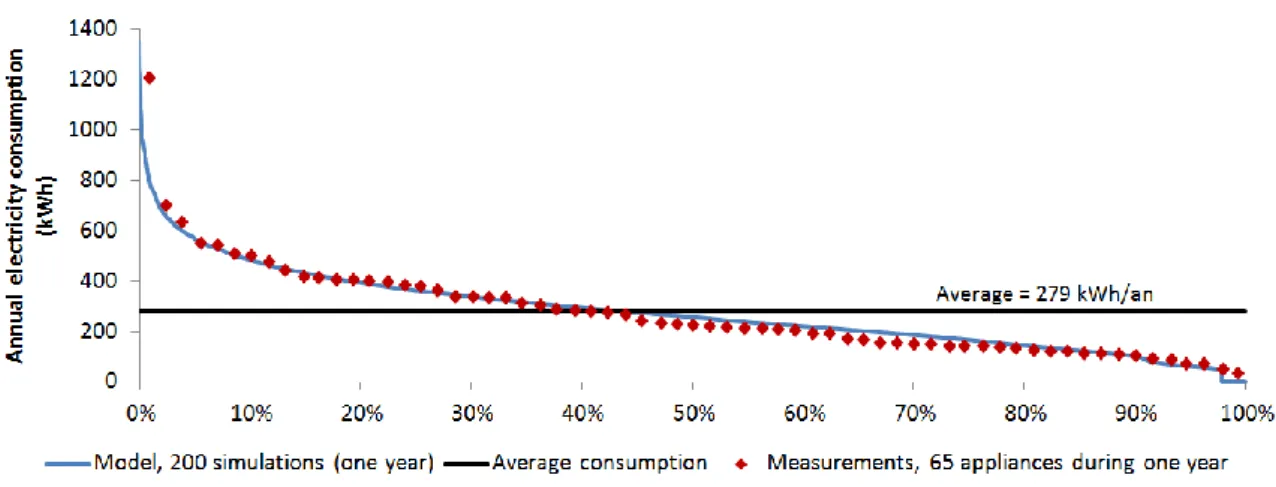
By choosing this way of calibration, it is ensured that the model reproduces an average number of cycles and an average annual consumption that are in good agreements with measurements. It is also necessary to evaluate its ability to produce a realistic diversity. The proper behaviour of the model on that point is illustrated by Figure 6 which shows, for example, that 10 % of the dishwashers have a consumption higher than 500 kWh/year.
Figure 6 Comparison of the modeled and measured annual consumptions.
Application of the electrical consumption model including artificial lighting modeling
Artificial lighting use is modeled similarly to appliances, except that switch on probabilities depend on the hours of sunrise and sunset. The calibration data are provided by annual measurements of every light bulbs in 100 housing units in France (ENERTECH, 2004).
As an illustration of the whole electrical consumption model outputs, Figure 7 presents a load curve of a random four room apartment for the first week of the year (Monday 1th.january to Sunday 7 th). Appliances are regrouped by type (e.g. dishwashers are part of the "washing" group with washing machines, tumble dryers, clothes irons and vacuum-cleaners).
Figure 7 Example of a weekly electrical load curve for a four room apartment.
One can observe for instance the importance of standby consumption of the audiovisual part for this housing and the concentration of peak loads around 8 a.m., noon and 7 p.m. The derived internal heat gains scenario presents the same trends with lower peaks because only part of the electric energy
consumption is converted into heat gains (e.g. for dishwashers 40 % of the energy is lost as greywater).
Occupants' actions on windows
Whereas the previous submodels were part of a preprocessing that may be seen as a "scenario generator", windows' openings and closings interact with the thermal calculation at each time step since such actions depend on inside and outside temperatures, while air flows influence the heat gains or losses. Haldi and Robinson's model (2009) is used for this part. Its predictions address the binary action "open/close" but gives no indication on the opening rate. Therefore, when an opening happens, an entering airflow is sampled between 5 and 15 vol/h and assumed constant during the opening duration.
APPLICATION TO EPG OF A RESIDENTIAL BUILDING
One objective of the integrated behavioural model is to assess the uncertainties related to occupancy in order to develop a process of EPG. In this context, we studied a 4 storeys residential building with a 1,048 m² area located in the suburb of Lyon. It includes 16 apartments, modelled by a thermal zone each, plus a central circulation corresponding to a seventeenth zone (Figure 8 a). The exercise carried out in this case study was the following one: this building was retrofitted including an insulation of the outside walls; heating consumption, air exchange, and indoor temperature were measured before the renovation; the goal was to estimate the heating consumption after the renovation with a confidence interval allowing the project manager to make a commitment on a guaranteed performance. Then, this performance was compared to the actual consumption, which was measured during the year following the renovation. The uncertainty due to occupants' behaviour was calculated with the Monte Carlo method (1,000 simulations including the integrated behavioural model were conducted to draw a smooth gaussian distribution of the heating loads but fewer are required to reach the convergence on the average value and the standard deviation). The thermal characteristics of the building after renovation are given in Table 4. Results are summarised in Figure 8 b.
Figure 8 (a) Thermal zones of the building (design interface of the simulation tool
Pleiades+Comfie). (b) Heating loads distributions for two temperature setpoints corresponding
to measuremements before and after renovation.
We first consider that the heating temperature was maintained to its value before renovation (approached by a 20.2 C constant scenario). Using this heating scenario and scenarios from the French regulatory method for presence and internal gains4, the annual heating loads were 38 kWh/m², whereas the Monte-Carlo method leads to an average value of 45 kWh/m² with a standard deviation of 3.5 kWh/m² (blue curve). Accepting a risk of exceeding of 2.5 %, the guaranteed performance would be 52 kWh/m². The average value for annual heating loads and the guaranteed performance threshold were respectively 18 % and 37 % higher than the value obtained through the regulatory calculation method.
4
Presence and internal gains during the night and the week-end. Using also the conventionnal scenario for heating (19 °C during presence), the calculated annual heating loads were 29 kWh/m².
The actual loads (62 kWh/m²) were superior to the guaranteed performance value, essentially because of a "rebound effect" on the heating setpoint : average temperatures measured in winter after the renovation approached 23 °C (compared to 20.2 °C before). Guarantee obviously cannot longer apply if the requirements of the inhabitants increase after the renovation. For such a heating setpoint (red curve), the guaranteed performance would have been 75 kWh/m².
Table 4. Thermal characteristics of the building
Facades U = 0.22 W/(m².K) Thermal bridges Psi = 356 W/K Loggias U = 0.23 W/(m².K) Mechanical ventilation flow 0.3 vol/h Low floor U = 0.49 W/(m².K) Air infiltrations flow 0.15 vol/h Roof terrace U = 0.29 W/(m².K) T° setpoint before works
T° setpoint after works
20.2 °C
Windows U = 1.9 W/(m².K) 22.8 °C
CONCLUSION
A comprehensive stochastic model of occupants' behaviour in residential buildings is proposed. It integrates an original model for the creation of virtual individuals described by a set of socio-demographic parametres. This allows a high degree of refinement in the generation of schedules and in the attribution of equipment to households according to statistical data. The use of appliances and lighting is modeled on the basis of inhabitants' activities with a higher accuracy than existing models from the literature, through data from several large measurement campaigns. A reference model for interactions of occupants with windows was adapted. The whole model is coupled to a dynamic BES tool with no more necessary input than the building description (but any available information on inhabitants' characteristics or equipment can be filled by the user). The distribution of the simulation outputs is than obtained using the Monte-Carlo method. In the case study, it was observed that the monitoring of temperature setpoints in winter is essential in a process of EPG (knowing that it can be easily and reliably implemented at low cost). If not, considering the possibilities of evolutions of the temperature setpoints leads to a wide distribution, unexploitable in this context. However, this aspect being under control, a commitment on a guaranteed value becomes possible. In this case the guaranted value would be 38 % higher than the value calculated with conventionnal deterministic scenarios.
In further studies the whole coupled model will be encapsulated within the statistical software R. The influence of different parametres of the integrated model will be analysed to identify the aspects on which attention should be paid in terms of improvement and data collection. The outputs of interest will include heating loads but also domestic electricity consumptions and comfort indicators.
REFERENCES
Andersen, R. V. 2012. The influence of occupants' behaviour on energy consumption investigated in 290 identical dwellings and in 35 apartments. Healthy Buildings, At Brisbane, Australia
ENERTECH. 2004. Campagne de mesures de l’éclairage dans 100 logements en France, Rapport final.
ENERTECH. 2008. Campagne de mesure des appareils de production de froid des appareils de lavage dans 100 logements, Projet AEE2008, Rapport final.
Haldi, F., and D. Robinson. 2009. Interactions with window openings by office occupants. Building and Environment, 44(12): 2378–2395.
INSEE. 2012. Statistiques sur les ressources et les conditions de vie (SRCV-SILC 2012). Richardson, I., Thomson, M., Infield, D., and C. Clifford. 2010. Domestic electricity use, A
high-resolution energy demand model. Energy and Buildings, 42: 1878–1887.
Tanimoto, J., Hagishima, A., and H. Sagara. 2008. Validation of methodology for utility demand prediction considering actual variations in inhabitant behaviour schedules. Journal of Building Performance Simulation, 1(1): 31–42.
Widén, J., and Wäckelgard, E. 2009. A high-resolution stochastic model of domestic activity patterns and electricity demand. Applied Energy, 87, 1880–1892.
Wilke, U., Haldi, F., Scartezzini, J.-L., and D. Robinson. 2013. A bottom-up stochastic model to predict building occupants’ time-dependent activities. Building and Environment, 60: 254–264.