HAL Id: insu-00414419
https://hal-insu.archives-ouvertes.fr/insu-00414419
Submitted on 9 Sep 2010
HAL is a multi-disciplinary open access
archive for the deposit and dissemination of sci-entific research documents, whether they are pub-lished or not. The documents may come from teaching and research institutions in France or abroad, or from public or private research centers.
L’archive ouverte pluridisciplinaire HAL, est destinée au dépôt et à la diffusion de documents scientifiques de niveau recherche, publiés ou non, émanant des établissements d’enseignement et de recherche français ou étrangers, des laboratoires publics ou privés.
Shrinkage of microaggregates in Brazilian Latosols
during drying: significance of the clay content,
mineralogy and hydric stress history
Adriana Reatto-Braga, Ary Bruand, E.M. Silva, Régis Guégan, Isabelle
Cousin, Michel Brossard, E.S. Martins
To cite this version:
Adriana Reatto-Braga, Ary Bruand, E.M. Silva, Régis Guégan, Isabelle Cousin, et al.. Shrinkage of microaggregates in Brazilian Latosols during drying: significance of the clay content, mineral-ogy and hydric stress history. European Journal of Soil Science, Wiley, 2009, 60 (6), pp.1106-1116. �10.1111/j.1365-2389.2009.01189.x�. �insu-00414419�
Shrinkage of microaggregates in Brazilian Latosols during drying: significance of the
clay content, mineralogy and hydric stress history
A. REATTOa,b, A. BRUANDb, E. M. SILVAa, R. GUÉGANb, I. COUSINc, M. BROSSARDd & E. S. MARTINSa
a Empresa Brasileira de Pesquisa Agropecuária (Embrapa Cerrados), BR 020, km 18,
73310-970, Planaltina, Distrito Federal, Brazil. E-mail: reatto@cpac.embrapa.br,
euzebio@cpac.embrapa.br, eder@cpac.embrapa.br, b Université d’Orléans, CNRS/INSU,
Université de Tours, Institut des Sciences de la Terre d'Orléans (ISTO), 1A rue de la Férollerie, 45071 Orléans Cedex 2, France. E-mail: adriana.reatto@univ-orleans.fr,
Ary.Bruand@univ-orleans.fr, regis.guegan@univ-orleans.fr. c INRA Orléans, Unité de
Science du Sol, Ardon, BP 20619, 45166 Olivet Cedex, France. E-mail: Isabelle.Cousin@orleans.inra.fr, d Institut de Recherche pour le Développement (IRD), UMR 210 Eco&Sols (Ecologie Fonctionnelle & Biogéochimie des Sols), BP 64501, 34394 Montpellier Cedex 5, France. E-mail: Michel.Brossard@ird.fr
*Corresponding author: Ary.Bruand@univ-orleans.fr (A. Bruand)
Summary
Latosols are characterized by a poor differentiation of the horizons, a weak macrostructure and a strong submillimetric granular structure resulting in microaggregates 50 to 300 µm in size. The shrinkage properties of these microaggregates that are generally considered as very weak or absent are still under discussion. The objective of our study is the analyze the shrinkage properties of microaggregates in diagnostic Bw horizons collected in a set of Latosols varying in their particle size distribution and mineralogical composition according to
their location in a regional toposequence across the Brazilian Central Plateau. We measured the water retention properties at -300 and -1500 kPa by using the centrifugation method. The morphology and size of the elementary particles was studied by using transmission electron microscopy and determining the specific surface area (SSA) with the BET method. We determined also the pore size distribution of the microaggregates by combining mercury intrusion and nitrogen desorption isotherm. Our results showed that the microaggregates of the Latosols studied are not rigid but shrink during drying. The pore volume of the microaggregates at –300 and –1500 kPa as well as the pore volume of the dried microaggregates are closely related to the clay content. The SSA is also closely related to the clay content. Consequently, the mineralogy of the <2 µm would play at the most a marginal role in the properties studied. Finally, our results showed that the shrinkage of the microaggregates between –300 kPa and the shrinkage limit and between –1500 kPa and the shrinkage limit varies with the location of the Latosols in the Landscape. Thus, the microaggregates of the Latosols located on the SAS shrink less than those of the Latosols located on the VS. This difference might be related to a difference of hydric stress history of the Latosols.
Propriétés de retrait des micro-agrégats de Latosols brésiliens : importance de la teneur
en argile, de la composition minéralogique et de l’histoire hydrique.
Résumé
Les Latosols sont caractérisés par une faible differenciation de leurs horizons, une macrostructure peu développée et une structure granulaire submillimétrique représentée par des microagrégats de 50 à 300 µm de diamètre. Les propriétés de retrait de ces agrégats qui sont généralement considérées comme très limitées sont encore discutées. L’objectif de cette étude est d’analyser les propriétés de retrait des microagrégats dans l’horizon diagnostic Bw
de Latosols de composition granulométrique et minéralogique variable en fonction de leur position le long d’une toposéquence régionale sélectionnée pour l’étude dans le Plateau Central brésilien. Nous avons mesuré les quantités d’eau retenues à -300 et -1500 kPa en utilisant la méthode par centrifugation. La morphologie et taille des particules élémentaires ont été étudiées en transmission électronique à transmission et à l’aide de mesure de surface BET. Nous avons aussi déterminé la distribution de taille des pores dans les agrégats déshydratés en combinant les données de la porosimétrie au mercure et celles issues de l’isotherme de désorption d’azote. Nos résultats montrent que les microagrégats des Latosols étudiés ne sont pas rigides mais diminuent de volume lors de la dessiccation. Le volume poral des microagrégats à –300 et –1500 kPa ainsi que leur volume poral après déshydratation sont étroitement lies à la teneur en argile. Par conséquent, la composition minéralogique de la fraction <2 µm ne jouerait au plus qu’un rôle marginal dans les variations du volume poral. Enfin, nos résultats ont montré que les propriétés de retrait des micro-agrégats varient en fonction de la position des Latosols dans le paysage. Ainsi, les micro-agrégats des Latosols situés sur la Surface Sud Américaine diminuent moins de volume lors de la dessiccation que les agrégats situés sur la Surface Velhas. Cela serait lié à l’histoire hydrique des Latosols, ceux situés sur la surface la plus ancienne ayant vraisemblablement subi des contraintes hydriques plus élevées que ceux situés sur la surface la plus récente.
Introduction
The arrangement of the particles in the soil is called soil structure, and is affected by climate, biological activity and soil management practices (Hillel, 2004). The Latosols that represent 1/3 of the Brazilian territory (Ker, 1988) and occupy about 40% of the Brazilian Central Plateau surface (Silva et al., 2005) are characterized by a poor differentiation of the horizons, a weak macrostructure and a strong submillimetric granular structure (Embrapa, 1999)
resulting in microaggregates 50 to 300 µm in size (e.g. Balbino et al., 2001 and 2002; Volland-Tuduri et al., 2004 and 2005). Most Latosols in the Brazilian Taxonomy (Embrapa, 1999) correspond to Oxisols in the Soil Taxonomy (Soil Survey Staff, 2006) or Ferralsols in the World Reference Base (IUSS Working Group WRB, 2006). The main minerals of the <2 µm material are kaolinite, gibbsite, hematite, and goethite (e.g. Curi & Franzmeier, 1984, Macedo & Bryant, 1987, Ker, 1998, Schaefer et al., 2008, Reatto et al., 2009). The weakness of the macrostructure would be related to the small shrinkage of the microaggregates for drying. Balbino et al. (2002) studied the porosity of the microaggregates in several kaolinitic-sesquioxid Latosols from Cerrados biome. They showed that the microaggregates would shrink between –100 kPa potential and air-drying as a result of a reorganization of the clay fabric within the microaggregates for drying. The pore volume of the air-dried microaggregates was 3.7 to 37.1 % smaller than its value at –100 kPa potential. That decrease in pore volume appeared related to the organic carbon content of the microaggregates. Du Gardin et al. (2002) discussed the prediction of the water retention curve from the mercury intrusion curve for kaolinitic Latosols from Amazonia. They recorded a smaller pore volume in the air-dried microaggregates than in the wet microaggregates. Du Gardin et al. (2002) explained that difference as mainly related to a collapse of the microaggregate fabric because of the high pressure applied during the mercury intrusion process in mercury porosimetry (Penumadu et Dean, 2000). Braudeau et al. (2004) studied the shrinkage properties of rewetted < 2 mm sieved aggregates in consistent cylinders and showed that for Oxisols collected in Senegal the mean shrinkage of the elementary aggregates would be about 25 % between saturation and air-drying. Volland-Tuduri et al. (2004) studied the shrinkage for drying of initially water saturated microaggregates using an environmental scanning electron microscope. For the kaolinitic-sesquioxid Latosols studied, they showed very small shrinkage at the scale of individual microaggregates since the volume of dried microaggregates was
found to be 93 to 99 % of their volume at saturation. Braudeau & Mohtar (2006) studied the shrinkage curve of beds of packed < 2 mm aggregates air-dried prior water saturation and collected in Oxisols from Ivory-Coast. They showed that shrinkage of the aggregates varied according to the clay mineralogy. However, because of the consequences of air-drying, sieving and packing on the behavior of the microaggregates, their results cannot be related easily to the shrinkage of the aggregates in the diagnostic horizon. Viana et al. (2004) studied the shrinkage properties of both air-dried and undisturbed Latosols on one hand, and of both air-dried and grinded Latosols on the other by analyzing the crack network that appeared after 10 wetting-drying cycles. They showed a lack of cracks and the stability of the submillimetric granular aggregates in the initially air-dried but undisturbed Latosols studied. They showed also the development of a crack network varying according to the clay content and corresponding to a blocky structure for the initially air-dried and grinded Latosols. Thus, the shrinkage properties of the microaggregates that would explain the weak macrostructure in Latosols are still under discussion. The objective of our study is the analyze of the shrinkage properties of undisturbed microaggregates collected in a set of Latosols varying in their particle size distribution and mineralogical composition according to their location in a regional toposequence across the Brazilian Central Plateau.
The soils studied
The Central Plateau
The Central Plateau corresponds to two main geomorphic surfaces: the South American Surface (SAS) and the Velhas Surface (VS) (King, 1956; Lepsch & Buol, 1988; Motta et al., 2002; Marques et al., 2004). The South American Surface (SAS) corresponds to a landscape that originated from a vast peneplain resulting from erosion between the lower Cretaceous and the middle Tertiary under humid climatic conditions favorable to deep weathering of
rocks (Braum, 1971). Because of continent uplift, that peneplain was dissected, thus resulting in a landscape of tablelands 900 to 1,200-m high corresponding to remnants of the South American Surface (Radambrasil, 1984). The Velhas Surface (VS) has formed later and corresponds to surfaces connecting the South American Surface to lower portions of the landscape where the rivers flow. The VS shows moderate and convex slopes, and covers a much smaller surface areas than the SAS. The most representative climate of the Central Plateau is Megatermic or Humid Tropical (Aw) with the subtype savanna, according to the Köppen (1931) classification. It is characterized by a dry winter (medium temperature of the coldest month > 18°C) and maximum rains in summer. The mean annual rainfall ranges from 1,500 to 2,000 mm, with the highest rainfall in January and the smallest in June, July and August (<50 mm/month) (Assad et al., 1993).
The Latosols selected for study
Ten Latosols (L) developed in different parent materials and under natural vegetation were selected along an approximately 350-km long regional toposequence across two geomorphic surfaces in the Brazilian Central Plateau (Table 1): four Latosols (L1 to L4) located on the South American Surface (SAS) and six others (L5 to L10) on the Velhas Surface (VS). The main characteristics of the Latosols studied can be found in Reatto et al. (2007, 2008a, and 2009). The soils L1 to L4 and L10 were gibbsitic-sesquioxic Latosols and L5 to L9 were kaolinitic-non-sesquioxidic Latosols, and L6 was a kaolinitic-sesquioxidic Latosol. They all showed a strong submillimetric granular structure resulting in microaggregates 50 to 300 µm in size except for L4 where the microstructure was characterized by the assemblage of partially clay coated quartz grains with small rounded microaggregates 10 to 30 µm in size with simple to compound packing voids (Reatto et al., 2009). The quartz grains of L4 were runiquartz (Stoops, 1981) with many < 2 µm infillings richer in iron oxy-hydroxides than the
quartz coating clay material (Reatto et al., 2009, see Figs. 3g & h). Samples were collected between 110 and 140 cm depth in the diagnostic horizon (Bw) of every Latosol.
Methods
The particle size distribution was determined on the air-dried <2-mm material by using the pipette method after dispersion with NaOH 1N (Embrapa, 1997). The organic carbon content was determined on the air-dried <2-mm material by wet oxidation with 0.4 N K2Cr2O7. The
bulk density (g.cm-3) was calculated using the oven-dry mass of the soil material contained in the 100 cm3 cylinders (Embrapa, 1997). The water content was determined at -300, and -1500 kPa by using undisturbed samples collected in triplicate with cylinders 100-cm3 in volume (∅
= 5.1 cm, h = 5 cm). For every Latosol, samples were first saturated for 24 h and then submitted to water extraction by applying the centrifuge method (Silva & Azevedo, 2001; Reatto et al., 2008b). The samples were then oven-dried at 105°C for 24 hours and sieved at 2 mm to obtain the dry mass of < 2 mm material. The water content at -300, and -1500 kPa was referred to the oven-dried < 2 mm material. We determined the pore size distribution of the microaggregates by mercury intrusion and nitrogen desorption isotherm. Mercury porosimetry enables the measurement of both the pressure required to force mercury into the voids of a dry sample and the volume of intruded mercury at each pressure. Mercury intrusion assumes that the pores necks are cylindrical. If the pores necks are cylindrical then the relation between equivalent pore diameter Hg
e
D (expressed in µm) and applied pressure P
(expressed in Pa) is as follows:
(
)
Ρ − = 4γ cosθ / Hg e Dwhere γ = 0.484 Nm-1 and θ = 130° are respectively the surface tension of mercury and its contact angle with the soil material (Fiès, 1984). The pore size distribution was determined for P ranging from 1 to 200 MPa that corresponds to pores with Hg
e
down to 0.0065 µm, respectively. The experiments were performed with a Micromeritics-9310 with undisturbed microaggregates oven-dried at 105°C for 24 hours. Adsorption-desorption isotherms of N2 were performed with about 150 mg of soils samples < 2-mm dried
at 105ºC during 24 hours in an oven and then dried again at 105°C under a pressure of 102 Pa. The specific surface area (SSA) of the material was determined by using the BET equation (Brunauer et al., 1938). The equivalent pore size ( N2
e
D ) distribution curve was obtained for
2
N e
D < 0.2 µm by applying the BJH method to the N2 desorption curve (Barrett et al., 1951).
The experiments were performed with a Nova Surface Analyzer (Quantachrome Instrument Company). The morphology and size of the elementary particles was studied in transmission electron microscopy by using a Philips CM20/STEM working at 200 kV and equipped with an energy dispersive X-ray spectrometer. Prior to their deposit on a carbon coated grid, the < 2 µm fraction was dispersed in alcohol with ultrasounds.
Results and Discussion
Main characteristics of the Bw horizons studied
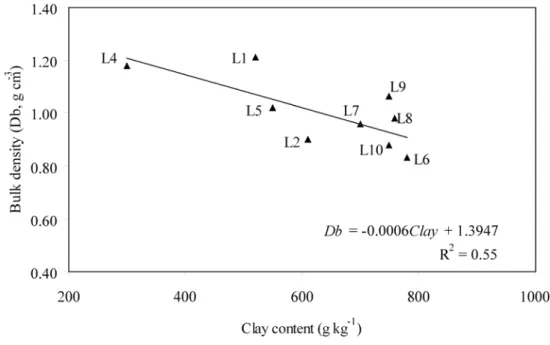
The Bw horizons of the Latosols studied exhibited a large range of clay content (300 ≤ clay content ≤ 780 g kg-1) (Table 2). Their Db ranged from 0.83 to 1.21 g cm-3 that is consistent with Db values recorded earlier in Latosols (Camargo et al., 1988; Ferreira et al., 1999; Balbino et al., 2002). This Db variation was poorly related to the clay content (R2 = 0.55) (Fig. 1). Volland-Tuduri et al. (2005) also established for a set of Latosols that Db was poorly correlated with the clay content (R2 = 0.36) and showed that Db varied mainly with the
microgranular structure development. The organic carbon (OC) was ≤ 6.2 g kg-1 in the Bw studied (Table 2). This small OC content was related to the relatively deep sampling depth of these Bw horizons (i.e. between 110 to 140 cm depth). This small OC content is also
consistent with the values recorded by Camargo et al. (1988) and Balbino (2001) at similar depth. The specific surface area (SSA) ranged from 7.2 to 30.5 m2 g-1 and 71 % of its variance was explained for by the clay content alone (Table 2 and Fig. 2). The remaining unexplained variance did not appear related to the variation of the mineralogy of the clay fraction shown by Reatto et al. (2008a and 2009) for the Latosols studied (Table 1). The SSA can be attributed to the clay fraction solely, the contribution of silt and sand fractions being negligible for clay soils. Thus, we calculated the SSA of the clay fraction (SSAcl, in m2 per g of oven-dried clay) as follows:
SSAcl = (SSA / C) × 1000
with C, the clay content in g per kg of soil. Results showed that SSAcl ranged from 24.1 (L4) to 41.1 m2 g-1 (L2) (Table 3) which is consistent with values of SSAcl recorded earlier. Indeed,
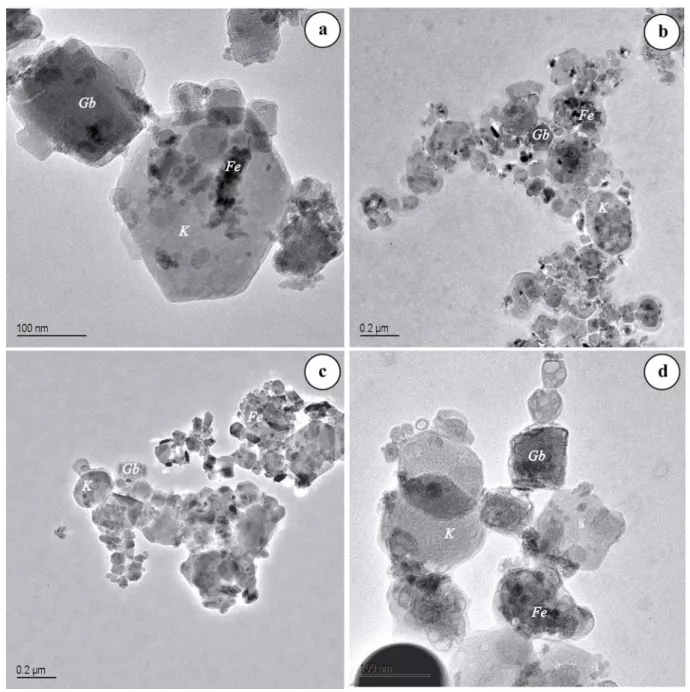
Melo et al. (2001) found 37.7 ≤ SSAcl ≤ 52.6 m2 g-1 for a set of kaolinitic Latosols and Balbino et al. (2002) 45 ≤ SSAcl ≤ 57 m2 g-1 for another set of kaolinitic-sexquioxid Latosols. The size of the elementary particles shown in transmission electron microscopy is consistent with the
SSAcl recorded in the Bw studied (Figure 3). The particles of kaolinite ranged from 0.1 to
0.3 µm in size in the ab direction, the particles of gibbsite from 0.05 to 0.10 µm in size and those of goethite or hematite from 0.01 to 0.3 µm.
Water retained and characteristics of the clay fraction
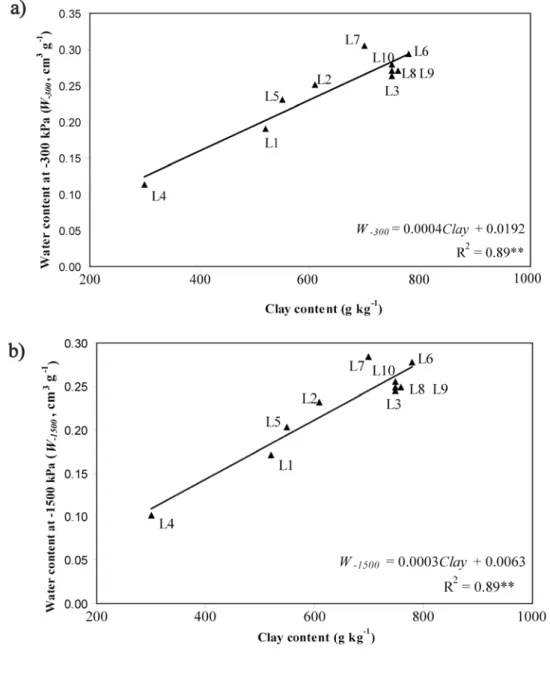
The water retained at –300 kPa (W300) and –1500 kPa (W1500) varied respectively from 0.113
to 0.305 cm3 g-1 and from 0.101 to 0.284 cm3 g-1, and 89% of the variance was explained for
by the clay content alone at each water potential (Figs. 4a and 4b). Thus, there was again a very small proportion of variance remaining that might be attributed to the mineralogy of the clay fraction although the proportion of kaolinite, gibbsite, goethite and hematite varied strongly from one horizon to another (Table 1). A very close relationship between W1500 and
kaolinitic-sesquioxid Latosols and consequently for a set of Latosols with similar clay mineralogy. On the other hand, Tawornpruek et al. (2005) observed a poor relationship between the water retained at –1500 kPa and the clay content for a set of Oxisols from Thailand. This poor relationship might be related to a variation of the nature of the fine material and of the fabric at the scale of the elementary particles assemblage.
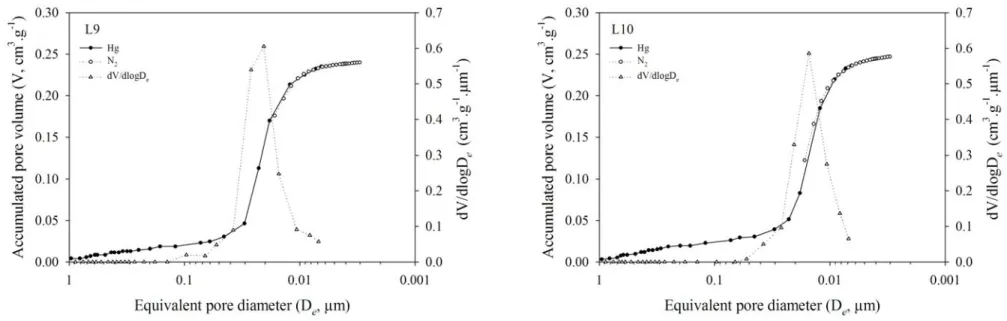
Pore size distribution of the dried microaggregates
The pore size distribution of the dried microaggregates for 1 ≤ De ≤ 0.0028 µm was
established as earlier done by Bruand & Prost (1987) by combining the pore size distribution recorded in mercury porosimetry (1 ≤ Hg
e
D ≤ 0.0065 µm) on one hand, with the one computed
from the nitrogen desorption curve (0.12 ≤ N2
e
D ≤ 0.0028 µm) on the other (Fig. 5). This
indeed enables the full description of the pore size distribution of the microaggregates, the mercury porosimetry being limited to Hg
e
D ≥ 0.065 µm with the mercury porosimeter used.
Our results showed that the pore size distributions recorded with the two methods in the common range of De (i.e. 0.02 ≤ De ≤ 0.0065 µm) were similar for the Latosols studied except
for L4 where the microstructure was characterized by the assemblage of partially clay coated quartz grains with small rounded microaggregates 10 to 30 µm in size (Reatto et al., 2009). For L4, the N2 desorption curve did not join the N2 adsorption curve at a relative pressure of
0.75 as for all the other Latosols studied but at a relative pressure of 0.45, thus indicating a much stronger ink bottle effect (Hillel, 2004). That stronger ink bottle effect would be related to the presence of empty voids within the runniquartz that would be accessible only through the pores of the clay infillings. Our results showed that the total pore volume of the dried microaggregates ( 2
''
N Hg p
V + ) varied from 0.083 to 0.248 cm3 g-1. If we put aside L4 because of the difficulties encountered when combining the results from mercury porosimetry and
nitrogen isotherm desorption, 95 % of the variance of 2
''
N Hg p
V + was explained for by the clay content alone.
Shrinkage properties of the microaggregates
The close relationship between the amount of water retained at –300 and –1500 kPa and the clay content (see above) is consistent with the location of water at these two water potentials within pores resulting from the packing of the clay particles (Figs. 4a and 4b). According to the Jurin’s law (Murray & Quirk, 1980, Bruand & Prost, 1987), at –300 and –1500 kPa one can consider that the water is retained by pores with equivalent pore diameter ≤ 1 and ≤ 0.2 µm, respectively. If we consider the volume of water retained at –300 and –1500 kPa as the volume of pores with equivalent pore diameter ≤ 1 and ≤ 0.2 µm, respectively, it can be compared to the volume of pores with De ≤ 1 µm ( ' 2
N Hg p V + ) and ≤ 0.2 µm ( 2 '' N Hg p V + ) in the dried microaggregates (Fig. 5). Whatever the Bw horizon, the volume of water retained at –300 and –1500 kPa is higher than the volume of pores with De ≤ 1 and ≤ 0.2 µm in the dried
microaggregates, respectively. We computed the decrease in the pore volume between –300 kPa and the dried state that corresponds to the shrinkage limit ( '
p
V
Δ in cm3 per g of dried soil)
on one hand and between –1500 kPa and the dried state ( ''
p
V
Δ in cm3 per g of dried soil) on the other. The pore volume (cm3 g-1) at –300 and –1500 kPa was computed by using 1 g cm-3 for water density. Our results showed that 0.012 ≤ '
p V Δ ≤ 0.078 cm3 g-1 and 0.006 ≤ '' p V
Δ ≤ 0.065 cm3 g-1. The pore volume in the dried microaggregates was 6 to 25 % less than the volume of water at –300 kPa, and 3 to 23 % less than the volume of water at – 1500 kPa, thus showing a measurable shrinkage of the microaggregates for drying. If we except L4, '
p
V
of the <2 µm material. Thus we calculated the decrease in the pore volume clay p V' Δ and clay p V ''
Δ in cm3 per g of clay fraction as following:
clay p V' Δ = ( ' p V Δ / C) × 1000 clay p V '' Δ = ( '' p V Δ / C) × 1000 Results showed that 0.023 ≤ clay
p
V'
Δ ≤ 0.111 cm3 g-1 and 0.011 ≤ ΔVp''clay ≤ 0.093 cm3 g-1
(Table 3).
Significance of the hydric stress history
Analysis of the clay p
V'
Δ and clay p
V''
Δ variation showed a difference according to the location of the Latosols in the Landscape. Indeed, if we except L4, 0.023 ≤ clay
p V' Δ ≤ 0.039 cm3 g-1 and 0.011 ≤ clay p V ''
Δ ≤ 0.027 cm3 g-1 for Latosols located on the SAS, and 0.042 ≤ clay p V' Δ ≤ 0.111 cm3 g-1 and 0.030 ≤ clay p V ''
Δ ≤ 0.093 cm3 g-1 for Latosols located on
the VS (Table 3). Thus, the shrinkage was smaller for the microaggregates of the Latosols located on the SAS than for those of Latosols located on the VS. Therefore, the microaggregates of the Latosols studied were deformable and more deformable in those located on the VS than in those located on the SAS. We can pursue the discussion of our results by considering the significance of the soil hydric history of the Latosols studied as earlier done by Bruand and Tessier (2000) for clayey B horizons collected in French Cambisols and Luvisols. The Latosols of the SAS being older than those of the VS, the fine material forming the microaggregates of the Bw of the SAS would have been submitted to wetting-drying cycles leading to higher effective stress than for the microaggregates of the Bw of the VS. The microaggregates of the Bw of the SAS would be consequently more consolidated and their shrinkage smaller than for the microaggregates of the Bw of the VS.
Such a behaviour is consistent with what has already been observed by Tessier (1984) with kaolinite in the laboratory.
Conclusion
Our results showed that the microaggregates of the Latosols studied are not rigid but shrink during drying. The pore volume of the microaggregates at –300 and –1500 kPa as well as the pore volume of the dried microaggregates was shown closely related to the clay content and consequently independent of the clay material mineralogy although a large range of mineralogy was investigated. Our results showed also that the shrinkage of the microaggregates varies with the location of the Latosols in the landscape. Thus, the microaggregates of the Latosols located on the SAS shrink less than those of the Latosols located on the VS. This might be related to the hydric stress history, the latter varying with the age of the geomorphological surface at the scale of the landscape. Consequently, the mineralogy of the <2 µm material would play at most a marginal role in the properties studied for the Latosols of the Central Plateau. Finally, the weak macrostructure of the Latosols would not be related to a lack of shrinkage of their <2 µm material but to a non propagation of the shrinkage at the macroscopic scale because of the strong submillimetric microstructure.
Acknowledgements
We thank the Empresa Brasileira de Pesquisa Agropecuária (EMBRAPA) for its financial support of A. Reatto’s work in France. This research is part of the project Embrapa Cerrados IRD, N°0203205 (Mapping of the Biome Cerrado Landscape and Functioning of
References
Assad, E.D., Sano, E.E., Masutomo, R., Castro, L.H.R. & Silva, F.A.M. 1993. Veranicos na região dos cerrados brasileiros: freqüência e probabilidade de ocorrência. Pesquisa
Agropecuária Brasileira, 28, 993–1002.
Balbino, L. C., Bruand, A., Brossard, M. & Guimarães, M. F. 2001. Comportement de la phase argileuse lors de la dessiccation dans des Ferralsols microagrégés du Brésil: rôle de la microstructure et de la matière organique. Comptes Rendus de l’Académie des Sciences,
332, 673-680.
Balbino, L.C., Bruand, A., Brossard, M., Grimaldi, M., Hajnos, M. & Guimarães, M.F. 2002. Changes in porosity and microaggregation in clayey Ferralsols of the Brazilian Cerrado on clearing for pasture. European Journal of Soil Science, 53, 219–230.
Barrett, E. P., Joyner, L. G. & Halenda, P. P. 1951. The determination of pore volumes and area distributions in porous substances. Journal of the American Chemical Society, 73, 373-380.
Braudeau, E., Frangi, J-P. & Mohtar, R. H. 2004. Characterizing nonrigid aggregated soil-water medium using its shrinkage curve. Soil Science Society American Journal, 68, 359-370.
Braudeau, E. & Mohtar, R. H. 2006. Modeling the swelling curve for packed soil aggregates using the pedostructure concept. Soil Science Society American Journal, 70, 494-502. Braum, O.P.G. 1971. Contribuição à geomorfologia do Brasil Central. Revista Brasileira de
Geografia, 32, 3–39.
Bruand, A. & Prost, R. 1987. Effect of water content on the fabric of a soil material: an experimental approach. Journal of Soil Science, 38, 461-472.
Bruand, A. & Tessier, D. 2000. Water retention properties of the clay in soils developed on clayed sediments: significance of parent material and soil history. European Journal of
Soil Science, 51, 679-688.
Brunauer, S., Emmett, P. H. & Teller, E. 1938. Adsorption of gases in multimolecular layers.
Journal of the American Chemical Society, 60, 309-319.
Camargo M. N., Kimble, J. M. & Beinroth, F. H. 1988. Classification, Characterization and Utilization of Oxisols, Part 2: Field Trip Background, Site and Pedon Descriptions, Analytical Data. In: Proceedings of the Eight International Soil Classification Workshop,
Brazil. SNLCS-Embrapa, Soil Management Support Services and Soil Conservation
Service–United States Department of Agriculture, University of Puerto Rico.
Curi, N. & Franzmeier, D. 1984. Topossequence of Oxisols from Central Plateau of Brazil.
Soil Science Society of America Journal, 48, 341–346.
Du Gardin, B., Grimaldi, M. & Lucas, Y. 2002. Effects de la déshydractation sur les sols du système ferralsol-podzol d’Amazonie centrale. Reconstitution de la courbe de désorption d’eau à partir de la porosimétrie au mercure. Bulletin Société Géologie France, 173 (2), 113-128.
Embrapa. 1997. Manual de métodos de análise de solo. Empresa Brasileira de Pesquisa Agropecuária, Rio de Janeiro, RJ.
Embrapa. 1999. Sistema Brasileiro de Classificação de Solos. Empresa Brasileira de Pesquisa Agropecuária, Rio de Janeiro, RJ.
Ferreira, M. M., Fernandes, B. & Curi, N. 1999. Influência da mineralogia da fração argila nas propriedades físicas de Latossolos da região sudeste do Brasil. Revista Brasileira de
Fiés, J. C. 1984. Analyses de la répartition du volume de pores dans les assemblages argile squelette : comparaison entre un modèle d’espace poral textural et les données fournies par la porosimétrie à mercure. Agronomie, 4, 319-355.
Hillel, D. 2004. Introduction to Environmental Soil Physics. Elsevier Science, Academic Press, Oxford, UK.
IUSS Working Group WRB. 2006. World reference base for soil resources 2006. World Soil Resources Reports N° 103. FAO, Rome.
Ker, J. C. 1998. Latossolos do Brasil: uma revisão. Geonomos, 5(1), 17-40.
King, L.C. 1956. A geomorfologia do Brasil Central. Revista Brasileira de Geografia, 18(2), 3-39.
Köppen, W. P. 1931. Grundriss der Klimakunde. Walter de Gruyter, Berlin.
Lepsch, I. F. & Buol, S. W. 1988. Oxisol-Landscape relationships in Brazil. In: Proceedings
of the Eighth International Soil Classification Workshop. Classification, Characterization and Utilization of Oxisols. Part 1: Papers. (Beinroth, F. H., Camargo,
M. N., Eswaran, H., Eds). Rio de Janeiro-RJ, pp. 174-189.
Macedo, J. & Bryant, R.B. 1987. Morphology, mineralogy, and genesis of a hydrosequence of oxisols in Brazil. Soil Science Society of America Journal, 51, 690-698.
Marques, J. J., Schulge, D. G., Curi, N. & Merttzman, S. A. 2004. Major element geochemistry and geomorphic relationships in Brazilian Cerrado soils. Geoderma, 119, 179-195.
Melo, V. F., Singh, B., Schaefer, C. E. R., Novaes, R. F. & Fontes, M. P. F. 2001. Chemical and mineralogical properties of kaolinite-rich Brazilian soils. Soil Science Society
Motta, P. E. F., Carvalho Filho, A., Ker, J. C., Pereira, N. R., Carvalho Junior, W. & Blancaneaux, P. 2002. Relações solo-superfície geomórfica e evolução da paisagem em uma área do Planalto Central Brasileiro. Pesquisa Agropecuária Brasileira, 37, 869-878. Murray, R. S. & Quirk, J. 1980. Clay-water interactions and the mechanism of soil swelling.
Colloids Surfaces, 1, 17-32.
Penumadu D. & Dean J. 2000. Compressibility effect in evaluating the pore-size distribution of kaolin clay using mercury intrusion porosimetry. Canadian Geothecnical Journal, 37, 393-405.
Radambrasil, 1984. Levantamentos de recursos naturais, Folha SD. 23. Brasília. Ministério de Minas e Energia - Secretaria Geral.
Reatto, A., Bruand. A., Silva E. M., Martins E. S. & Brossard M. 2007. Hydraulic properties of the diagnostic horizon of Latosols of a regional topossequence across the Brazilian Central Plateau. Geoderma, 139, 51-59.
Reatto, A., Bruand. A., Martins, E. S., Muller, F., Silva, E. M., Carvalho Jr, O. A. & Brossard, M. 2008a. Variation of the kaolinite and gibbsite content at regional and local scale in the Latosols of the Brazilian Central Plateau. C. R. Geoscience, 340, 741-748.
Reatto, A., Silva, E. M., Bruand, A., Martins, E. S. & Lima, J. E. F. 2008b. Validity of the centrifuge method for determining the water retention properties of tropical soils. Soil
Science Society American Journal, 72(6), 1547-1553.
Reatto, A., Bruand, A., Martins, E. S., Muller, F., Silva, E. M., Carvalho Jr, O. A., Brossard, M. & Richard, G. 2009. Development and origin of the microgranular structure in latosols of the Brazilian Central Plateau: Significance of texture, mineralogy, and biological activity. Catena, 76, 122-134.
Schaefer, C. E. G. R., Fabris, J. D. & Ker, J. C. 2008. Minerals in the clay fraction of Brazilian latosols (Oxisols): a review. Clay Minerals, 43, 1-18.
Silva, E.M. & Azevedo, J.A.. 2001. Período de centrifugação adequado para levantamento da curva de retenção da água em solos do Bioma Cerrado. B.P. Embrapa Cerrados, 8, 1-40.
Silva, A.V., Farias, M.F., Reatto A., Martins, E.S., Brossard, M., Becquer, T. & Oliveira, O.R. 2005. Caracterização e distribuição das principais classes pedológicas do Planalto Central Brasileiro. In: Anais do XXV Congresso Brasileiro de Ciência do Solo. SBCS, Recife-PE, Brasil. CD-ROM.
Soil Survey Staff. 2006. Keys to Soil Taxonomy. 8 ed. United States Department of Agriculture, Natural Resources Conservation Service, Washington.
Stoops, G. 1981. Micromorphology of the oxic horizon. In: Soil Micromorphology. Volume 2:
Soil Genesis. (Bullock, P. & Murphy, C. P., Eds.). A B Academic Publishers, pp.419-440.
Tawornpruek, S., Kheoruenromne, I., Suddhiprakarn, A. & Gilkes, R. J. Microstructure and water retention of Oxisols in Thailand. 2005. Australian Journal of Soil Research, 43, 973-986.
Tessier, D. 1984. Etude expérimentale de l’organisation des matériaux argileux :
hydratation, gonflement et structuration au cours de la dessiccation et de la réhumectation. Thèse d’Etat, Université Paris 7.
Viana, J. H. M., Fernandes Filho, E. I. & Schaefer, C. E.G.R. 2004. Efeitos de ciclos de umedecimento e secagem na reorganização da estrutura microgranular de Latossolos.
Revista Brasileira de Ciência do Solo, 28, 11-19.
Volland-Tuduri, N., Brossard, M., Bruand, A. & Garreau, H. 2004. Direct analysis of microaggregates shrinkage for drying: Application to microaggregates from a Brazilian clayed Ferralsol. Comptes Rendus de l’Académie des Sciences, 336, 1017–1024.
Volland-Tuduri, N., Bruand, A., Brossard, M., Balbino L. C., Oliveira, M. I. L. & Martins, E. S. 2005. Mass proportion of migroaggregates and bulky density in a Brazilian clayed Oxisol. Soil Science Society American Journal, 69, 1559–1564.
1
Tables
2
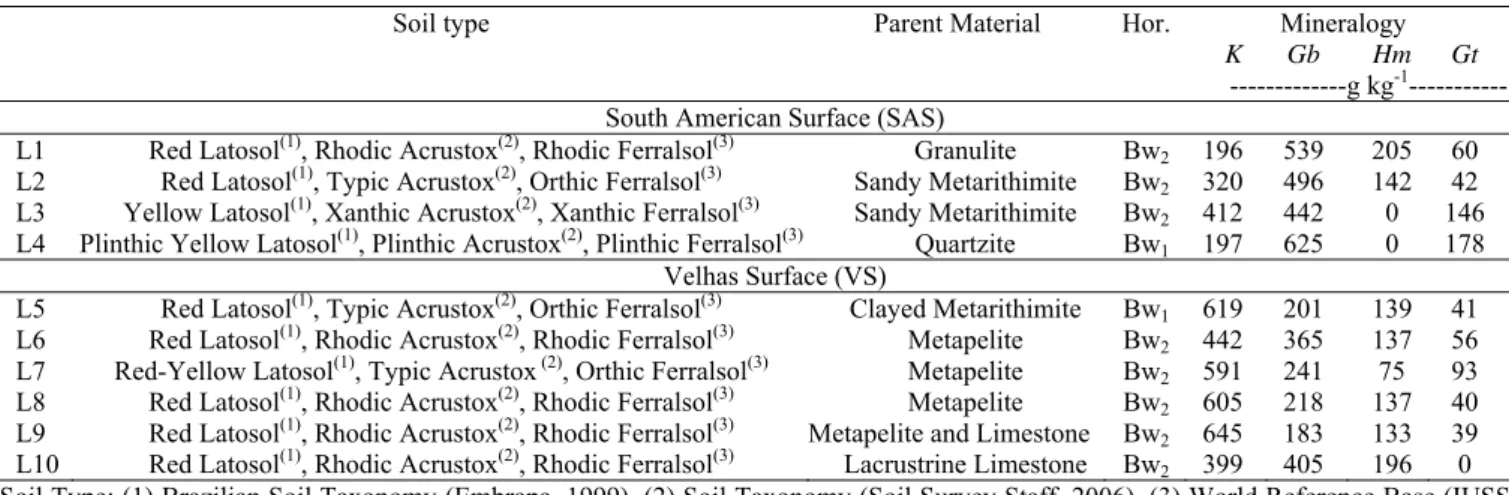
Table 1 Main characteristics of the diagnostic horizons (Bw) of the Latosols (L) studied
3
(modified after Reatto et al., 2007, 2009) 4
5
Table 2 Physico-chemical characteristics of the diagnostic horizons (Bw) of the Latosols (L) 6
studied 7
8
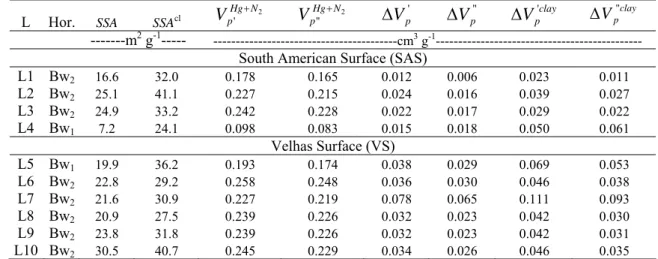
Table 3 Specific surface area (SSA), Specific surface area of the clay fraction (SSAcl),
9
accumulated pore volume of dried microaggregates at – 300 kPa ( 2
' N Hg p V + ), accumulated pore 10
volume of dried microaggregates at – 1500 kPa ( 2
''
N Hg p
V + ), decrease in the pore volume 11
between – 300 kPa and drying at 105°C ( '
p
V
Δ ) and relative to the clay fraction 12
( clay p
V'
Δ ),decrease in the pore volume between – 1500 kPa and drying at 105°C ( ''
p
V
Δ ) and 13
relative to the clay fraction ( clay p
V ''
Δ ) in the Bw horizons of the Latosols (L) studied. 14
Figures
16 17
Figure 1 Bulk density according to the clay content of the diagnostic horizons (Bw) of the
18
Latosols (L) studied. 19
20
Figure 2 Specific surface area (SSA) of the diagnostic horizons (Bw) of the Latosols (L)
21
studied (*P=0.05, significant at p>0.05 level of probability). 22
23
Figure 3 Observations in transmission electron microscopy of the fine material of the
24
Latosols (L) studied: horizons Bw of L2 (a), L5 (b), L6 (c), and L8 (d). 25
26
Figure 4 Gravimetric water content at – 1500kPa (W1500) (a), and gravimetric water content at
27
– 300kPa (W300) according to the clay content (b). (**P=0.01, significant at p>0.01 level of
28
probability) 29
30
Figure 5 Accumulated pore volume (V) expressed in cm3 g-1, obtained by combining N2
31
desorption ( ) and Hg intrusion ( ) measurements, and derivate curve (dV/dlogDe) 32
( ) expressed in cm3 g-1 µm-1, according to the equivalent pore diameter (De) for the 33
Latosols (L) studied. 34
35 36
37
Table 1 Main characteristics of the diagnostic horizons (Bw) of the Latosols (L) studied (modified after
38
Reatto et al., 2007, 2009) 39
Soil type Parent Material Hor. Mineralogy
K Gb Hm Gt
---g kg-1
---South American Surface (SAS)
L1 Red Latosol(1), Rhodic Acrustox(2), Rhodic Ferralsol(3) Granulite Bw
2 196 539 205 60
L2 Red Latosol(1), Typic Acrustox(2), Orthic Ferralsol(3) Sandy Metarithimite Bw
2 320 496 142 42
L3 Yellow Latosol(1), Xanthic Acrustox(2), Xanthic Ferralsol(3) Sandy Metarithimite Bw
2 412 442 0 146
L4 Plinthic Yellow Latosol(1), Plinthic Acrustox(2), Plinthic Ferralsol(3) Quartzite Bw
1 197 625 0 178
Velhas Surface (VS)
L5 Red Latosol(1), Typic Acrustox(2), Orthic Ferralsol(3) Clayed Metarithimite Bw
1 619 201 139 41
L6 Red Latosol(1), Rhodic Acrustox(2), Rhodic Ferralsol(3) Metapelite Bw
2 442 365 137 56
L7 Red-Yellow Latosol(1), Typic Acrustox (2), Orthic Ferralsol(3) Metapelite Bw
2 591 241 75 93
L8 Red Latosol(1), Rhodic Acrustox(2), Rhodic Ferralsol(3) Metapelite Bw
2 605 218 137 40
L9 Red Latosol(1), Rhodic Acrustox(2), Rhodic Ferralsol(3) Metapelite and Limestone Bw
2 645 183 133 39
L10 Red Latosol(1), Rhodic Acrustox(2), Rhodic Ferralsol(3) Lacrustrine Limestone Bw
2 399 405 196 0
Soil Type: (1) Brazilian Soil Taxonomy (Embrapa, 1999), (2) Soil Taxonomy (Soil Survey Staff, 2006), (3) World Reference Base (IUSS
40 Working Group WRB, 2006). 41 42 43 44 45
Table 2 Physico-chemical characteristics of the diagnostic horizons 46
(Bw) of the Latosols (L) studied 47
Hor. Particle size distribution (µm) OC Db W300 W1500
<2 2-50 50-2000
---g kg-1--- g cm-3 ---g g-1
---South American Surface (SAS)
L1 Bw2 520 40 440 3.4 1.21 0.190 0.171 L2 Bw2 610 140 250 6.1 0.90 0.251 0.231 L3 Bw2 750 90 160 0.2 0.88 0.264 0.245 L4 Bw1 300 10 690 3.4 1.18 0.113 0.101 Velhas Surface (VS) L5 Bw1 550 150 300 6.2 1.03 0.230 0.203 L6 Bw2 780 90 130 0.2 0.83 0.294 0.278 L7 Bw2 700 140 160 5.9 0.96 0.305 0.284 L8 Bw2 760 70 170 6.1 0.98 0.271 0.249 L9 Bw2 750 80 170 0.1 1.06 0.271 0.249 L10 Bw2 750 70 180 0.2 0.88 0.280 0.255
Db = bulk density, W300 = gravimetric water content at –300 kPa, W1500 =
48
gravimetric water content at –1500 kPa. 49
50 51
52 53
Table 3 Specific surface area (SSA), Specific surface area of the clay fraction (SSAcl),
54
accumulated pore volume of dried microaggregates at – 300 kPa ( 2
' N Hg p V + ), accumulated 55
pore volume of dried microaggregates at – 1500 kPa ( 2
''
N Hg p
V + ), decrease in the pore 56
volume between – 300 kPa and drying at 105°C ( '
p
V
Δ ) and relative to the clay fraction 57
( clay p
V'
Δ ),decrease in the pore volume between – 1500 kPa and drying at 105°C ( ''
p
V Δ ) 58
and relative to the clay fraction ( clay p
V ''
Δ ) in the Bw horizons of the Latosols (L) studied. 59
60
L Hor. SSA SSAcl
2 ' N Hg p V + 2 '' N Hg p V + ΔVp' '' p V Δ clay p V' Δ clay p V '' Δ ---m2 g-1--- ---cm3 g-1---
South American Surface (SAS)
L1 Bw2 16.6 32.0 0.178 0.165 0.012 0.006 0.023 0.011 L2 Bw2 25.1 41.1 0.227 0.215 0.024 0.016 0.039 0.027 L3 Bw2 24.9 33.2 0.242 0.228 0.022 0.017 0.029 0.022 L4 Bw1 7.2 24.1 0.098 0.083 0.015 0.018 0.050 0.061 Velhas Surface (VS) L5 Bw1 19.9 36.2 0.193 0.174 0.038 0.029 0.069 0.053 L6 Bw2 22.8 29.2 0.258 0.248 0.036 0.030 0.046 0.038 L7 Bw2 21.6 30.9 0.227 0.219 0.078 0.065 0.111 0.093 L8 Bw2 20.9 27.5 0.239 0.226 0.032 0.023 0.042 0.030 L9 Bw2 23.8 31.8 0.239 0.226 0.032 0.023 0.042 0.031 L10 Bw2 30.5 40.7 0.245 0.229 0.034 0.026 0.046 0.035 61 62 63
64 65
Figure 1 Bulk density according to the clay content of the diagnostic horizons
66
(Bw) of the Latosols (L) studied. 67
68 69 70
71
Figure 2 Specific surface area (SSA) of the diagnostic horizons (Bw) of the
72
Latosols (L) studied (*P=0.05, significant at p>0.05 level of probability). 73
75
76 77
Figure 3 Observations in transmission electron microscopy of the fine material of the
78
Latosols (L) studied: horizons Bw of L2 (a), L5 (b), L6 (c), and L8 (d). 79
80 81 82
83
84
Figure 4 Gravimetric water content at – 300kPa (W-300) (a), and
85
gravimetric water content at – 1500kPa (W-1500) according to the clay
86
content (b). (**P=0.01, significant at p>0.01 level of probability). 87
88 89 90
93
Figure 5 Accumulated pore volume (V) expressed in cm3 g-1, obtained by combining N2 desorption ( ) and Hg intrusion ( ) 94
measurements, and derivate curve (dV/dlogD) ( ) expressed in cm3 g-1µm-1, according to the equivalent pore diameter (De) for the Latosols 95 (L) studied. 96 97 98 99