HAL Id: hal-01191104
https://hal.archives-ouvertes.fr/hal-01191104
Submitted on 28 May 2020HAL is a multi-disciplinary open access archive for the deposit and dissemination of sci-entific research documents, whether they are pub-lished or not. The documents may come from teaching and research institutions in France or abroad, or from public or private research centers.
L’archive ouverte pluridisciplinaire HAL, est destinée au dépôt et à la diffusion de documents scientifiques de niveau recherche, publiés ou non, émanant des établissements d’enseignement et de recherche français ou étrangers, des laboratoires publics ou privés.
to conservation: Pitfalls of community-based forest
management in Madagascar
Aurélie Toillier, Georges Serpantie, Dominique Hervé, Sylvie Lardon
To cite this version:
Aurélie Toillier, Georges Serpantie, Dominique Hervé, Sylvie Lardon. Livelihood strategies and land use changes in response to conservation: Pitfalls of community-based forest management in Madagascar. Journal of Sustainable Forestry, Taylor & Francis, 2011, 30 (1-2), pp.20-56. �10.1080/10549811003742357�. �hal-01191104�
PLEASE SCROLL DOWN FOR ARTICLE
On: 7 March 2011
Access details: Access Details: [subscription number 930815096] Publisher Taylor & Francis
Informa Ltd Registered in England and Wales Registered Number: 1072954 Registered office: Mortimer House, 37-41 Mortimer Street, London W1T 3JH, UK
Journal of Sustainable Forestry
Publication details, including instructions for authors and subscription information: http://www.informaworld.com/smpp/title~content=t792306917
Livelihood Strategies and Land Use Changes in Response to Conservation:
Pitfalls of Community-Based Forest Management in Madagascar
Aurélie Toillierabc; Georges Serpantiéb; Dominique Hervéb; Sylvie Lardonc
a Institut de Recherche pour le Développement (IRD), Antananarivo, Madagascar b Institut de Recherche pour le Développement (IRD), Montpellier, France c Institut National de la Recherche Agronomique (INRA)/AgroParisTech-ENGREF, Aubière, France
Online publication date: 18 January 2011
To cite this Article Toillier, Aurélie , Serpantié, Georges , Hervé, Dominique and Lardon, Sylvie(2011) 'Livelihood Strategies and Land Use Changes in Response to Conservation: Pitfalls of Community-Based Forest Management in Madagascar', Journal of Sustainable Forestry, 30: 1, 20 — 56
To link to this Article: DOI: 10.1080/10549811003742357
URL: http://dx.doi.org/10.1080/10549811003742357
Full terms and conditions of use: http://www.informaworld.com/terms-and-conditions-of-access.pdf This article may be used for research, teaching and private study purposes. Any substantial or systematic reproduction, re-distribution, re-selling, loan or sub-licensing, systematic supply or distribution in any form to anyone is expressly forbidden.
The publisher does not give any warranty express or implied or make any representation that the contents will be complete or accurate or up to date. The accuracy of any instructions, formulae and drug doses should be independently verified with primary sources. The publisher shall not be liable for any loss, actions, claims, proceedings, demand or costs or damages whatsoever or howsoever caused arising directly or indirectly in connection with or arising out of the use of this material.
Copyright © Taylor & Francis Group, LLC ISSN: 1054-9811 print/1540-756X online DOI: 10.1080/10549811003742357
Livelihood Strategies and Land Use Changes
in Response to Conservation: Pitfalls
of Community-Based Forest Management
in Madagascar
AURÉLIE TOILLIER1,2,3, GEORGES SERPANTIÉ2, DOMINIQUE HERVÉ2, and SYLVIE LARDON3
1Institut de Recherche pour le Développement (IRD), Antananarivo, Madagascar 2Institut de Recherche pour le Développement (IRD), Montpellier, France 3Institut National de la Recherche Agronomique (INRA)/AgroParisTech-ENGREF,
Aubière, France
Faced with the low success rates of protected areas in conserving natural forests and supporting rural development, the Malagasy government recently chose to transfer forest resource manage-ment to local communities. Feedback about the implemanage-mentation of this new policy suggests that agriculture continues to drive deforestation. This article explores farmers’ household livelihood strategies and land use changes in response to changing forest access rules arising from community-based land management. Based on studying in-depth surveys and participatory mapping in the eastern rain forest highlands, we outline patterns in farmers’ responses, exploring the relationship between sociodemographic factors, livelihood strategies, and patterns of land use. Our find-ings suggest that heterogeneity in farmers’ adaptation capacities is closely related to different land use patterns. Furthermore, both conservation and agricultural sustainability have suffered from unintended impacts: an increase of forest clearing, intensification
This article was initially presented at “Conservation and the Agricultural Frontier: Integrating Forests and Agriculture in the Tropics,” a conference organized by the Yale University Chapter of the International Society of Tropical Foresters on April 7–8, 2006 at the Yale School of Forestry and Environmental Studies in New Haven, Connecticut, USA.
Address correspondence to Aurélie Toillier, INRA/AgroParisTech-ENGREF, UMR Metafort,
Domaine des Cézeaux, BP 90054, 24 Avenue des Landais, 63171 Aubière Cedex 9, France. E-mail: aurelie.toillier@gmail.com
20
in cultivated area, and an impoverishment of the poorest house-holds. These detailed reviews of household adaptation processes suggest that the zoning-based management scheme would benefit from incorporating a more detailed farm level land use approach. Land use patterns have the potential to inform the design of improved conservation–development initiatives by revealing strate-gic indicators that could allow practitioners to target households for conservation measures according to their adaption capacities. KEYWORDS adaptation capacity, community-based forest man-agement, conservation, Fianarantsoa, forest corridor, land use changes, land use planning, livelihood strategies, Madagascar
INTRODUCTION
In inhabited tropical forests, rural development and the involvement of the local population have become objectives inextricable from curbing defor-estation (Kant, 1997; Rodary, Castellanet, & Rossi, 2003). Community-based forest management has been posed as a solution to cope with the limited capacity of national institutions to achieve such objectives in developing countries (Peters, 1997; Agrawal, 2001). The transfer of forest management aims at reinforcing the local management capacities of forest users through their own efforts and their acceptance of both benefits and responsibilities. Despite massive financial investment and effort to promote this approach, results to date have been disappointing, not only for nongovernmental orga-nizations (NGOs), conservationists, and donors but also for the local people whose lives are most directly affected by such initiatives. Evaluations show wide variability in effectiveness, and also bring to light unintended factors such as the resistance of local populations and continued deforestation. Evidence emerging from many parts of the world suggests that the con-version of forests to agricultural fields will continue as long as it makes sense for rural livelihoods, given the incentive and constraints farmers face, regardless of the costs to the larger community (Vosti & Witcover, 1996).
Much of the recent work concerning community-based forest man-agement has focused on the “community” (Agrawal & Gibson, 1999), management institutions, the underlying motives behind such projects (Leach, Mearns, & Scoones, 1999; Muttenzer, 2001), and the disparate forms of participation and empowerment that are evolving within these initiatives (Peters, 1997; Michener, 1998). In our opinion, the key failure of this kind of integrated conservation–development initiative lies in its founding on a limited understanding of two primary processes: livelihood heterogeneity among forest people and their adaptation of farming systems to cope with changing environmental, economic, and political conditions. Household
adaptation capacities should be better taken into account in community-based forest management approaches that specifically highlight working with people, rather than adopting donor-prescribed solutions to poverty and sustainable livelihood issues.
Although conceptual debates on livelihood analysis now recognize that, even within the same community, households vary considerably in the degree and manner that they incorporate forest resources into their livelihoods (Kant, 1997; Agrawal & Gibson, 1999; Bahuguna, 2000; Barrett, Reardon, & Webb, 2001; Coomes & Burt, 2001; Godoy, 2001; McSweeney, 2002; Ambrose-Oji, 2003), most NGOs follow the logic that all households depend heavily upon forest resources, and that cash income from forest products is the primary indicator of household welfare (Coomes, Barham, & Takasaki, 2004). Attempts are therefore being made to encourage agricul-tural diversification and intensification in order to both increase household income and reduce forest dependency. However, these approaches pay little attention to the dynamics of livelihood and land use changes. In some areas, alternatives to forest clearing, such as agroforestry or integrated cattle breed-ing and farmbreed-ing, are bebreed-ing practiced. In other areas, traditional subsistence systems based on shifting cultivation are still dominant despite incentives from NGOs. The factors that lead farmers to adopt sedentary agriculture and to use land intensively rather than extensively are still not fully understood (Brady, 1996; Pagiola & Holden, 2001).
This article focuses on household livelihood strategies and land use changes in response to changing forest access rules arising from community-based approaches. A deeper insight into changes that such projects may cause, either deliberately or unintentionally, should reinforce understand-ing about household adaptation capacities and integrated conservation– development pathways. In this analysis, we test a hypothesis that available land use options and livelihood strategies condition farmer’s adaptation capacities. Based on a case study in the eastern rain forest of Madagascar, this article provides a detailed examination of household adaptation processes and subsequent land use changes in the context of a new community-based forest management policy under the Gestion Locale Sécurisée (GELOSE) law voted in 1996.
First, we present our conceptual framework built on recent studies of livelihood strategies and land use decisions on the agricultural frontier. We then examine the history of resource use in the Fianarantsoa region (the southeastern highlands of Madagascar) and the changes in forest and land access rules induced by the new community-based approach. This provides the context for livelihood analysis using empirical research focusing on land use changes at the farm and village territory levels in the case study based on data collected in 2004–2007. Finally, the article closes with a discussion of the broader importance of focusing on farmers’ land use behavior in order to improve community-based approaches to integrated conservation and
development. On a theoretical level, the present article investigates the role for spatial approaches based on land use patterns in providing important information on livelihood heterogeneity to development professionals.
THEORETICAL FRAMEWORK: LIVELIHOOD STRATEGIES AND ADAPTATION TO STRESSORS ON THE AGRICULTURAL FRONTIER
In order to explore the links between livelihood adaptation processes and land use changes under a new conservation policy, we built a theoretical framework based on a literature review.
The concept of livelihood describes individuals, households, or groups making a living; attempting to meet a variety of consumption and economic necessities; coping with uncertainties; and responding to new opportunities (de Haan & Zoomers, 2003). Some of the earlier approaches in livelihood studies regarded “poor” farmers in the tropics as passive victims. However, since the 1990s it has been recognized that farmers do react to environmen-tal change for their own survival. They have been adapting their farming and natural resource management systems to suit changing conditions for centuries (Mazoyer & Roudart, 1997). In this vein, Chambers (1994) sug-gested that a livelihood is sustainable when it can cope with and recover from stresses and shocks, and maintain or enhance its capabilities, assets, and entitlements, while not undermining the natural resource base.
In the tropics, numerous stresses including increasingly severe climatic conditions, put pressure on livelihoods (Turner et al., 2003). These stresses can include cyclic fluctuations in resource abundance, followed by annual lean periods; annual climatic disasters (e.g., cyclones); population growth; cultural changes (including a decline in traditional religions and authority figures); and economic hardship (Brady, 1996). A shock is a major peak in pressure beyond the normal range of variability in which households operate, such as a drought or a political crisis.
In response to those perturbations, there are two categories of liveli-hood strategies: short-term coping strategies and long-term adaptive strate-gies. Coping strategies are often an immediate reaction to a quick change. Adaptive strategies correspond to livelihood changes in the long-term in response to a stress or a persistent shock. Coping and adaptive strategies are reactive and proactive “decisions” by households for reducing risk and maintaining or enhancing their livelihood options by adjusting their lives. The implementation of a new conservation policy, inducing new govern-ment sponsored land use patterns and changes in forest access rules, is taking place very quickly and creates several perturbations that will impact livelihoods in the long-term.
In the context of agricultural frontier, Albaladejo and Duvernoy (2000) identified three generic processes of adaptation to changing conditions:
(a) the household ignores the perturbation and doesn’t change its liveli-hood strategy; (b) the household takes into account the perturbation and seeks a compromise allowing it to partially conserve its pre-existing liveli-hood (evolution); and (c) the household integrates the perturbation into its livelihood, reorganizes its activities, and then anticipates possible changes (transformation). These authors identify four main determinants driving household behavior: land tenure, household labor, production objectives, and commercialization opportunities. These may or may not induce land use changes.
We base our analyses of land use changes on Scoones (1998), who suggested that the available options for rural people belong to three broad
clusters: (a) agricultural intensification/extensification, in which more
out-put per unit area is obtained through capital or labor investment, or bringing more land under cultivation; (b) diversification of income sources, including, but not confined to, coping strategies; and (c) migration. Land use deci-sions are strongly conditioned by household asset holding (Reardon & Vosti, 1995; Dercon, 1998), household demographics (Walker, Perz, Caldas, & Silva, 2002), and geographically specific environmental endowments (Takasaki, Barham, & Coomes, 2001). Household assets comprise all the physical assets (i.e., land, equipment, and tools) and nonphysical assets (i.e., human, finan-cial, and social capital) that provide the basis for specific resource use. The influence of asset holdings on land use decisions is conditioned by house-hold demographics (i.e., the age, size, and composition of the househouse-hold) following Chayanov (1925), via the availability of household labor, con-sumption demand, risk aversion in the absence of insurance instruments, and investment preferences. Abizaid and Coomes (2004) showed that differ-ent land use decisions in the context of shifting cultivation were related to specific households factors (e.g., differences in access to land and labor, age of the household head, spatial organization of holdings), as well as external factors (government land use policy).
Although it is clear that land use options and household characteris-tics affect adaptation capacities and land use decisions, the conditions that allow farmers to switch over to activities that support conservation without threatening agricultural sustainability remain unclear. Based on the concep-tual framework presented on Figure 1, this study aims at filling this gap by examining the role of social, economic, and historical factors in shaping farmers’ adaptations to conservation measures.
THE CASE STUDY Study Site and People
The eastern rain forests of Madagascar are restricted to a narrow strip run-ning north–south along the eastern escarpment between the Indian Ocean
FIGURE 1 Conceptual framework of adaptation process and land use changes in response
to conservation (HH: Household).
coastline (200 m above sea level) and the island’s central highlands (1,200 m above sea level). In the Fianarantsoa region, a corridor of forest connecting the national parks of Ranomafana and Andringitra is now only 10 km in width and mainly located in the highlands (Figure 2). These are the rem-nants of a vast forest stretching to the East coast before the arrival of man (Green & Sussman, 1990). Demographic growth on both sides of the forest has led to a multitude of human-induced pressures, including deforestation and biodiversity loss. The integrity of this forest, considered as a “corridor” since it connects several national parks, is under threat.
The study site is located in the highlands in the southwestern area of the periphery of Ranomafana National Park (Figure 2). On the western fringe of the forest corridor, the Betsileo, who are traditionally sedentary farmers, have been settled for more than a century. Agriculture is the main source of livelihood for these people, who mainly cultivate irrigated rice in association with cattle breeding and rain-fed crops. Cash crops are almost nonexistent and off-farm opportunities are very limited. Land tenure operates under a local system, and despite the absence of official land tenure rights, farmland is organized under clearly identified individual ownership.
FIGURE 2 Location of the study site: The Fokontany of Iambara in the southwestern area
of the periphery of Ranomafana National Park (sources: BD 500, 1994 FTM; author’s own elaboration).
Because of the hilly landscape, the local population organizes agricul-tural lands into three categories: valley-bottom lands, sloping lands, and hilltop lands. Marshlands in valley-bottoms are suitable for irrigated rice and market gardening (tomato, salad, and potato) but their conversion into rice fields requires several costly operations (i.e., drainage, dikes, leveling). Silty soils make them difficult to drain and thus the area is subject to annual flooding. Supplementary food crops such as cassava, sweet potato, and taro are grown on sloping lands. Specific areas, downslope from cattle pens near housing areas, are cultivated with fertility-demanding crops such as sugar cane and banana and used also as orchards. The soils on the hill slopes are hard and strongly acidic due to erosion. Flat hilltops are considered to be suitable only for nonarable land uses, like tree planting (mainly Eucalyptus) and pasture.
Eucalyptus wood is used for house, furniture building, and fuel. Some
families living near the forest use both agricultural territories around their villages and forest territories on a seasonal basis. Forest resources pro-vide safety by assisting household subsistence in times of hardship, such as changes in the economic, social, or climatic conditions. Forest products are very diverse, ranging from raw materials for farming, housing, and hand-icrafts to plants for weaving straw mats, baskets, and clothing for fermenting artisanal rum or for medicinal uses. A few farmers specialize in the manu-facture of wooden spade handles, which are sold throughout the province
of Fianarantsoa via nearby markets. This production contributes a third of their annual income.
The traditional Betsileo agricultural system is not based on shifting cul-tivation, usually described in Madagascar as “a continuous system in which temporary fields are cleared, usually burned, and subsequently cropped for fewer years than they are fallowed” (Jarosz, 1993, p. 368). In their current land use, “slash-and-burn” technique is used for three purposes. First, it is used as an economical way to clear land around rice fields in many land use transformations which require complete forest clearing, followed by other long-term land use that does not revert to bush-fallow and subsequent cycles of slash-and-burn. Second, it is sometimes used in order to create temporary fields when food production is insufficient in the savannah. In this case, forests are cleared and subsequently cropped for 1 or 2 yr with maize and beans before being fallowed for many years, eventually returning to native succession. Such fields are usually hidden in remote areas in order to avoid authority control. And lastly, it is used to exhibit the ownership of forest around uncultivated but privately owned marshlands. As a consequence, the processes of deforestation mainly rest on the processes of conversion of marshlands into rice fields.
Historical Resource Use and Colonization Trends
The regression of the forest fringe was insignificant during the 20th cen-tury but the fragmentation of the forest corridor has been accelerating since the 1990s, drawing the concern of national and international conservation agencies.
At the beginning of the 20th century, agricultural activity into the forest was much more intensive than at present. The majority of farmers used the forest for extensive cattle breeding, using fire to widen rare natural clear-ings, and subsequently dividing the ownership of those clearings among the main local kinship lineages. Semi-wild herds of zebus were protected from cattle stealers (Moreau, 2002). Since the forest was closer to the vil-lages, all families extracted subsistence items, particularly fuelwood. Honey, crayfish, and yams supplemented diets during the lean period, and sloping lands in the savannah were underutilized. Sometimes animals such as birds or wild boars were hunted. However, the forest remained a hostile environ-ment for the Betsileo farming systems because of its permanent moisture
(annual rainfalls from 1500–3000 mm/yr), frequent fogs, limited light, and
peaty marshlands in narrow valley-bottoms (Serpantié & Toillier, 2007a). Moreover, people feared wild animals and the spirits of ancestors living in the forest. The forest was a marginal area to hide in during moments of political or social unrest (Moreau).
In the early stages of colonization (around 1920) villages were estab-lished within the forest corridor to exploit gold mines and high-value wood.
In spite of isolation and difficult living conditions, some of those settle-ments grew and extended their territory along the valley-bottoms. Under these circumstances, the Betsileo adapted their farming system: They com-bined shifting cultivation of corn and beans using slash-and-burn practices on the forested hill slopes with permanent agricultural lands around rice fields. During this period, their reliance on rice field production was limited. In 1940, the savannah area bordering the corridor was still under-utilized, with less than a half of valley-bottoms converted into rice fields (Serpantié & Toillier, 2007a). However, the agents of the Ministry of Water and Forest Resources encouraged people to settle outside the forest corridor in order to increase rice fields in the savannah. Between 1960 and 1975, a policy of afforestation for wood production, which was initiated before independence, was reinforced under the first Malagasy Republic. National pine plantations were installed in village territories on pastures and the upper third of hill-slope lands. In exchange, some forest lands were officially given to inhabitants settled in savannah for permanent agricultural uses. These sites, called “périmètre de culture” or granted cultivation areas, were located near villages around valley-bottoms. At this time, slash-and-burn cul-tivation remained prohibited outside this area. Authorities’ monitoring and enforcement were effective.
After political changes in the 1970s, government-sponsored patterns of land use changed again. The government urged the development of fields in all uncultivated valley-bottoms. Monitoring and enforcement of forest access regulations became rare and flexible. The population continued to
increase, reaching the level of 65 inhabitants/km in 1993. All valley-bottoms
in the savannah were occupied by the late 1980s. While the creation of Ranomafana National Park in 1991 stalled the progression of forest village inhabitants along valleys to the north, the inhabitants of the savannah contin-ued to extend rice fields eastward in the forest corridor beyond the limits of the granted cultivation area. Some also practiced widespread slash-and-burn in forested slopes to supplement irrigated rice production on insufficient valley-bottom landholdings.
Changing Forest Access Rules Under Community-Based Management Contract
Due to above discussed historical factors, the western part of the forest corridor has been undergoing two processes of colonization: one due to new settlements of migrants in valley-bottoms within the corridor, and the other due to the extension of agriculture by local people already settled on western fringes.
Given the low success of the national forest service in regulating for-est access, international and national environmental agencies decided to transfer forest management to local populations. Programs began in 1996
under the GELOSE Law which led to the Gestion contractualisée des Forêts (GCF) decree, applied since 2001. Based on conservation principles, for-est rfor-estoration, and sustainable timber harvfor-esting, zoning-based plans for forest management have been developed in village territories. The state del-egates management rights (but not tenure rights) with conservation goals to a legally recognized local community institution (Communauté de base or COBA; DIREEF, 2002). The contract is signed between the Forest and Water Resources Service and the COBA, which must demonstrate its capacity for sound environmental management of the site during an initial 3-yr contract. A subsequent 10-yr period of continued effective management should be authorized after an official evaluation which offers the possibility for the subscribers to revise the rules.
A nongovernmental organization or an international agency is also des-ignated to support the contracting process. This organization also helps define the management site and forest access rules via participatory work-shops with the local population and forest service agents. If funding is sufficient, they provide facilities which could encourage and accelerate the adaptation process of local resource management and farming sys-tems. However, as yet, any official contract evaluation has been done in the Fianarantsoa forest region due to the ongoing reorganization of the Ministry of Forest and Water Resources in the broader context of the national decentralization movement. Contracts have been tacitly renewed without any modification.
In the study area, the main interventions for development and conser-vation were led by a project of the United State Agency for International Development (USAID). USAID undertook the implementation of transfer
de gestion contracts in this area from 1998 onward. Sites designated to be
transferred have been chosen within the fokontany, the smallest administra-tive unit in Madagascar. The Fokontany of Iambara is located on the forest fringe (Figure 2) and consists of 17 villages, accounting for 1,144 inhabitants and 230 households in 2004 (personal census) with an annual population growth of 2.4%. The transfer of management contract was signed in 2003 after a 5-yr public awareness campaign. In 2003, the COBA was composed of 235 members distributed among 13 villages located both in the savan-nah and the forest. The majority belonged to the village of Ambendrana (Figure 3), where most of the farmers who specialized in the spade handle production resided.
GCF regulations were mostly suggested by the Forest Service and the USAID agents. As they considered this 3-yr contract a first trial, only a part of the forest of the Fokontany of Iambara has been transferred (Figure 3). The extraction of forest resources for commercial activities has been totally forbidden, despite the fact that economic exploitation of these resources by the local population was written into the GCF decree. Spade handle production has been deemed unsustainable with respect to conservation
FIGURE 3 GCF zoning plan and landscape evolution in the study site (Fokontany of Iambara)
between 1954 and 2004: Forest and pine plantations (source: author’s own interpretation of aerial photograph 1954 FTM, forest service maps 1970, BD 500 FTM 1994 and SPOT image 10m, 2004).
goals, although no scientific studies have demonstrated this. The extension of the site over the rest of the forest included in the fokontany, and the locals’ rights to benefit from forest exploitation is supposed to be considered after the evaluation of the 3-yr contract, which has not been done yet.
All the woody fallows of 8 yr of age or older has been included in the conservation area in order to be protected from agricultural exploitation, including those located in the cultivation area granted by the Forest Service in the 1970s. The total area covers 1,495 ha. Extraction of wood items for subsistence use is permitted in a small area (45 ha) in the southern part of the GCF area (Figure 3). The location is supposed to change every 3 yr in order to avoid overexploitation, but this has not been done yet. Forest clearing is forbidden, with the exception of a 25-m strip on either side of rice fields. Firebreaks around fields are compulsory. Crayfish may be collected in limited quantities and only during specific periods in the year. Bushfires are totally forbidden except every 3 yr after approval by the Forest Service. For all above-mentioned harvesting processes, authorization must be conceded by the president of the COBA, and dues must be paid. Although migrants are excluded, non-members of the COBA may receive authorization, but dues are higher. Violation of the regulations incurs a fine.
Development support from USAID consists mainly of standard tech-nologies for intensive irrigated rice systems, fertilizer production, and the promotion of pisciculture associated with rice fields. Adoption rates remain low (Serpantié & Toillier, 2007b).
Data Collection
So as to generate a representative sample of the diversity of livelihood and land use strategies, we first aimed to identify zones where settlement history and land use options for farmers were similar. To this end, we superimposed a variety of geographical data using a GIS (Figure 3). These data were cho-sen as a function of the historical colonization trends at the territory level described previously: (a) location of the authorized cultivation areas (about 120 ha), national park boundaries, and GCF zoning plans; (b) distance of villages to the forest; and (c) land-cover changes concerning pine planta-tions, natural forest, and rice fields. They were identified by analysis of records of the National Forestry Service, topographical maps, aerial pho-tographs (1957, 1991), and a satellite image (image SPOT 5, 10-m resolution, March 2004, copyright CNES 2004, distribution Spot Image S.A. program ISIS).
Within each zone, we made an inventory of households who cultivated lands in the forest and collected forest resources before GCF implemen-tation. For our purposes, a household is identified as a group of family members who eat together, jointly cultivate fields, and keep the harvest in common granary. We chose two or three households per settlement; i.e., per valley since settlements are always located in valley-bottoms. We used the age of the head of the household as an indicator of farm diversity since the stage of family cycle (beginning, growth, maturity, and retirement) is decisive in the means of production and objectives of the farm. A set of 33 house-holds was designed, representing 20% of farms affected by conservation measures in the Fokontany of Iambara.
The household survey was divided into three parts. The first part, com-posed of structured questions, aimed to characterize the household structure, its history of settlement, its farming system (crops, livestock), and main sources of income. The second section of the survey focused on land use changes, combining field observations and semi-structured questions. We first described the farmland, which we considered to be the set of fields belonging to the household. Each field is a continuous spatial management unit which coincides with a landscape category. This part of the survey was based primarily on participatory mapping techniques. During visits to the fields with one or several household members, each field was identified on
an aerial photograph (1991) and/or located with Global Positioning System
(GPS) equipment. The questions dealt with the history of the farmland devel-opment, its past and present uses, and the reasons for each change in land use strategies. Specific observations about agricultural practices adopted after GCF implementation were also made. The third part of the survey, based on open-ended questions, dealt with farmers’ perceptions of benefits and constraints resulting from conservation measures, and the impacts of these measures on their livelihood strategy.
This research protocol was pretested and revised so as to find the best way to fully understand the motives for change, especially changes related to new conservation measures. In order to prevent the household from mak-ing systematic links with the GCF measures, this issue was raised only at the end of the visit through direct questions; the historical approaches of house-hold settlement, farmland constitution, and land uses helped to understand livelihood change trajectory pre-GCF and to independently identify changes that could be linked to GCF implementation. During inquiries, attention was given to any determinant of land use and livelihood change which farmers mentioned. The third part of the survey enabled us to cross-check farmers’ perception of GCF impacts on their livelihoods with our field observations and data analysis. The amount of time and the diversity of methods that we used with each household allowed us to make a detailed qualitative assessment in order to clarify the quantitative data and to obtain a holistic understanding of land use changes.
Data Analysis
In order to characterize, classify, and compare livelihood strategies and land use patterns responding to GCF implementation, our analysis was developed in three stages:
1. a typology of livelihood strategies and associated land use patterns pre-GCF (Table 1);
2. an identification of changes and adaptation processes for each type of
“livelihood strategy/land use pattern” in response to GCF
implementa-tion, and the consequences in terms of household welfare and land use changes at farm level;
3. a representation of land use changes induced at regional scale and their consequences in term of forest conservation and land-management planning.
With a multiple correspondence analysis (MCA), we selected 16 vari-ables describing household livelihood strategy (Table 2) and 6 varivari-ables related to land use pattern (Table 3). K-means clustering was applied to group observations and elaborate the typology (Table 1). The family struc-ture (i.e., age and gender of family members, as well as the number of children in school) was used to define household life cycle. We also used these factors to generate a household consumption indicator (consumption unit or UC) and a labor force indicator (per person labor unit or UTH), both
related to the age and gender of family members. A UTH/UC ratio close to
1 indicates that the labor force of the household is adequate to provide for the family. The length of the lean period (i.e., the number of months when granaries are empty between two rice crops), the number of zebus and
TABLE 1 Livelihood Strategies and Land Use Patterns Pre-GCF
Land use pattern Livelihood strategy Total farms
(#)
Savannah farms (#) 4
12%
Type 1 Divided Medium farms recently settled
in the savannah with
inherited rice fields in Z1∗
and sloping lands in Z2∗.
High labor force, intensive agriculture on sloping lands with perennial crops (bananas, sugar cane), and diversification with animal and spade handle production.
4 12%
Mixed farms (#) 19
57%
Type 2 Scattered Large farms settled in
savannah expanding in Z3∗
along valley-bottoms. Extensive agriculture on sloping lands and intensive rice production associated with cattle breeding; short lean period; diversification of marketed products.
10 30%
Type 3 Split Young households from Z1
without enough inherited lands in Z1; tavy in Z2. Accumulation process based on selective off-farm employment, rum, and spade handle production.
9 27%
Forest farms (#) 10
30%
Type 4 Scattered Large farms in self-subsistence
settled in forest. Shifting cultivation on sloping lands; corn and bean production compensates for the low productivity of rice fields. Additional sales of forest products.
7 21%
Type 5 Grouped Small farms settled in forest
with a weak labor force and insufficient food production inducing a long lean period. Regular off-farm employment. 3 9% Total farms (#) 33 100%
Note.∗Z1: zone 1, savannah; Z2: zone 2, granted forest; Z3: zone 3, forest.
TA B L E 2 Household T ypes Pre-GCF a nd Indicators U sed (Mean, Min, M ax) HH types Savannah far m Mixed far ms Forest far m s Indicators T ype 1 T y pe 2 T ype 3 T y pe 4 T ype Percent o f far ms (T otal far ms #) 12% (4) 31% (10) 27% (9) 21% (7) 9% (3) HH demographics Age o f HH’s head (min; m ax) 43 (25; 60) 52 (38; 82) 34 (30; 39) 54 (43; 70) 41 (30; Y e ar established 1984 (1965; 2000) 1975 (1965; 1989) 1995 (1991; 2001) 1972 (1958; 1992) 1983 (1972; HH size (#) (min; m ax) 5.2 (3;8 ) 8.7 (4; 15) 7 (3; 9 ) 9.3 (3; 14) 6.7 (6; # o f children (Age < 16) (min; m ax) 1.3 (0;3 ) 5.3 (2;9 ) 4.3 (1;6 ) 5.7 (1; 10) 4.3 (3; # o f children in school (min; m ax) 0.3 (0;1 ) 2.9 (0;8 ) 2.2 (0;6 ) 2.4 (0;6 ) 2.3 (2; HH assets UTH ∗/UC ∗∗ (min; m ax) 0.84 (0.75; 1) 0.78 (0.63; 0.96) 0.74 (0.65; 0.9) 0.78 (0.7; 1 ) 0.73 (0.65; T otal far mland a rea (hectares) (min; m ax) 1.8 (0.9;2.7) 4 (1.6; 7 .6) 1.9 (0.5; 3 .5) 3.2 (2; 5 .4) 1.3 (1.1; Rice-field a rea (hectares) (min; m ax) 0.4 (0.1; 0 .9) 1 (0.1; 2 .2) 0.5 (0.1; 1 .2) 0.6 (0.3; 0 .8) 0.3 (0.2; Rice-field a rea /UTH (min; m ax) 0.2 (0; 0 .2) 0.2 (0.1; 0 .3) 0.2 (0; 0 .4) 0.1 (0.1; 0 .2) 0.1 (0; 0 Zebus (No = 0, Y e s = 1) (A verage # ) 1 (1) 1 (2.7) 01 (2.4) 0 34
Cropping system & labor allocation Length of the lean period (months) (min; m ax) 6 (5; 7 ) 4 (0; 6 ) 6 (2; 9 ) 8 (3; 11) (9; Use o f chemical fertilizer in rice fields Ye s Y e s N o Ye s Of f-far m employment Selective N o S elective No Regular Pig husbandry Y es No Y e s Y es Y Composition o f m arketed p roducts (SH: spade h andles) Animals, SH Cash crops, surplus o f crops, SH,
forest products, rum
Animals,
SH
Forest products, rum Forest products, animals
Share o f income contributed b y forest p roducts & S H 1/ 21 /33 /42 /31 Note. HH: household; ∗UTH: per household labor force indicator; ∗∗UC: household consumption unit. 35
TA B L E 3 Detailed Land U se Patter n Pre-GCF for Each T y pe of Household a nd Indicators U sed HH types Savannah far m Mixed far ms Forest far m s Land u se patter n s T ype 1 T y pe 2 T ype 3 T y pe 4 T ype A verage total # of fields (min; m ax) 7 (3; 9 ) 10 (3;18) 6 (4; 9 ) 8 (3; 13) 5 (2; Location of main residence ∗ Z1 Z1 Z1 Z3 Z3 A verage d istance o f fi elds to main residence (km) (min; m ax) 1.5 (1.5; 1 .6) 1.6 (0.8; 2 .3) 2 (1.4; 2 .6) 1 (0.1; 2 ) 0.6 (0.1; Distribution of fields w ithin zones A verage o f fi elds in Z1 ∗ (min; m ax) 3 (2; 6 ) 4 (0; 8 ) 1 (0; 2 ) 00 A verage # o f fi elds in Z2 ∗ (min; m ax) 4 (1; 7 ) 3 (0; 11) 2 (0; 6 ) 1 (0; 4 ) 1 (0; A verage # o f fi elds in Z3 ∗ (min; m ax) 03 (0; 6 ) 3 (2; 4 ) 7 (3; 13) 4 (2; V a lley-bottom land use & location Area (hectares) 0.4 1 .1 0.5 0 .8 0.4 Percent in fallows 3 2 4 5 3 3 2 2 7 Percent o f rice fi elds in Z1 90 58 22 0 0 Percent o f rice fi elds in Z2 7 1 0 1 1 4 18 Percent o f rice fi elds in Z3 0 8 14 64 55 Sloping land u se & location Area (hectares) 1.4 2 .9 1.4 2 .4 0.9 Percent o f w oody fallows 19 40 33 48 66 Percent o f h erbaceous fallows 11 8 7 0 0 Percent o f a nnual crops 65 44 45 50 44 Percent o f p erennial crops 5 8 1 5 2 0 Percent o f sloping lands in Z1 26 21 6 0 0 Percent o f sloping lands in Z2 74 51 32 15 20 Percent o f sloping lands in Z3 0 2 8 6 1 8 5 8 0 Note. HH: household; ∗Z1: zone 1, savannah; Z2: zone 2, granted forest; Z3: zone 3, forest. 36
pigs, and the area of rice fields were used as indicators of the household’s production capacity. In order to capture the diversity of cropping and labor allocation systems, we focused our attention on the proportion of area cul-tivated within the farmland, the use of fertilizers, off-farm employment, the diversification of marketed products, and the relative contribution of forest products and cash crops to the household’s income. Qualitative data were transformed into quantitative data through indexing for use in a correspon-dence analysis. Table 2 shows the variables used in the cluster analysis.
We recognize land use pattern as a function of six variables (Table 3): the number of fields, their location within land use zones, their distance from the main residence, field sizes, the nature of the landscape category they occupy, and their cover type (cultivated or fallowed). We distinguished perennial crops (bananas, sugar cane) from annual crops, and herbaceous fallows from woody fallows. These land-cover types are considered indicators of the level of agricultural intensification and environmental degradation.
We represented each combination of variables with a hand-designed graphic model. Each combination is represented by a specific symbol. Together, they produce a particular model for a given land use pat-tern (Figure 4). The graphic modeling method facilitates the identification
FIGURE 4 Graphic models of the land use pattern of each household type: (a) pre-GCF, (b)
post-GCF (type 1: divided savannah farm, type 2: scattered mixed farm, type 3: split mixed farm, type 4: scattered forest farm).
and the analysis of land use patterns (Lardon, Le Ber, Metzger, & Osty, 2005).
The changes resulting from conservation measures were subsequently described for each type of household. We then classified these as land use strategies and subsequent land-cover changes (Tables 4 and 5). The impacts in terms of household welfare were drawn from survey respondents’ own perceptions.
Our analysis of the consequences in terms of conservation and land management at a regional scale relied on land-cover evolution within each zone. The intent was not to precisely model ecological dynamics, but rather to deduce landscape evolution trends from the primary changes observed in farm-level patterns (Table 6).
RESULTS
Land Use Zones at Territorial Scale and Household Types Distribution
Based on the mapping process, evolution of land use pattern in the
Fokontany of Iambara is represented in Figure 3.
We identified three zones where settlement history and land use options for farmers were similar:
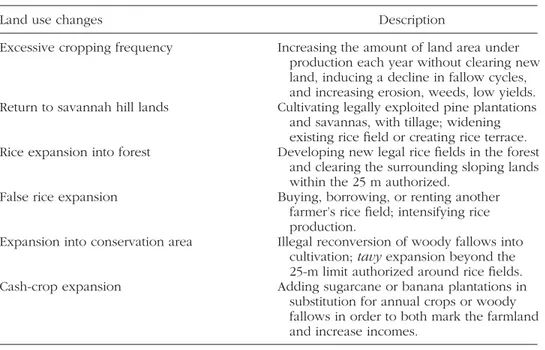
TABLE 4 Land Use Changes Identified
Land use changes Description
Excessive cropping frequency Increasing the amount of land area under
production each year without clearing new land, inducing a decline in fallow cycles, and increasing erosion, weeds, low yields.
Return to savannah hill lands Cultivating legally exploited pine plantations
and savannas, with tillage; widening existing rice field or creating rice terrace.
Rice expansion into forest Developing new legal rice fields in the forest
and clearing the surrounding sloping lands within the 25 m authorized.
False rice expansion Buying, borrowing, or renting another
farmer’s rice field; intensifying rice production.
Expansion into conservation area Illegal reconversion of woody fallows into
cultivation; tavy expansion beyond the 25-m limit authorized around rice fields.
Cash-crop expansion Adding sugarcane or banana plantations in
substitution for annual crops or woody fallows in order to both mark the farmland and increase incomes.
TABLE 5 Land Use Changes at the Farm Level in Response to Forest Conservation Measures
HH types
Savannah
farms Mixed farms Forest farms
Land use changes Total farms (#) Type 1 Type 2 Type 3 Type 4 Type 5
Total farms (#) 100% (33) 12% (4) 31% (10) 27% (9) 21% (7) 9% (3) Excessive cropping frequency 39% (13) 0 30% (3) 67% (6) 29% (2) 100% (3) Return to savannah hill lands 15% (5) 50% (2) 30% (3) 0 0 0 Rice expansion into forest 42% (14) 0 40% (4) 67% (6) 57% (4) 0 False rice expansion 15% (5) 50% (2) 20% (2) 11% (1) 0 0 Expansion into conservation area 15% (5) 0 20% (2) 33% (3) 0 0 Cash-crop expansion 45% (15) 25% (1) 40% (4) 56% (5) 57% (4) 67% (2)
TABLE 6 Land Use Changes at a Landscape Level: Patterns in Cultivated Area (Extension,
Decrease, or Stability) at the Farm Level
Land use zones Granted
Land use changes Savannah (Z1) forest (Z2) Forest (Z3)
Total farms owning lands within the zone (#) 21 29 27
Farms extending cultivated area 19% 34% 44%
(#) (4) (10) (12)
Extension in valley-bottoms & hill lands 0% 50% 100%
Extension in hill lands 100% 50% 0%
Farms exhibiting no change (stability) in cultivated area
71% 48% 44%
(#) (15) (14) (12)
Increase of the amount of land area under production each year
0% 29% 33%
Intensification 73% 0% 17%
Increase of cash crops 0% 36% 33%
Changes in hierarchy of crops 20% 14% 25%
No change 27% 29% 25%
● Zone 1: “Savannah,” where villages have been established for a century.
Pine, acacias and eucalyptus plantations, grasslands, and fields cover hill slopes. Ninety-five percent of the marshlands have been converted to rice fields. All of the lands in this zone have been brought into cultivation at least once, and consequently can be considered to be under household land tenure.
● Zone 2: The “granted forest,” which corresponds to the “périmètres de
cul-ture,” awarded as authorized cultivation area in the 1970s and the 1990s
by the Forest Service. It has been commonly shared among all villagers settled in the forest fringe. This zone is composed of a mosaic of for-est fragments, woody or herbaceous fallows, a few fields on hill slopes, and rice fields or marshlands in valley-bottoms. Agricultural exploitation is incomplete, but has been expanding for 30 yr. All of the forest fragments and woody fallows of 8 yr of age or older have been included in the conservation area in order to be protected from forest clearing practices.
● Zone 3: The “forest,” where clearing practices have always been
theoret-ically forbidden. Yet many rice fields have been developed in the last 10 yr. The majority of fallow marshlands are owned by inhabitants of the savannah or of established villages in the forest. Agricultural occupation based on shifting cultivation is extensive.
We identified five types of households (Table 1), whose farmlands are unequally distributed among the three land use zones (Figure 4).
Indicators used to describe livelihood strategies and land use pattern for each type are presented in Tables 2 and 3.
The origin of the household (from savannah or forest villages), the history of settlement, and the stage in the life cycle appeared to be important factors to understanding land tenure types and land use decisions. Data suggested that the chronological history of a household—from beginning to retirement, including associated processes of accumulation at each stage of the life cycle—has a spatial footprint common throughout the region.
Farm type 1 is composed of slightly capitalized medium-sized farms (total area of 1.8 ha, Table 2) settled in savannah villages. They own some zebus and small rice fields located in the savannah (zone 1). Households are made up of young couples with a few small children, or elderly peo-ple who are assisted by their children in rice field operations and caring
for grandchildren. These households are characterized by a UTH/UC ratio
close to 1 (0.84, Table 2). Their lean period is quite long (6 months, Table 2) because of the inadequacy of rice-field area, and despite the use of fertilizers. They compensate for the lack of rice production with other income sources. They practice intensive agriculture on sloping lands with perennial crops (bananas, sugar cane) associated with annual crops (bean, sweet potatoes, cassava), and they diversify marketed products with ani-mal production (pork and poultry) and spade handle production. They also practice selective off-farm employment due to the insufficiency of farm production.
Type 1 household farmlands are divided between the savannah (zone 1), where rice fields are located, and the granted forest (zone 2), where sloping lands are cultivated with annual and perennial crops
(Table 3). Because of erosion induced by numerous cycles of cultivation, ter-races have been built. Young households which are recently settled (around the yr 2000), had inherited all of their lands, which explains the divided structure of their farmland; many rice fields of small areas are scattered within savannah, resulting from multiple subdivisions over generations.
Generally, old households settled in the 1960s had “created” their own fields with forest clearings; they had inherited a part of their rice fields in the savannah and had developed new ones during the 1970s. They had also enlarged their cultivation areas within the “granted forest” (zone 2) during the same period; they owned a few large fields. At the time of research they had already given the majority of their lands to their children, explaining the relatively small area and divided structure of farmlands.
In both young and old households, the majority of lands is under cul-tivation, and the fallow periods are short (1 or 2 yr) followed by 2 or 3 yr of cultivation with annual crops (Table 3). Old households had given their woody fallows in zone 2 to their heirs, and young households had put those they inherited under cultivation. The remaining woody fallows were located in areas where nobody was farming; the numerous wild boars deterred them from creating fields in the absence of neighboring clearings.
The types 2 and 3 are classified as “mixed farms,” since households owned lands within the three zones. They represent more than half of the sample (57%, Table 1). Overall, forests represent a reserve of lands, especially for rice fields, and a source of income through spade handle production. For at least two generations, wood for fuel, house building, and furniture has been extracted from private eucalyptus plantations around villages.
The type 2 farms are composed of mature households (mean age of household head is 52 yr, Table 2), well-capitalized, and settled in savannah villages. Their extensive farmland is constituted of about 10 fields scattered between the three zones (Table 3). Rice fields are mainly located in the savannah (zone 1, 58%) and have been inherited. Sloping lands are mainly located in the “granted forest” (zone 2, 51%) and also in the “forest” (zone 3, 28%). A large part is unutilized (40% of woody fallows). Farms settled in the 1970s took advantage of both the authorized cultivation areas in the forest and the encouragement to legally develop rice fields in the forest, since they had a high labor force at this time. They cleared large areas of forest in order to mark their farmland even if these were left uncultivated during subsequent years due to lack of time and labor. They anticipated an inheritance to their offspring because of the scarcity of fertile lands in the savannah.
These households prioritized rice production associated with cattle breeding (2.7 zebus per household on average, Table 2) in the fields located near the house in the savannah. They used chemical fertilizers when animal manure was insufficient. Rice fields in the forest were too remote to be fertil-ized, and less productive because of peaty soils. A large portion of farmland
had been let lie in fallow (24%, Table 3). High rice yields in the savannah allowed a short lean period (4 months on average, Table 2). Households adapted their production systems by gradually increasing the diversity of marketed products. They developed small surfaces of cash crops (bananas, tobacco, sugar cane, beans, and peas) located on fertile sloping lands in the forest. They also sold surpluses of food crops, rum, and forest products, especially spade handles.
Type 3 farms are composed of young households (mean household head age of 34 yr, Table 2) with many young children and a low labor
force (UTH/UC = 0.74, Table 2). They came from savannah villages and
yet to have inherited sufficient rice fields. They developed new rice fields within zone 3, which were often located in remote, narrow inland-valleys since closer areas were mostly appropriated by older households (type 2). Fastidious and labor-intensive land development tasks called for supplemen-tary labor, which was often unaffordable. Income was insufficient to hire workers, and familial mutual aid required at least enough rice in reserve to feed the workers. Sources of income (rum, spade handles, and off-farm employment) were used to subsist during the long lean period of 6 months (Table 2). Breeding and fattening pigs could bring in enough money to buy rice and pay for labor for forest rice field development, but diseases were widespread and often jeopardized these projects. Rice field development in the forest was still rare (53% in fallow, Table 3) and households gave preference to rum and spade handle production. They also practiced illegal cultivation to grow sugar cane in hidden and remote forested sloping lands. As such, type 3 farmland was split into small areas of rice fields or unfertile sloping lands in savannah and remote forested lands, where they cultivated sugar cane and planned to develop rice fields when sufficient funds were available. They were forced to share their place of residence between the savannah village and an isolated house in the forest in order to take care of crops, and to produce rum clandestinely. They sought to reproduce their parents’ model, which consisted of clearing large areas in order to leave a legacy to their offspring.
Farm types 4 and 5 are classified as “forest farms” since households were settled in the forest and owned lands only within the forest. They rep-resent 30% of the sample (Table 1). None of them produced spade handles, because they never acquired the knowledge to do so.
Type 4 is composed of large scattered farms in self-subsistence origi-nating from eastern forest villages. They are settled in the eastern part of the
Fokontany of Iambara which is a colonized area contested by inhabitants
of the neighboring fokontany. Their land use strategy mainly consisted of marking their farmland by practicing shifting cultivation on sloping lands, developing rice fields in inland valleys and converting fallowed rice fields into pastures. Each familial group advanced along an inland valley. Mutual aid allowed them to clear new forestland, but a large part remained in fallow (32% of inland valleys and 48% of sloping lands; see Table 3). The majority
of young men were employed as workers in the tanala neighboring region on the east side of the corridor where people sought the skills of Betsileo farmers for developing rice fields in marshlands and terraces on sloping lands. This main source of income, complemented by sales of sugar cane, rum, and animals (pork and poultry), allowed for rice purchases to support some land development work and to face the long lean period (8 months). Corn and bean production on fertile forestlands compensated for the low productivity of rice fields; these crops were the main meals during the lean period, in addition to game animals (wild boars) and birds. Further sales of forest products (honey, crayfish, straw mats) by young men and women were limited.
Type 5 farms correspond to small farms settled in the forest with a weak labor force and insufficient food production, inducing a long lean period. These few cases (9% of households) belonged to family clans who had no more free forestlands at their disposal but continued practicing exten-sive farming based on shifting cultivation on the lower two thirds of the hill slopes surrounding their rice fields. Their farmland was consequently grouped together around their rice fields. These farms were primarily con-cerned with acquiring income to satisfy daily necessities. The heads of household practiced regular off-farm employment and their wives sup-plemented household income with forest product sales. These farms with difficulties couldn’t rely on agriculture to secure their livelihoods or their children’s future.
Land Use Strategies in Response to Conservation Measures
All the households interviewed were concerned about the constraints arising from conservation measures, but in different ways. Households in the savan-nah mainly complained about the fact that their right to sell spade handles had not been well-negotiated, since a third of their income had been with-drawn without any compensation. The inclusion of old woody fallows in the conservation area was also a source of concern. Many households decided to systematically clear any fallows, especially before the official establishment of the GCF, for fear of losing those lands not under cultivation. However, many households did not react in time and lost their lands. During the first 2 yr of the GCF, the rules were strictly applied, but under increasing complaints, the president of the COBA resigned and was replaced. Rules relating to spade handle sales and woody fallows subsequently became more flexible.
Among households settled in the forest, the understanding of con-servation rules was heterogeneous, depending on the village of origin. Some households originating from the neighboring eastern fokontany were accustomed to the regulations implemented during the establishment of Ranomafana National Park, as they were located in the peripheral area.
They put the GCF into the same category as a park, where tavy and forest product collections were totally forbidden. As they had already experienced police interventions in the past and feared Forest Service agents, they pre-ferred to stop any activity in the forest. They were worried about their future, since they saw no alternative to shifting cultivation. Others, who came from savannah villages or had relatives there, were better at circumventing rules or using them for their advantage. For example, they used the right to clear 25 m on each side of any rice fields as an authorization to expand rice fields and then to expand sloping lands under cultivation. Other households imitated this practice.
However, all households had to design new livelihood strategies to compensate for the lack of forest-product income and limitations on agricul-tural expansion both in the short- and the long-term. Each household type corresponded with a set of adaptations. Their spatial footprints are classi-fied and described in Table 4, and their relationship to household types is presented in Table 5 and Figure 4b.
For type 1 households (small divided savannah farms), the main constraints arising from the GCF were the prohibition of spade handle production and the integration of the remaining woody fallows into the conservation area. Although young households had anticipated this mea-sure and had hurried to convert these areas to cultivation before the signing of the GCF contract, elderly people, who relied less on those lands, were not affected directly by these measures. Such lands mainly constituted an inheritance, but many of the children of these households had emigrated to the city or other regions with better conditions for agriculture, and hadn’t used their inherited lands yet.
The prohibition of spade handle production represented a loss of half of these households’ annual income. Their dominant responses consisted of both short-term and long-term adaptations, with the objectives of intensify-ing rice production and increasintensify-ing animal production. In the short-term, they decided to carry on with illegal spade handle production in order to save money and invest in animal husbandry and to buy or rent new rice fields in the savannah (50%, Table 5). We refer to purchasing other farmers’ rice fields as “false rice expansion,” as it involves no changes in land use and as such had no spatial footprint (Table 4). These households also increased the share of the annual rice harvest that was sold in order to buy fertilizers and fatten pigs. This increase in rice sales translated into a drop in food intake.
Simultaneously, these households dedicated labor to gaining new culti-vated surfaces on pine plantations that had been abandoned by the Forest Service postharvest. The elderly households also claimed some acacia lands as their holdings, particularly in order to replace lost inheritances. We called this land use strategy a “return to savannah hill lands” (Table 4). These lands, located on hilltops, require more labor for cultivation and need fertilization. Labor intensification was possible because land shortages in
the savannah created an underused family labor force, which had turned toward spade handle sales. Household wastes provided material for fertil-izing former pine plantation lands according to new practices taught by NGOs. The new land use pattern generated by these combined strategies is represented in Figure 4b.
Thanks to diversified production systems, ample farmlands scattered between the three zones, and a high labor force based on mutual aid, the type 2 households (mature mixed farms) managed to cope with limitations on agricultural extension and spade handle prohibition more easily. In fact, they took advantage of GCF rules in order to re-delineate their farmland, especially the neglected lands in the inland-valley forest, and to expand their holdings in anticipation of increasing land pressure due to conservation measures, in both savannah and forest areas.
The loss of woody fallows in the granted forest posed problems to the older children of type 2 farm families, who lost their land heritage. They were obliged to turn toward forest marshlands let lie in fallow. They converted them into rice fields thanks to familial mutual aid. Their labor force was also mobilized to build terraces at the heads of valley-bottoms in the “granted forest” (zone 2). This strategy is called “rice expansion into forest” (Table 4) and was applied by 40% of type 2 households (Table 5). These new rice fields were intended to serve as their inheritance.
Sloping lands in forest were mainly cultivated with sugar cane. A liter of rum made of sugar cane sold in the village was 3 times more expensive than a spade handle sold in the market, and on average, farmers produce
120 L/yr, as opposed to 50 spade handles/yr. Small-scale rum production is
still forbidden in Madagascar, but we observed that sales in local markets were tolerated. Until sugar cane became productive, the cost of alteration work forced households to carry on with the illegal sale of spade handles for 2 to 3 yr following GCF implementation. The local community in charge of the GCF rules did not enforce any penalties, taking into consideration common economic difficulties arising from conservation measures.
Type-2 households also expanded their holdings in the savannah (30%, Table 5) and conducted a set of intensification practices that they con-sidered as “better crop care” such as plowing, regular hoeing, and the development of terraces in order to decrease soil erosion. We called this “excessive cropping frequency” (Table 4). These changes were mainly induced and supported by NGO interventions, which were focused on development of uncultivated areas and intensification in savannah lands (zone 1). Some of these also gained cultivated surfaces on pine and aca-cia plantations. Those who didn’t own sufficient forested land invested in rice fields in the savannah with income from rice sales and cash crops. The land use strategies conducted by the type 2 households are summarized in Table 5 and Figure 4b.
In response to the prohibition of spade handle production, the type 3 (split mixed farms) resorted to an increase in rum production and off-farm employment. In the forest (zone 3), they cleared sloping lands within the authorized 25-m strip, even if rice field development was unfinished, for fear of losing them. They built only one or two rice plots at each end of the inland-valley, thereby securing authorization to clear the whole surround-ings. Perennial crops, such as sugar cane and banana, were subsequently cultivated to give evidence of legal settlement. These households also moved animal production (pigs, poultry, and zebus) from the savannah to the for-est in order to benefit from larger areas without coming into conflict with any neighbors. Animal sales provided cash to pay the wages of workers, to help develop rice fields, and to clear forest on hill lands. An “excessive cropping frequency” allowed them to avoid forest regeneration. Each year, they increased surfaces cultivated with bean, corn, and tobacco crops. Some of them (33%, Table 5) cleared forest above the 25-m limit without an autho-rization from the president of the COBA. Herbaceous fallows in the “granted forest” (zone 2) were abandoned because of increased labor dedicated to forestlands.
Households settled in the forest displayed few strategies in response to new conservation regulations, and these were mainly designed to respond to the prohibition of slash-and-burn cultivation. Type 4 (scattered forest farms) mobilized the family labor force during 2 yr after GCF imple-mentation in order to convert their fallow marshlands into small rice fields, responding to fear of losing these lands if they didn’t convert them into rice fields. This often led to slapdash work to quickly build terraces and irrigation canals. They even called back their children, who had emigrated, because taking care of the “land of the ancestors” is con-sidered as a priority for Betsileo families. None of them had yet been affected by the conservation measures because they cultivated enough fertile forestlands surrounding their new rice fields to feel unthreatened. Some of them (29%, Table 5) increased land area under production each year without clearing new mature forest area, inducing a decline in fallow cycles and making plowing necessary before cultivating cas-sava. To replace declining yields they developed sugar cane for rum production. They also paid workers in cash to develop new rice fields (Figure 4b).
The type 5 (grouped) farms increased the period of off-farm employ-ment, staying away for almost the whole year. These households complained of a decrease of their food intake (based on beans, cassava and sweet pota-toes) due to a decrease in yields. They put fewer lands under cultivation each year because of the slash-and-burn prohibition. They also gave less crop care because of their lengthy absences. They found themselves forced to buy food for the whole year.
Land Use Changes at Territorial Scale
The new land use patterns for each type of household are represented in Figure 4b. Under the scenarios we observed, land use strategies at the farm level produced an increase, a decrease, or no change in the cultivated area in the different land use zones. Increases were caused by the development of rice fields in marshlands and the cultivation of former pine and acacia plantations or meadows in the savannah. Changes in the hierarchy of crops, intensification, or an increase of the amount of land under production each year due to a decline in fallow cycles, represents no overall change in the cultivated area. A decrease in the cultivated area coincided with the aban-donment of herbaceous or ligneous fallows. Table 6 outlines the prevalence of these dynamics by land use zones as a function of the percentage of farms that conducted each land use change.
Paradoxically, land use strategies expanding cultivated areas have been applied in fields located in the forest (zone 3). Forty-four percent of farm-ers owning fields in this area enlarged their fields by converting forest into cultivation area (Table 6). Numerous scattered marshlands in the forest were converted to rice fields with surfaces ranging from 0.05 to 0.30 ha, and this conversion was systematically accompanied by the clear-cutting of mature forest on each side in a 25-m strip. A house was generally built halfway up the hillside in order to manage the crops, and to give evidence of property ownership. Intensive development of rice fields along rivers was accelerated. While residence was previously shared between villages in the savannah and isolated houses in the forest, permanent residences now also appeared in the conservation area. Those new settlements were scattered and enclosed within the forest on small land areas. This increased the contact between for-est and agriculture, and coincided with a worsening of livelihood conditions. Households migrating from the savannah complained about wild animal invasions, since they were inexperienced hunters, and also the invasion of weeds and human diseases due to the humid, cold forest climate.
In the “granted forest” and in the savannah, the main strategies were not to change the overall area cultivated, but rather to intensify in the first zone and to plant cash crops and perennial crops plantations in the second zone. In those zones, extension of agricultural land was also observed in several cases (19% in savannah; 34% in the granted forest) and took place mainly on wooded areas. Pine plantations in savannah were converted into cassava fields, and woody fallows in the granted forest had almost all been clear-cut in order to avoid them from being included in the protected area after 8 yr of regeneration. Forests in the granted forest area and the savannah landscape became sparse, and the frontier in the granted forest between agricultural land and the GCF became visually more marked.
A decrease in cultivated area was mainly observed in the granted forest (18%, Table 6), and resulted from the abandonment of herbaceous fallows in